Category:
Shiba InuSHIB Price Rally Fades After 40% Breakout: Can Bulls Recover?
The Momentum Fizzles: Understanding SHIB's Recent Price Action 📉
Shiba Inu has experienced a dramatic turn of events in recent trading sessions, with the meme coin's impressive 40% surge suddenly losing steam as sellers mounted aggressive resistance. What began as an exciting breakout moment has transformed into a cautionary tale about the volatility that defines the altcoin market. SHIB price initially climbed from approximately $0.0000041 to nearly $0.0000058, capturing the attention of traders worldwide—but the celebration proved premature.
The token's inability to maintain its peak levels has left the cryptocurrency community questioning whether this rally represents a genuine trend shift or merely a temporary liquidity event. Currently trading near $0.00000468, SHIB sits roughly 20% below its intraday high, having surrendered most of its explosive gains. This pullback highlights a critical reality in crypto trading: breakouts don't always deliver sustained upside momentum.
What Triggered the Initial Rally? 🚀
Several factors converged to spark SHIB's impressive breakout earlier this month. South Korean retail traders reportedly increased their activity around the token, while simultaneously, the Shiba Inu ecosystem announced a significant acceleration in token burn rates. These developments typically signal bullish sentiment among both retail and institutional participants.
Wale activity also picked up noticeably during the rally phase, suggesting that larger players recognized potential opportunity in the move. However, the rapid reversal indicates that not all participants shared the same conviction about sustained higher prices. Many traders appear to have viewed the breakout as a profit-taking opportunity rather than the beginning of a longer-term uptrend.
Technical Analysis: Where Are the Key Support Levels? 📊
The 4-hour chart reveals that SHIB has transitioned from its vertical advance into a tighter consolidation pattern. The token is currently trading around its 20-period and 50-period simple moving averages, positioned near $0.00000466 and $0.00000468 respectively. These levels represent critical battleground territory where bulls must establish a higher foundation following the breakout.
Stronger support zones lie further below at the 100-period SMA around $0.00000444 and the 200-period SMA near $0.00000437. Importantly, both of these longer-term averages continue climbing, and SHIB maintains its position above them—preserving the short-term recovery structure that bulls need to maintain confidence.
The MACD indicator presents a more nuanced picture. The convergence of the MACD and signal lines near zero demonstrates that selling momentum has decelerated, yet buyers haven't accumulated sufficient strength to initiate another sustained advance. This neutral positioning suggests the market remains in a state of indecision.
Critical Resistance and Breakout Potential 💪
For SHIB to demonstrate genuine recovery potential, bulls must overcome several resistance barriers. A 4-hour close above $0.0000048 would serve as an early bullish signal, potentially attracting fresh buying interest. Should this level hold, immediate resistance appears at $0.0000050, followed by the post-breakout supply zone spanning $0.0000052 to $0.0000054.
Breaking through the rally peak near $0.0000058 would reopen the path toward $0.0000060 and the May resistance zone around $0.0000064. However, each of these levels represents a psychological and technical hurdle that has previously rejected upward momentum. The path to recovery requires persistence and consistent demand.
The Liquidation Map: A Warning Signal for Volatility ⚠️
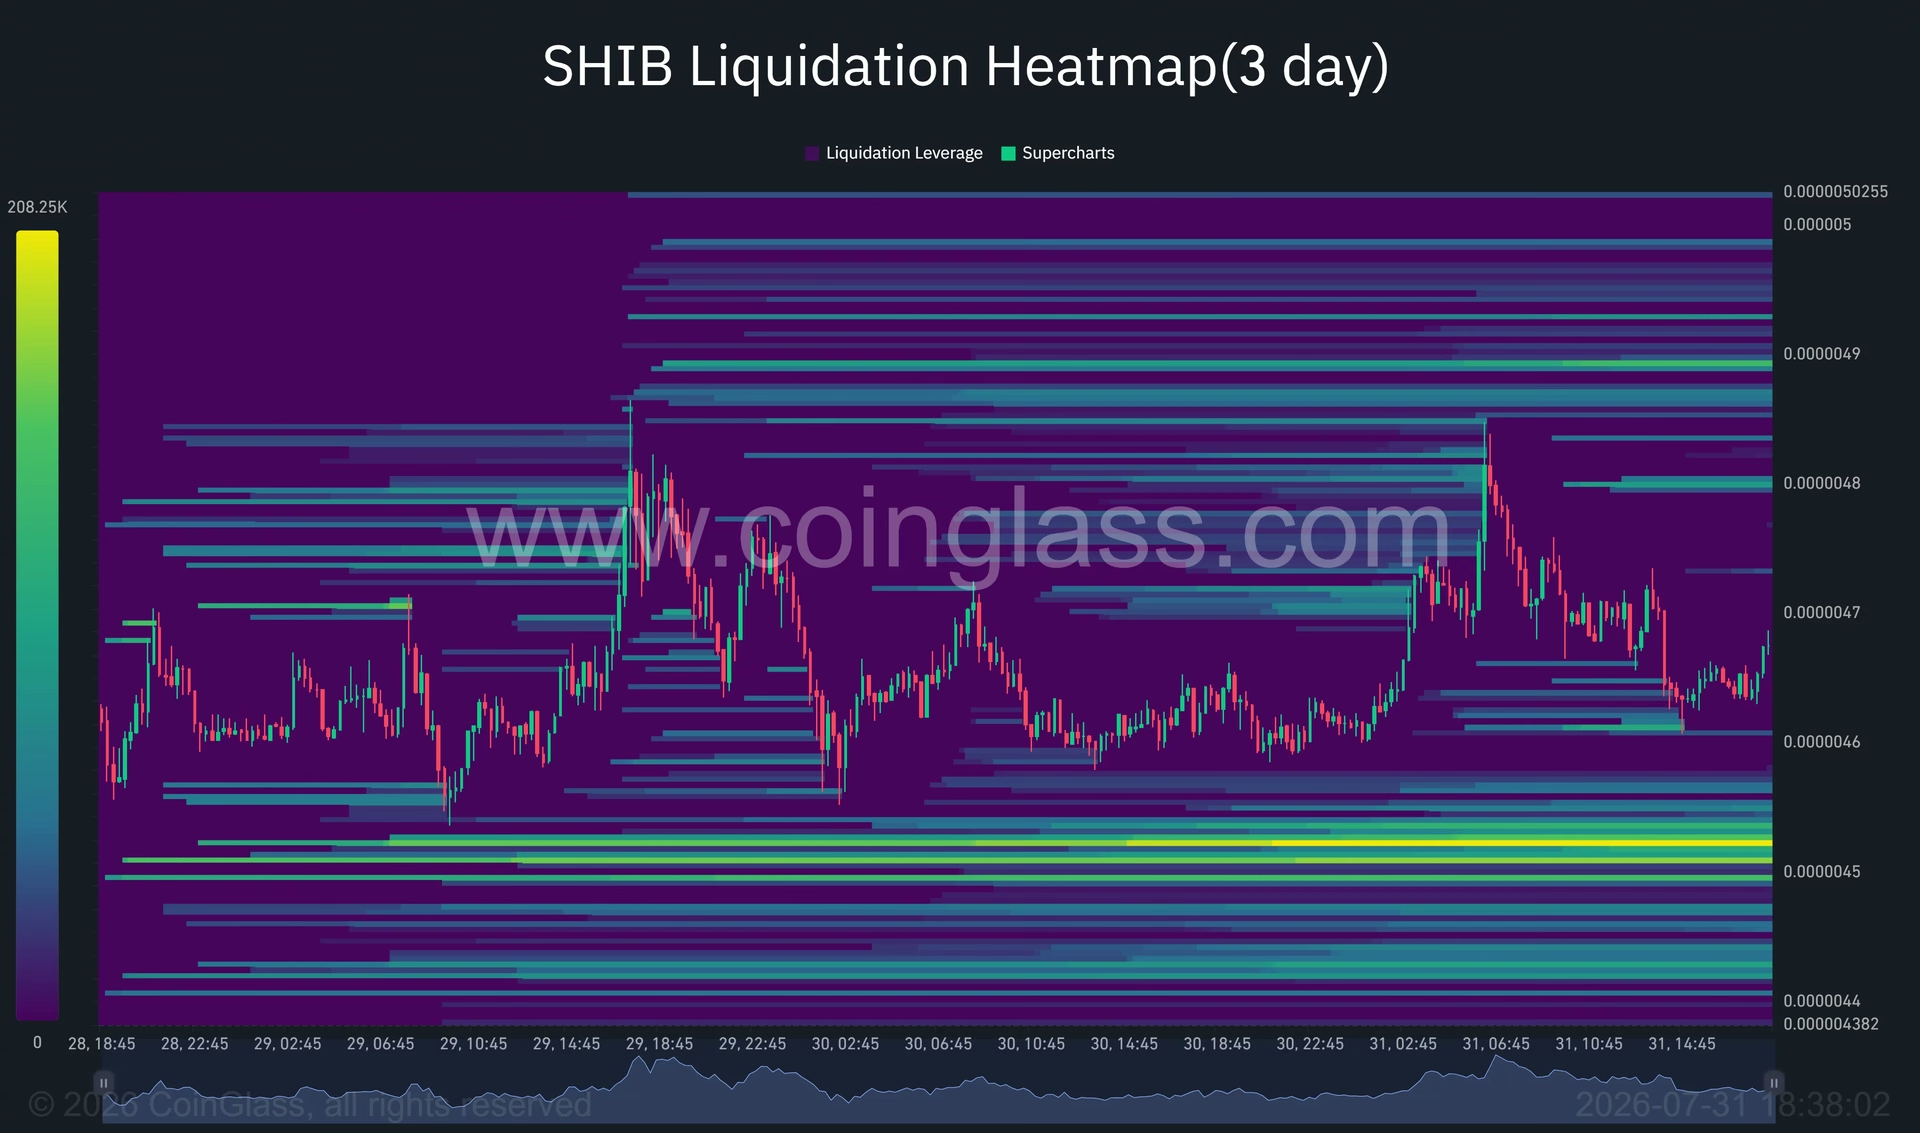
The 3-day liquidation heatmap reveals a concerning distribution of leverage that could trigger additional volatility in either direction. The largest concentration of leveraged positions sits below current prices, clustered between $0.00000450 and $0.00000452. This dense liquidity band represents a magnet for price action, potentially attracting SHIB downward if support at $0.0000046 fails to hold.
Below that zone, additional leverage concentrates around $0.0000044. A breakdown through both clusters would essentially erase the entire breakout gains and expose the July base near $0.0000041. Conversely, upside liquidity appears comparatively scattered, with the first meaningful clusters near $0.0000048 and $0.0000049, followed by another band around $0.0000050.
This asymmetrical liquidation structure suggests that a sweep toward $0.0000045 could occur before either bulls or bears establish definitive control. The dense leverage positioning below current prices creates significant risk of a liquidation cascade if support breaks.
Daily Chart Indicators: Reasons for Cautious Optimism 🔍
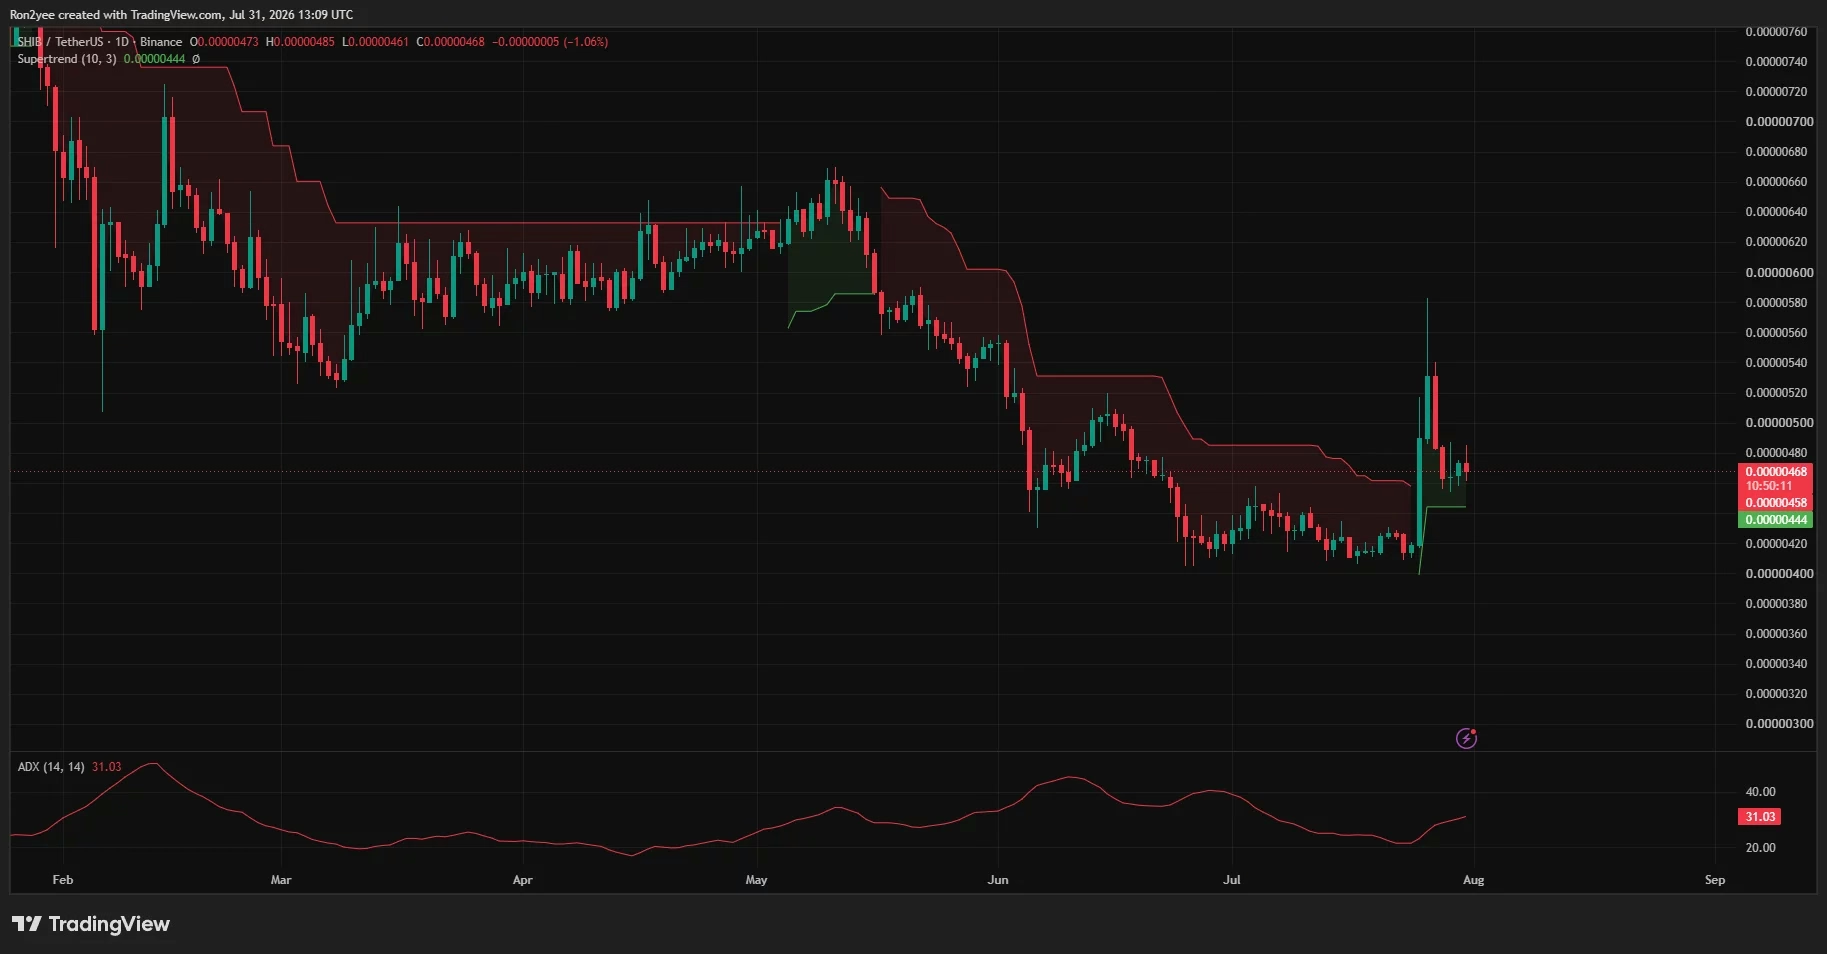
While the 4-hour timeframe shows consolidation and indecision, the daily chart preserves some constructive elements that shouldn't be ignored. SHIB continues trading above the Supertrend support level at approximately $0.00000444, a level that recently flipped from bearish to bullish following the breakout. Losing this support on a daily closing basis would reverse the improvement and significantly increase the probability of a decline toward $0.0000042.
The Average Directional Index (ADX) has climbed to 31.03 from below 20, confirming that volatility has developed into a stronger directional trend. An ADX reading above 25 typically indicates trend strengthening, though the indicator itself doesn't determine whether that trend will remain bullish or shift bearish. This elevated ADX suggests that SHIB will likely experience pronounced moves in one direction or the other in the coming sessions.
What Recovery Would Look Like 📈
For bulls to successfully recover from this pullback and establish a new uptrend, several conditions must align. The immediate confirmation would require SHIB to move above $0.0000049, followed by a successful recovery of $0.0000052. These sequential breakthroughs would demonstrate that buyers possess the conviction and firepower to overcome resistance zones.
Pseudonymous analyst SHIBMortal noted that "the floor seems to be holding (so far)," though cautioning that "we are not out of the woods yet." This assessment captures the current market sentiment—bulls have managed to prevent a complete collapse, but the recovery remains fragile and vulnerable to further selling pressure.
Market Context: The Broader Altcoin Landscape 🌍
SHIB's current struggle reflects broader dynamics affecting the entire altcoin sector. Meme coins inherently carry higher volatility than Bitcoin and large-cap altcoins, making them substantially more sensitive to shifts in risk appetite and macroeconomic conditions. Changes in interest-rate expectations, geopolitical tensions, and regulatory announcements can trigger outsized moves in tokens like SHIB.
The crypto market's sensitivity to US economic data and policy announcements means that SHIB's next move may depend significantly on US trading hours activity. During periods of risk-off sentiment, money typically flows toward perceived safer assets, leaving speculative tokens vulnerable to sudden selling pressure.
The Bottom Line: What's Next for SHIB? 🎯
The setup remains neutral above $0.00000444 and turns constructive only if SHIB successfully reclaims $0.0000049. A daily close below $0.00000444 would invalidate the short-term bullish structure and place July's lows back in focus as the next significant target.
Bulls have preserved part of the breakout gains, but the failed move above $0.0000054 demonstrates clearly that another sustained rally will require stronger and more persistent demand. The liquidation structure favors continued volatility, meaning traders should prepare for potential sharp moves in either direction. The coming sessions will prove critical in determining whether this breakout represents the beginning of a genuine recovery or merely a false signal that ultimately leads to lower prices.