Category:
SolanaSolana Eyes $80 Resistance Amid Falling Wedge
Solana (SOL) has been navigating turbulent waters as it attempts to conquer the $80 psychological threshold. Despite the prevailing macroeconomic challenges and a complex market landscape, the emerging bullish chart pattern known as the 'falling wedge' keeps investor hopes alive for a potential breakout.
Understanding the Falling Wedge Pattern 📉
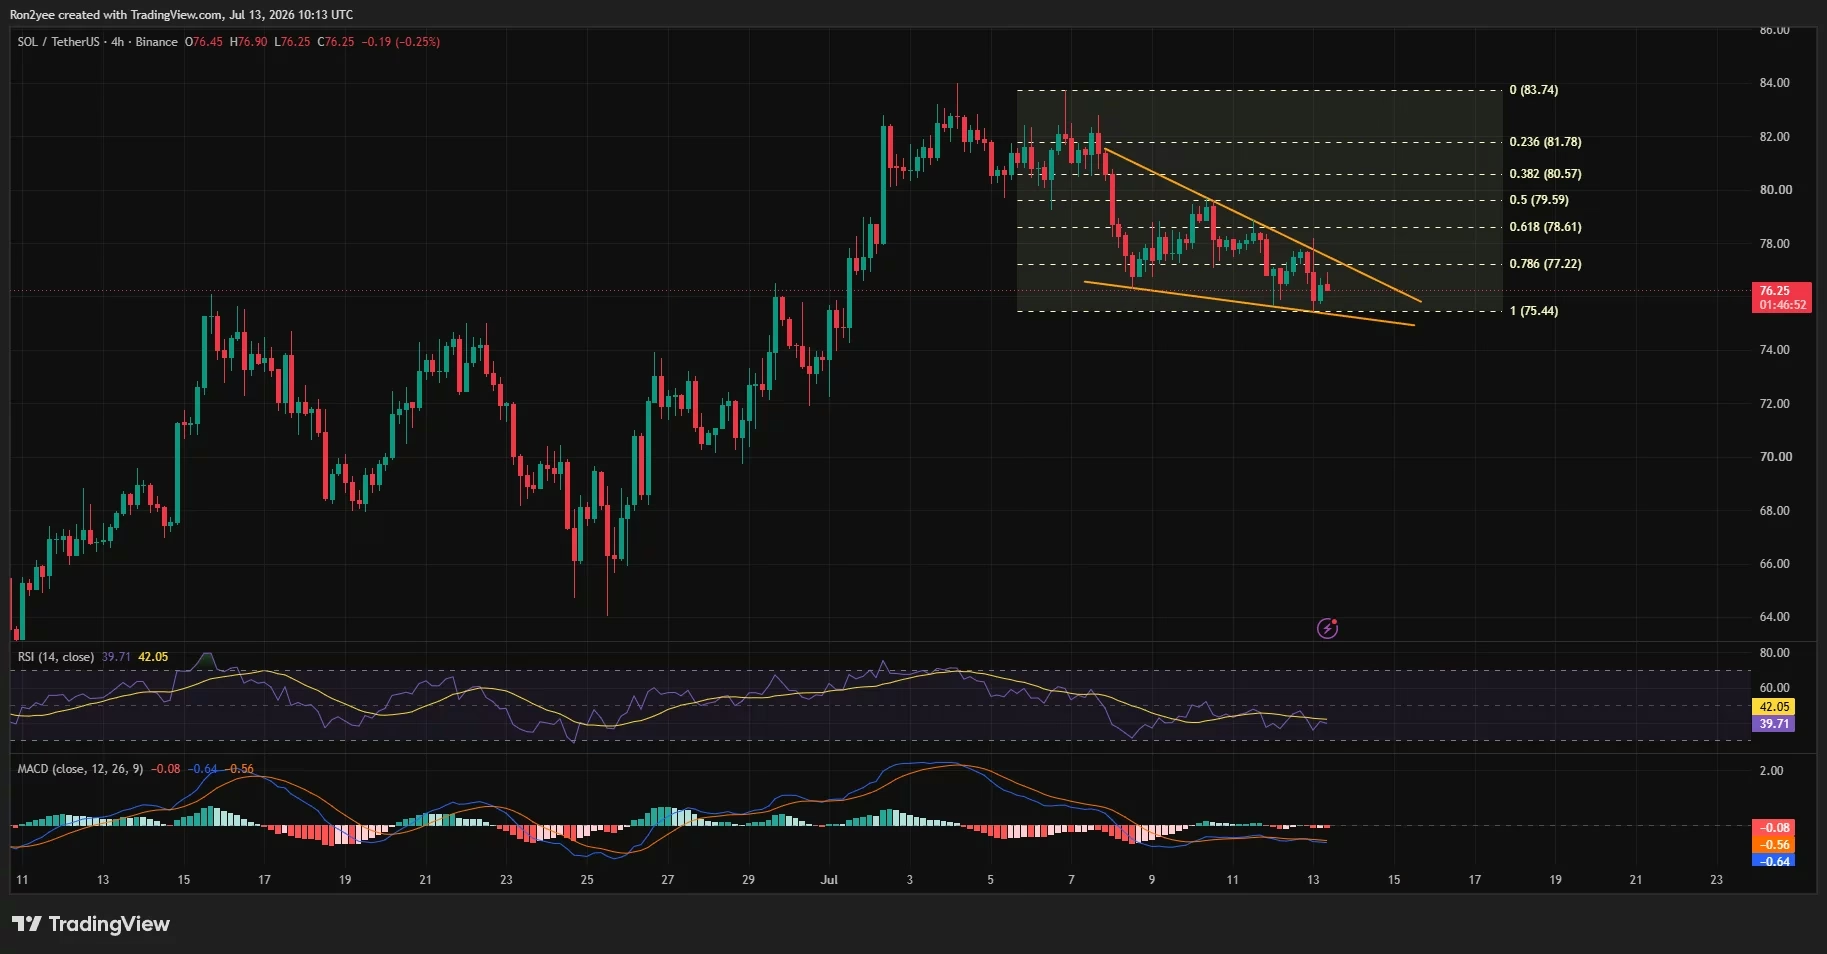
The falling wedge is a technical pattern that often signals a potential reversal in a downtrend and is characterized by converging trend lines. Solana's recent price movements have formed a falling wedge, which could indicate a bullish reversal if the upper trend line is breached.
Key Levels to Watch
Solana's price action has been compressed between descending trend lines, with support around the Fibonacci 100% retracement level near $75.4 and resistance gradually declining towards $78.5. A breakout above these constraints could expose the 61.8% Fibonacci level near $78.6 and eventually the crucial $80 mark.
Market Dynamics and Institutional Sentiment 🔍
The broader cryptocurrency market sentiment is heavily influenced by macroeconomic factors, including rising U.S. Treasury yields and fluctuating interest rate expectations. These elements have put pressure on high-beta assets like Solana, leading to cautious institutional engagement.
Institutional Inflows and On-Chain Activity
Despite the macro headwinds, Solana's network activity remains robust. Active addresses hover near yearly highs, and transaction throughput benefits from speculative meme coin trading and recent network upgrades. However, these on-chain gains have yet to translate into a significant price increase, as capital circulation remains largely internal.
Technical Indicators: A Mixed Bag
Analyzing Solana's momentum indicators reveals mixed signals. The 4-hour RSI is below the neutral 50 mark, indicating subdued buyer momentum. Meanwhile, the MACD is below its signal line, though the bearish momentum appears to be waning.
Resistance and Support Zones
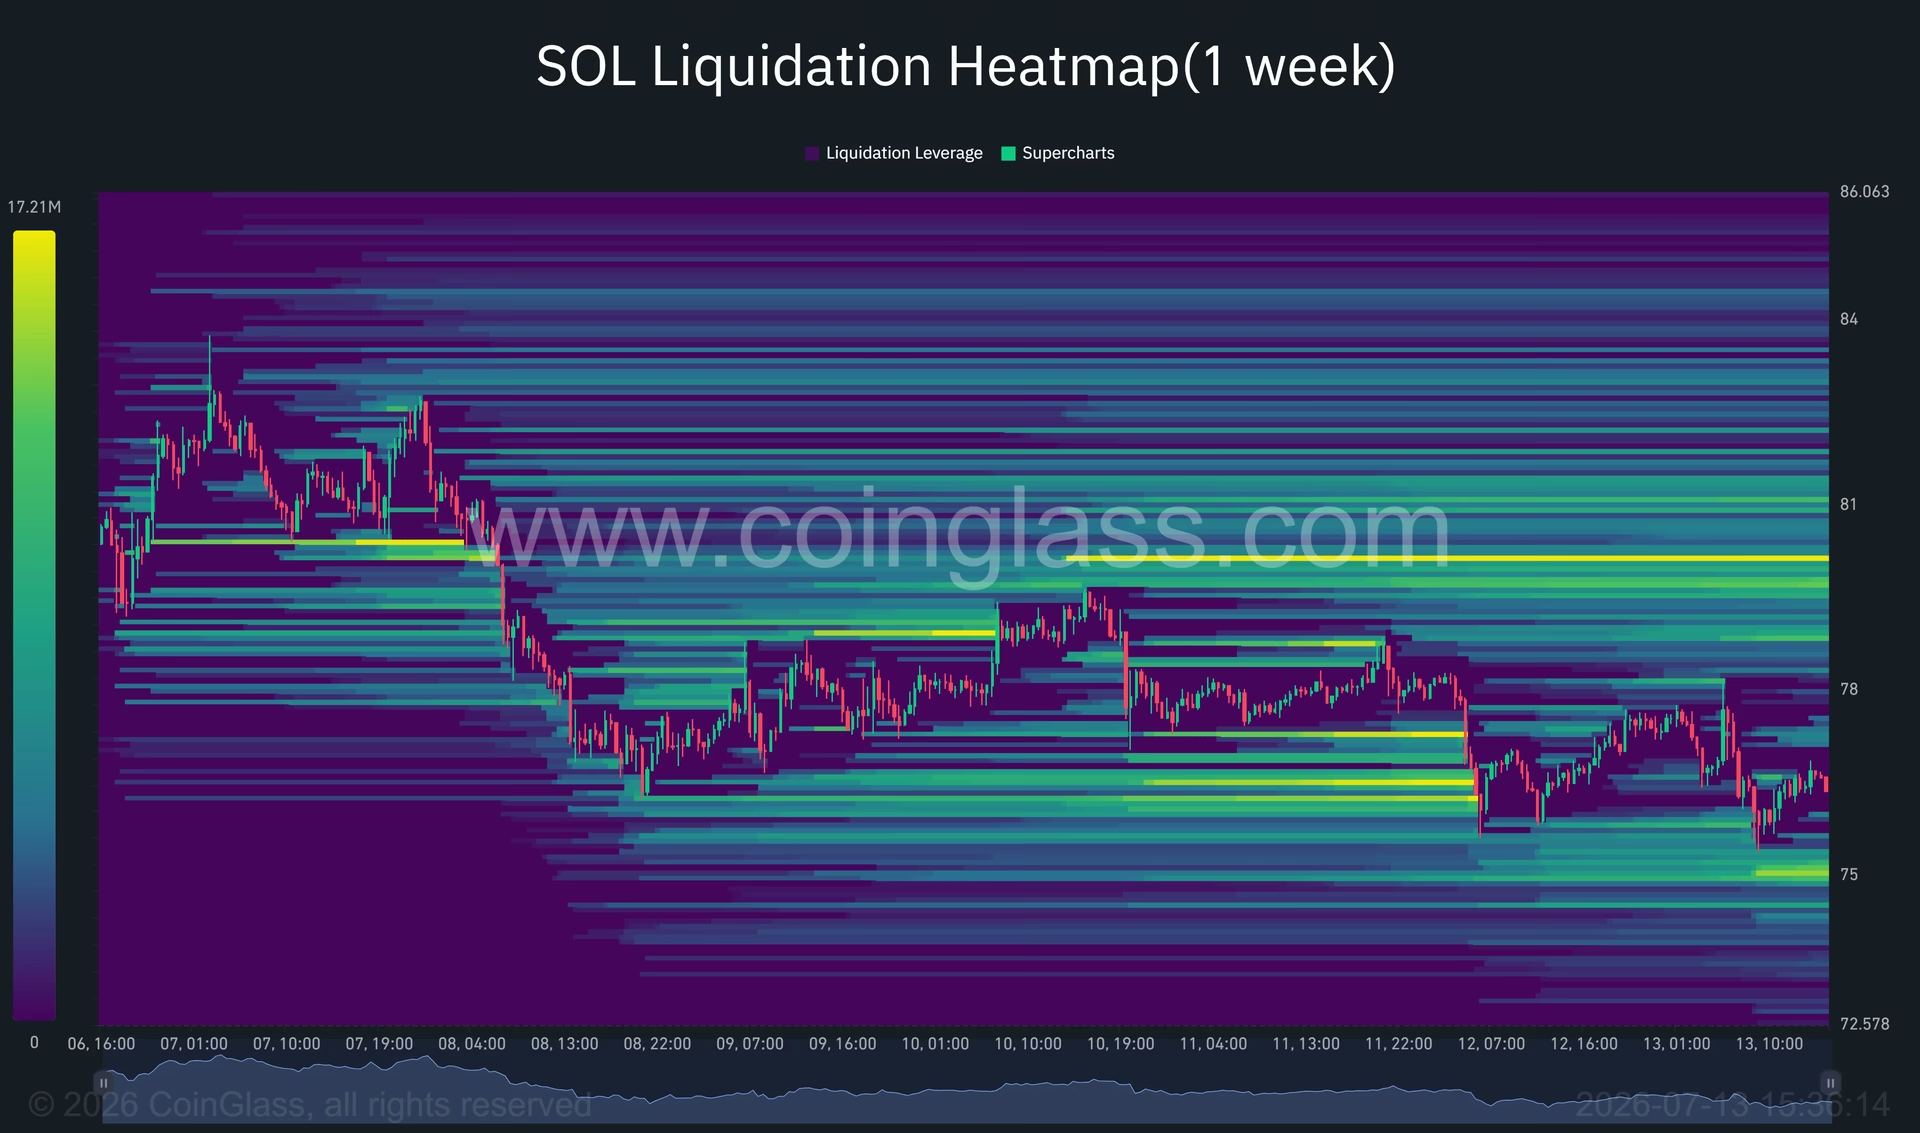
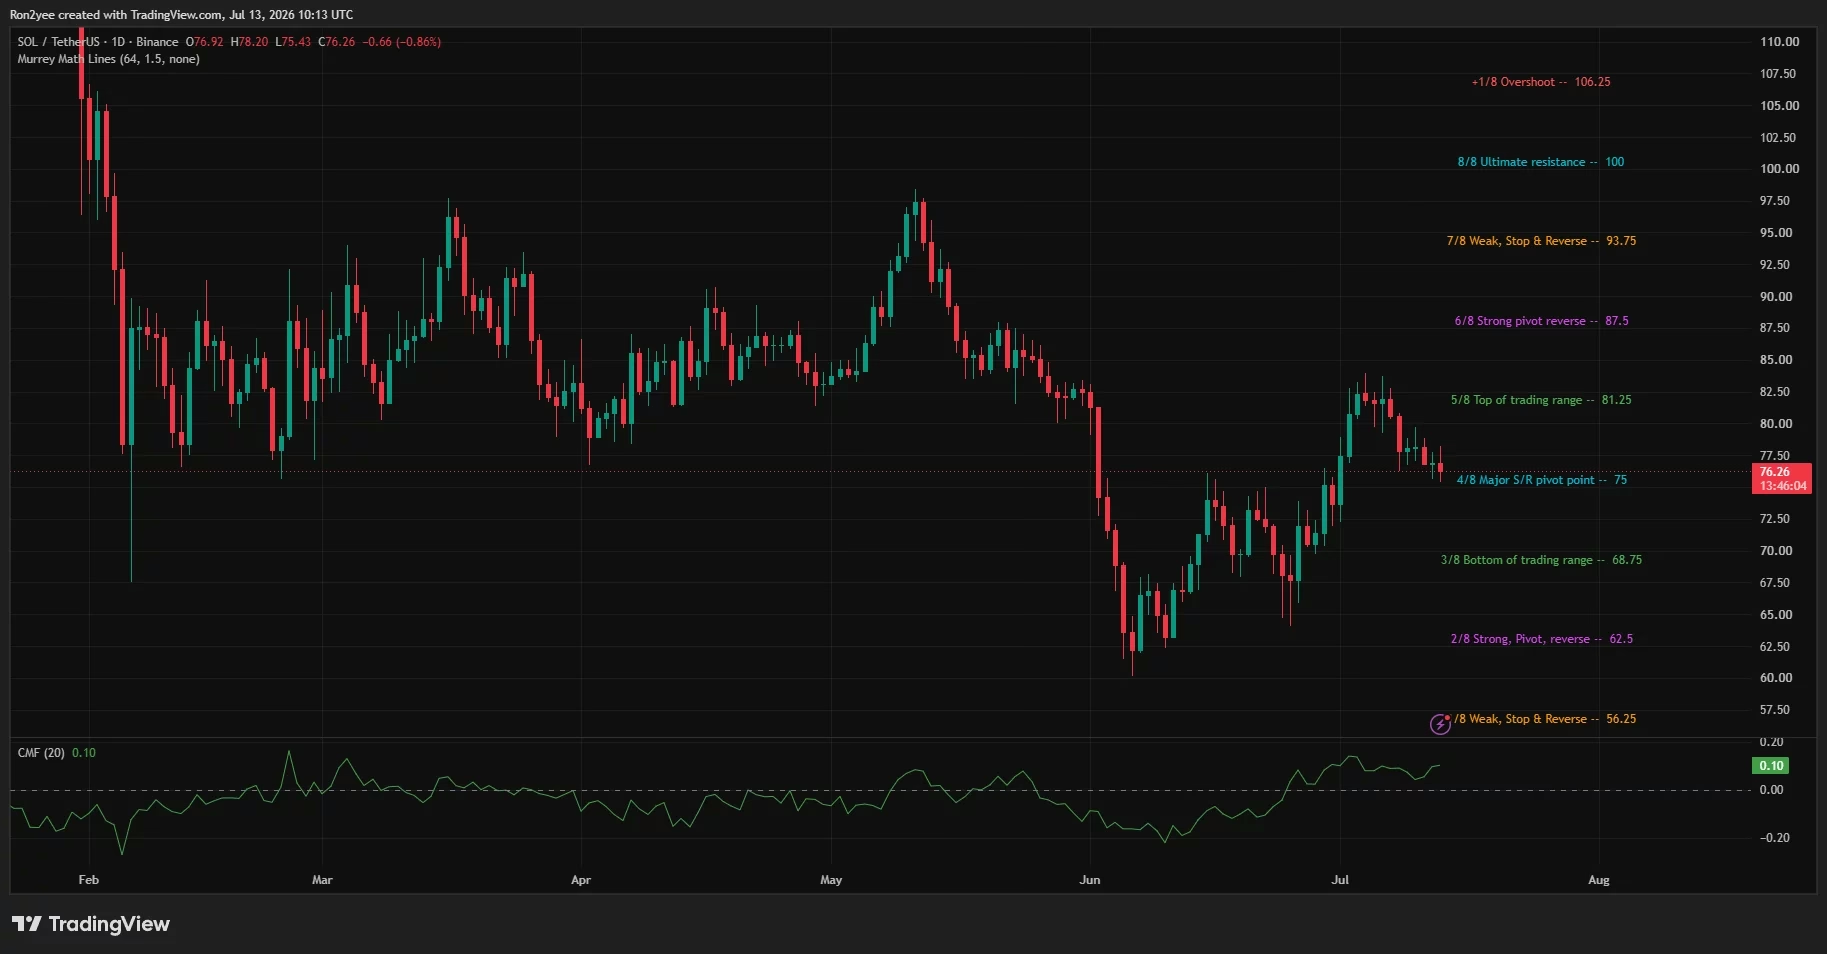
The market has consistently rejected advances toward the $81.25 Murrey resistance, highlighting the importance of the $80-$81 zone. Derivatives data points to significant short liquidation clusters around $79.5-$80, which could propel an upside move if breached.
Macro Headwinds: A Persistent Challenge 🌐
The bullish potential of Solana's falling wedge is contingent on favorable macroeconomic conditions. Rising interest rates and inflation data are pivotal factors to watch in the coming weeks. A decisive close below the $75 support could undermine the bullish setup, while sustained buying above $80 might catalyze a rally towards $83-$84.
Conclusion: Will Solana Overcome the $80 Barrier? 🚀
Solana's journey towards breaking the $80 resistance is fraught with challenges, yet the falling wedge pattern provides a glimmer of hope for bullish investors. As macroeconomic factors continue to play a significant role, traders should keep an eye on key support and resistance levels, along with broader market indicators.
While Solana's network activity suggests underlying strength, external market forces and institutional sentiment will ultimately determine its short to medium-term trajectory.