Category:
SolanaSolana Price Breaks 200-Day SMA: $100 Target in Focus
A Bullish Breakout Reshapes Solana's Technical Landscape 🚀
Solana has staged a remarkable recovery that's capturing the attention of traders and investors across the cryptocurrency market. After months of consolidation, SOL has decisively cleared multiple critical technical barriers, including the pivotal 200-day simple moving average—a breakthrough that typically signals a shift in longer-term market sentiment.
The rally represents far more than just another price spike in the volatile altcoin space. It reflects a convergence of technical strength, institutional interest, and broader cryptocurrency market dynamics that could reshape SOL's trajectory in the coming weeks.
The Week That Changed Everything 📈
Solana's price action over the past seven days has been nothing short of spectacular. The token surged approximately 25% in just one week, reaching a peak of $93.39 on August 21 before settling near $92. This aggressive move extended well beyond the typical daily volatility that characterizes most altcoins, signaling that something fundamental had shifted in market participant behavior.
What makes this advance particularly significant is the breadth of resistance levels that SOL conquered simultaneously. The token didn't just break one or two technical barriers—it cleared its 20-day, 50-day, 100-day, and most importantly, its 200-day moving averages in a single decisive move. This convergence of broken averages typically indicates that a sustained uptrend may be beginning to take hold.
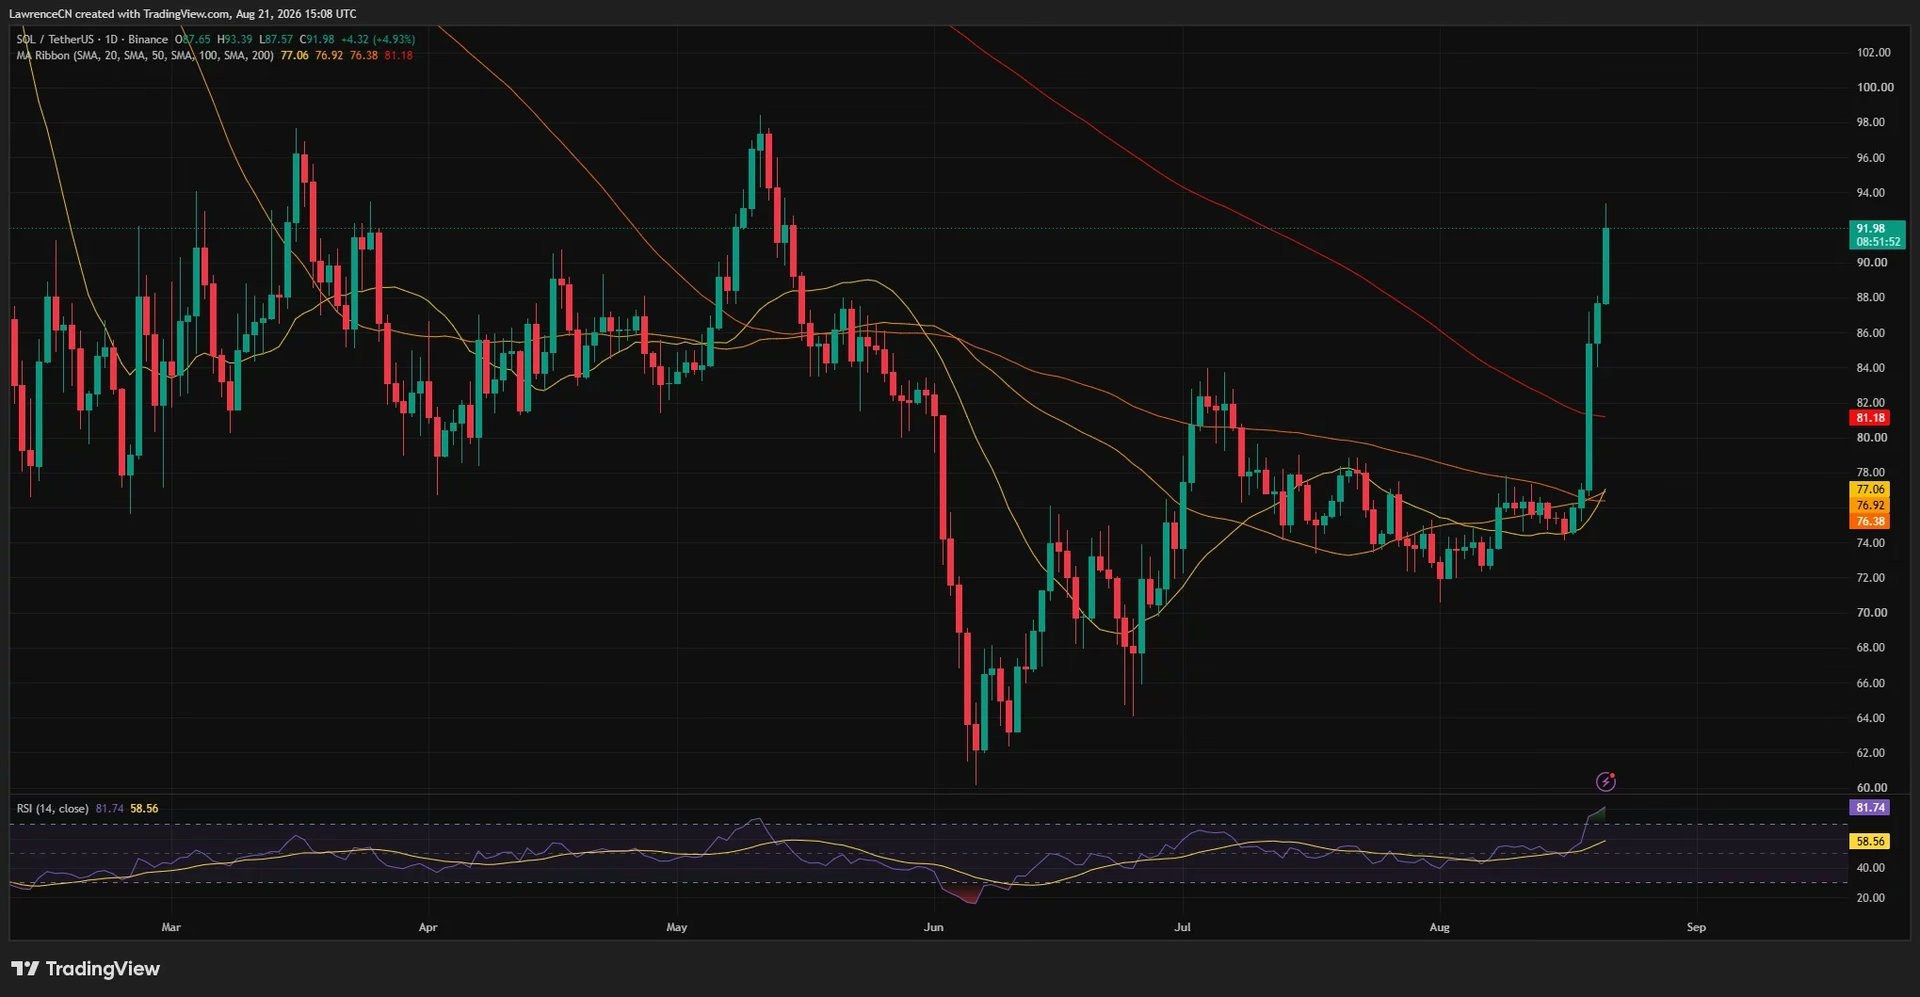
The breakout originated from a price range that had confined SOL between June and August. For roughly two months, sellers had repeatedly defended the $76–$78 resistance zone, turning back multiple recovery attempts. When that zone finally gave way, it opened the floodgates for a rapid repricing of the asset.
Understanding the Technical Setup 🎯
Solana's chart now displays a fundamentally different structure than it did just weeks earlier. Previously, the market had established a pattern of lower highs—a classic bearish signal that suggested sellers remained in control. That dynamic has reversed.
The current setup shows SOL trading above its shorter-term moving averages, which are tightly clustered around $76–$77. This clustering creates a clearly defined support zone that could provide a foundation for further advances. Any pullback into this region would represent what technical analysts call a "full retest" of the breakout level.
More importantly, SOL has now returned to price levels not seen since May. Back then, the $94–$98 range represented significant seller interest, with market participants defending those levels aggressively. The question now becomes whether those same sellers will step in again or whether market conditions have fundamentally changed.
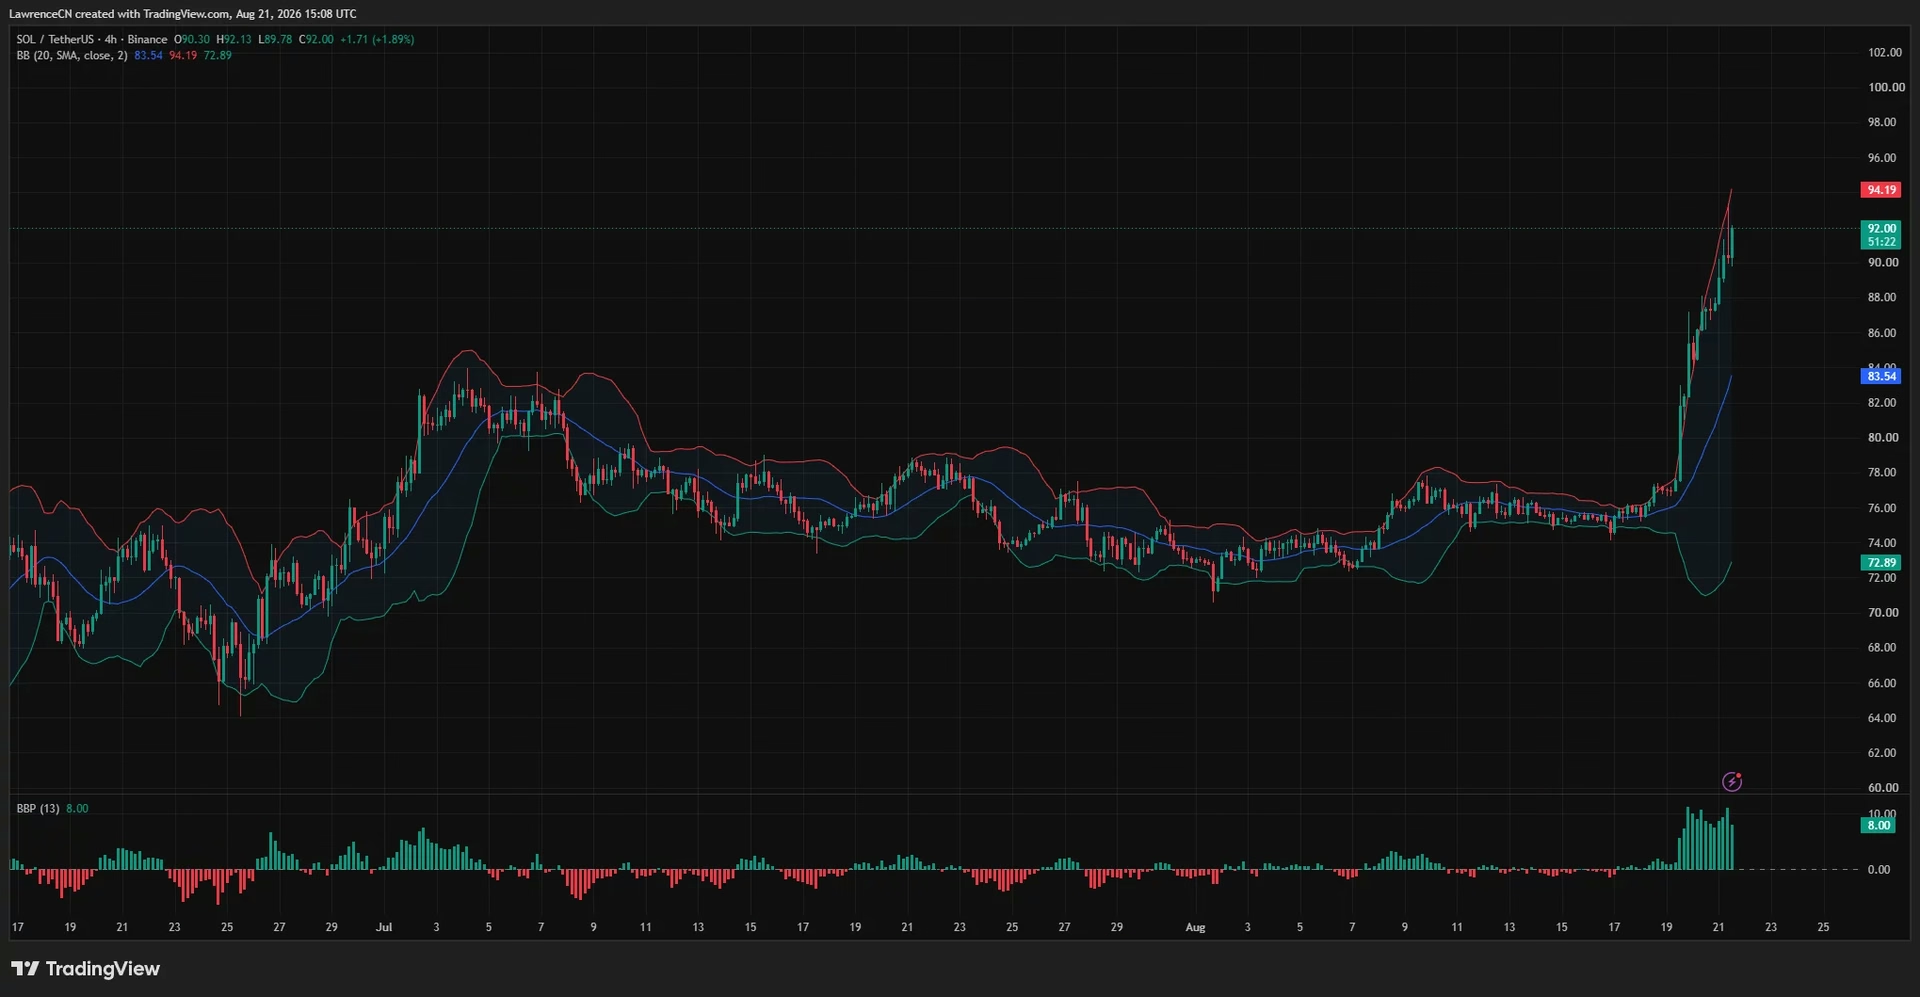
The 4-hour timeframe reveals just how stretched the recent advance has become. SOL traded near $92 while the upper Bollinger Band sat at $94.19, indicating that price had separated significantly from its recent mean. The middle Bollinger Band, positioned at $83.54, showed the magnitude of the move relative to normal volatility.
The Overbought Warning Sign ⚠️
While the technical breakout appears impressive, one crucial metric demands attention: the relative strength index. SOL's 14-day RSI reached 81.74—well into overbought territory and significantly above the 70 level that traders typically associate with stretched conditions.
It's important to understand what overbought actually means. An RSI reading of 81 doesn't necessarily predict an imminent reversal. Rather, it indicates that price has risen much faster than its recent average, suggesting that the market may need a consolidation period before another sustainable advance can develop.
Historically, assets with RSI readings this elevated have experienced pullbacks or sideways consolidation. However, during strong trending markets, overbought conditions can persist longer than traders expect. The key is monitoring whether SOL can hold its major support levels during any potential pullback.
Where the Liquidity Clusters Tell the Story 💧
Understanding where traders have positioned their orders provides crucial insight into likely price targets and potential resistance zones. The liquidation heatmap reveals a particularly interesting pattern for Solana's price action.
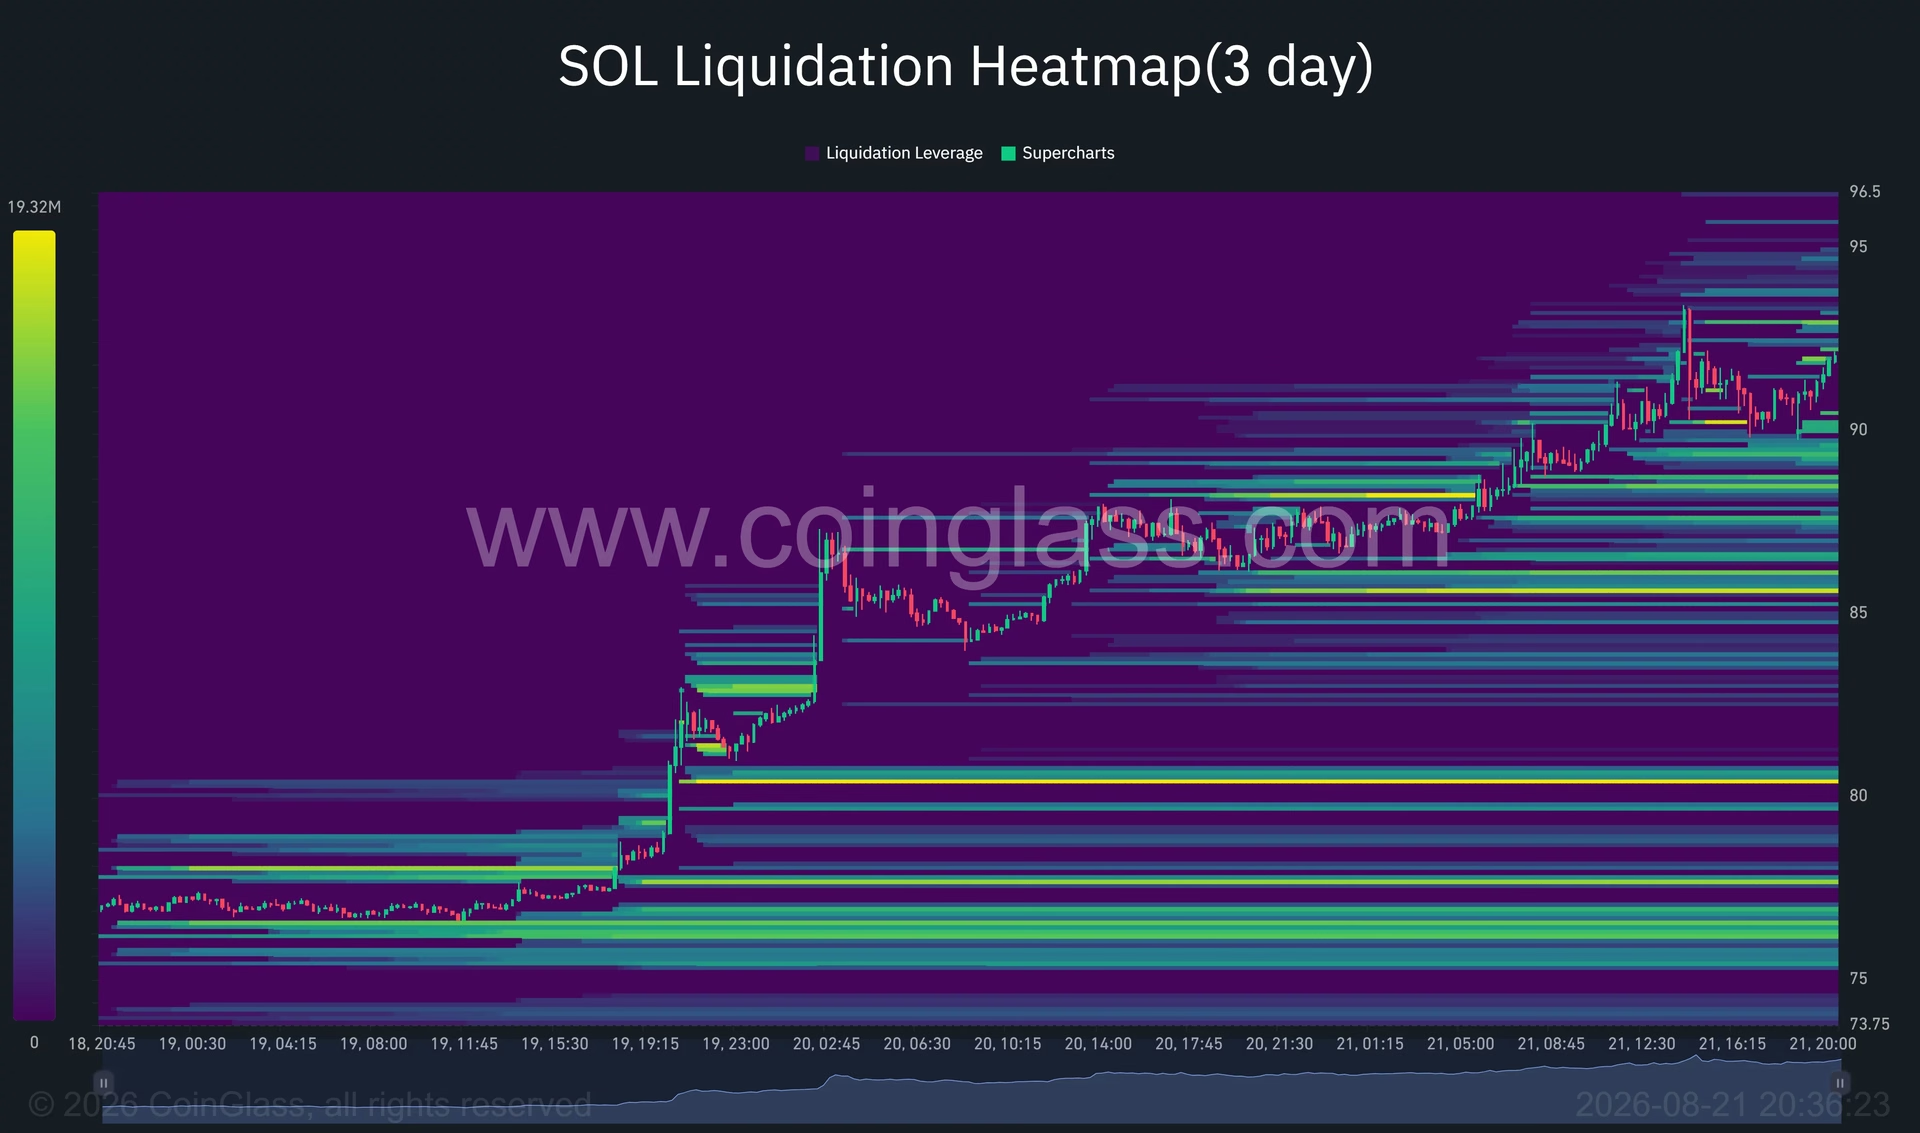
As SOL climbed from $80 toward $92, it moved through several layers of short liquidity—concentrated clusters of stop-loss orders from traders betting on lower prices. These forced liquidations likely accelerated the move, creating a self-reinforcing cycle where higher prices triggered more short closures, which pushed prices even higher.
The most critical observation from the heatmap involves the zone between $93 and $95. This area contains the densest concentration of remaining liquidity, suggesting that breaking through this range could trigger another wave of forced buying. However, the heatmap also shows that liquidity becomes considerably less dense once SOL moves beyond $95.
Downside liquidity presents an equally important picture. Support clusters appear near $90, $88, and $86, with a particularly significant concentration around the $80–$81 zone—precisely where the 200-day moving average resides. This creates a compelling narrative: if buyers lose control, they have multiple support levels to defend before reaching the long-term moving average.
Institutional Catalysts Fueling the Rally 🏢
The technical breakout didn't occur in a vacuum. Multiple fundamental developments have provided genuine catalysts for renewed interest in Solana.
Shinhan Asset Management, a major South Korean financial institution, announced a partnership with the Solana Foundation to develop a tokenized bond fund denominated in Korean won. The pilot program models itself after BlackRock's BUIDL product, representing a significant step toward mainstream institutional adoption of blockchain-based financial instruments.
This development matters because it signals that major traditional finance players are actively building infrastructure on Solana. While the immediate impact on SOL's price may be limited until the fund reaches meaningful scale, the precedent is powerful. Each successful institutional product launch on Solana provides validation that the network can support real-world financial applications.
Beyond institutional partnerships, Solana's network activity has strengthened considerably. The blockchain reportedly processed 1.2 billion non-vote transactions in a single week—a metric that demonstrates genuine utility and user engagement. Recent network upgrades, including increased compute limits per block, have expanded application capacity. The planned Alpenglow upgrade promises to reduce finality times and modify validator voting mechanisms, addressing long-standing criticisms about Solana's network performance.
Regulatory Tailwinds and Macro Conditions 🌍
The broader environment for risk assets has also improved materially. Several factors have converged to support cryptocurrency prices more generally:
Monetary and Fiscal Dynamics: US Treasury buyback programs have reduced long-term yield pressure, while a weaker dollar has made dollar-denominated assets like cryptocurrencies relatively more attractive to international investors.
Regulatory Progress: Washington's renewed push for the Digital Asset Market Clarity Act and the SEC's proposed Regulation Crypto Assets framework have improved sentiment around regulatory clarity. While both initiatives require further action before becoming final policy, the direction of travel matters for market psychology.
Short Squeeze Dynamics: A broader cryptocurrency short squeeze erased more than $4 billion in bearish positions over 48 hours. Solana participated enthusiastically in this move, recording wider price swings than several large-cap peers—a pattern consistent with SOL's historical tendency to amplify market sentiment changes.
The Path to $100: What Must Hold 🎪
For Solana to reach the psychologically significant $100 level, several conditions must align. First and most importantly, SOL must maintain a sustained close above the $93–$95 liquidity zone. This region represents the first major test of the breakout's legitimacy.
Should SOL break decisively through $95, the next logical target becomes the May range high near $98. This level previously represented a ceiling where sellers aggressively defended, but market conditions have changed since May. A break above $98 would set up a direct assault on the $100 psychological barrier.
Multiple technical analysts have identified similar targets. Daan Crypto Trades has highlighted approximately $98 as the next range high, noting that another squeeze could develop if SOL reaches the equal highs around that level. His broader analysis places the larger trading range between $67.60 and $97.60.
Altcoin Sherpa has offered comparably bullish projections, naming $95 as the first target and $120 as a possible longer-term objective if Bitcoin maintains its strength. However, both analysts emphasize that these represent conditional forecasts rather than guaranteed outcomes.
Risk Management: The Downside Scenario 📉
While the bullish case appears compelling, prudent traders must consider downside scenarios. The overbought RSI reading suggests that a pullback remains probable before another sustainable advance develops.
Immediate support sits in the $87–$90 range. A decline into this zone would represent a partial retest of the breakout and would likely attract buying interest from traders who missed the initial move. However, if sellers regain control below $90, the next significant support cluster appears near $88 and $86.
A more substantial pullback could test the $80–$81 area, where the 200-day moving average provides the most important long-term support. A break below this level would invalidate the bullish breakout narrative and potentially trigger further downside toward the $76–$77 base of the original breakout.
The key risk management principle: traders should establish clear invalidation levels before entering positions. For bullish traders, a close below $87 would signal that the breakout has failed. For bearish traders, a close above $95 would suggest that the uptrend has genuine staying power.
What Comes Next: The Verdict 🔮
Solana's breakout above the 200-day moving average represents a genuine technical shift that deserves serious consideration. The convergence of technical strength, institutional developments, and improved regulatory sentiment creates a compelling bullish case.
However, the overbought RSI reading and the concentrated liquidity between $93–$95 suggest that the path to $100 may not be straight. Consolidation or pullback appears likely in the near term, creating both risk and opportunity for different trader types.
The most probable scenario involves SOL consolidating in the $90–$95 range over the coming days or weeks before another push higher. This consolidation would allow the RSI to reset, reduce overbought conditions, and create a healthier technical foundation for the next leg higher.
For longer-term investors, the breakout above the 200-day moving average signals that the extended downtrend from SOL's 2025 peak may finally be ending. For active traders, the $93–$95 zone presents a critical inflection point that will determine whether the rally has genuine staying power or represents merely another temporary bounce.
The coming days will be crucial. Solana traders should monitor whether SOL can hold above $90 during any pullback, maintain the technical structure that's developed, and ultimately break through the $95–$98 resistance zone. Until those conditions materialize, the bullish case remains compelling but unconfirmed. 💪