Category:
SolanaSolana Price on Recovery Amid High On-Chain Activity
Solana's recent price action has captured the attention of investors and traders alike. As one of the most promising blockchain networks, Solana has shown resilience and growth despite the broader market volatility.
Solana's Impressive Recovery 📈
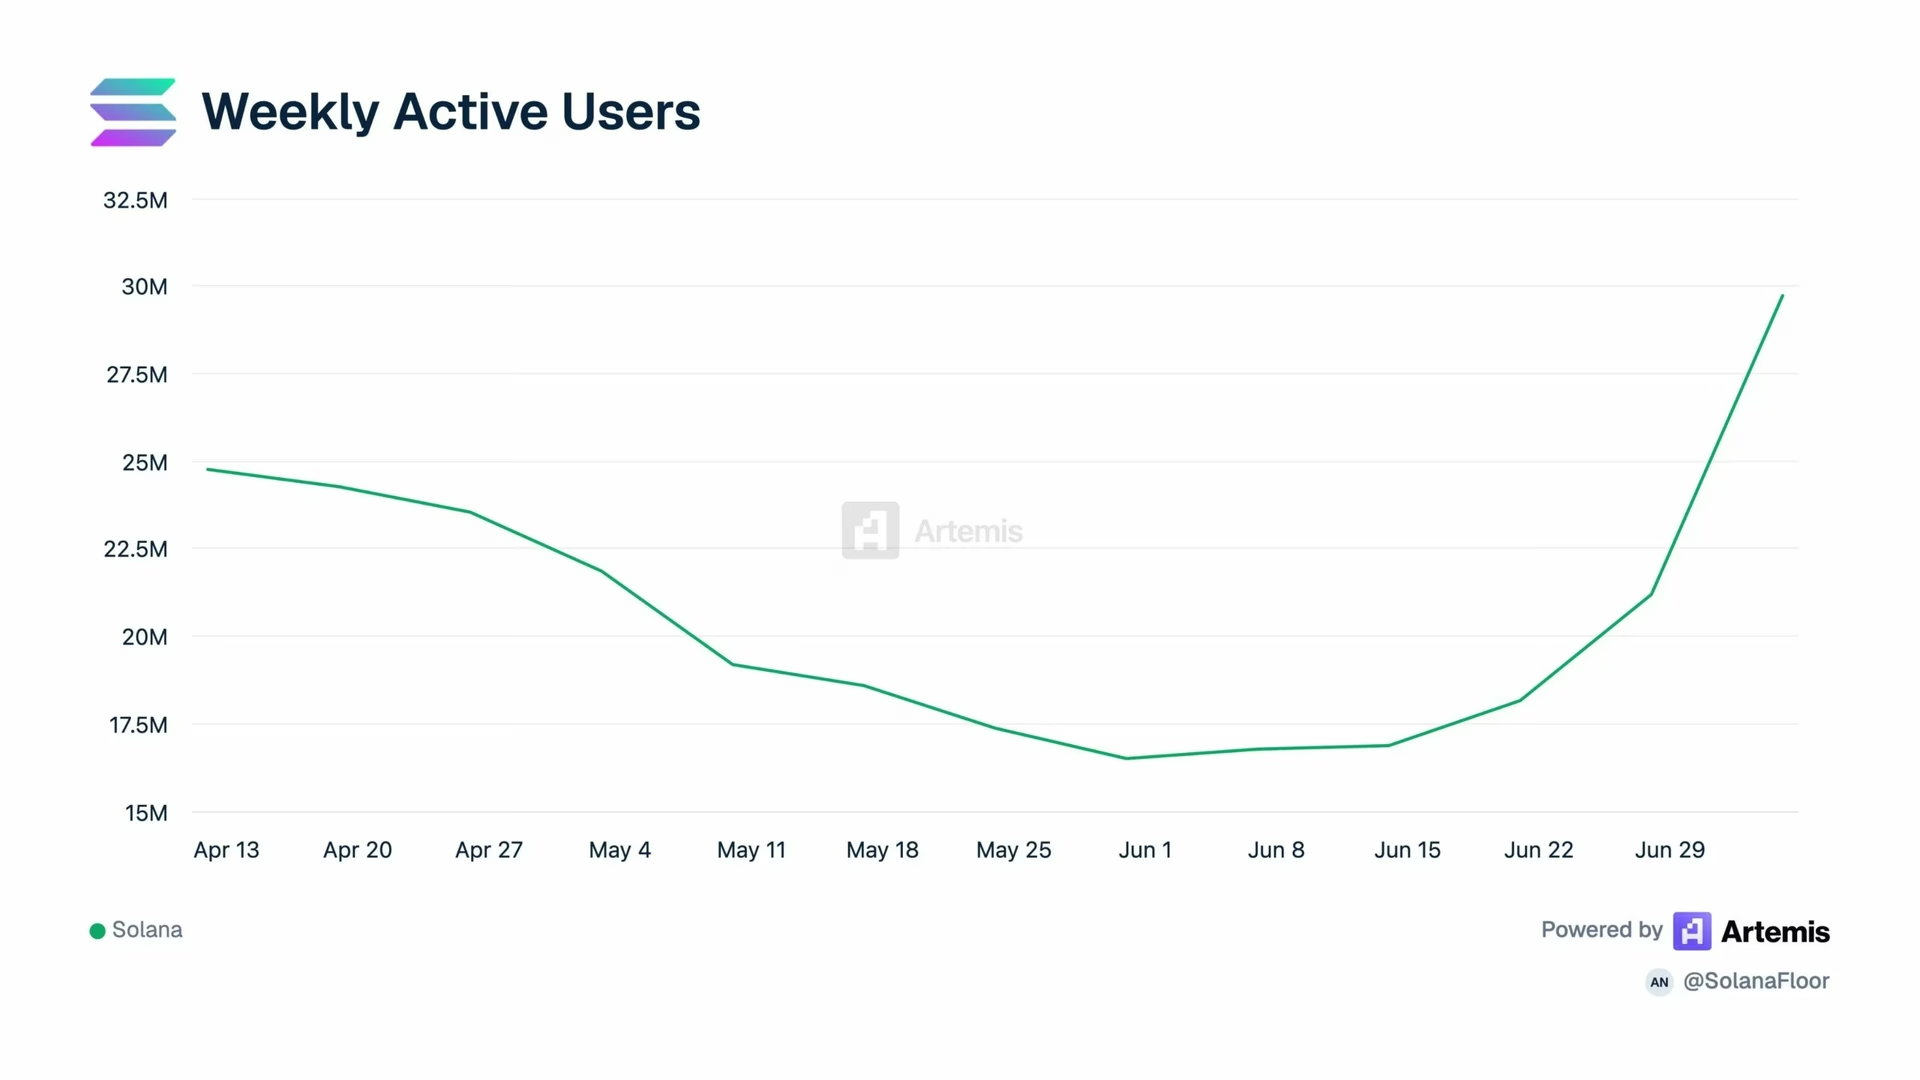
After experiencing a significant dip, Solana's price has managed to hold steady above key technical support levels. This stability has been accompanied by an increase in on-chain activity, suggesting that the network's fundamentals remain strong.
Solana has seen a remarkable rebound, climbing over 15% last week. However, it faced resistance near the $80 mark, a point where traders have been actively defending against further price increases. Despite this recovery, Solana is still about 73% below its all-time high of $294.33 reached in January 2025.
ETF Inflows Signal Investor Confidence 💸
One of the standout trends is the continued positive inflow into U.S.-listed spot Solana ETFs. While Bitcoin and Ethereum ETFs have seen net outflows, Solana ETFs attracted $5.75 million in net inflows recently. This divergence highlights investor confidence in Solana's potential, even as the broader digital asset market faces challenges.
Interestingly, other altcoins have also seen capital inflows. XRP ETFs recorded $17.19 million, and HYPE ETFs saw $4.32 million in net inflows, indicating a growing interest in altcoin investment products.
On-Chain Activity Reaches New Heights 🔥
Solana's on-chain activity has hit a new milestone, with non-vote transactions surpassing one billion for the first time. This surge in activity reflects the growing use of the Solana network by users, decentralized applications (DApps), and traders. The increase in non-vote transactions, which represent actual network usage, underscores the network's expanding ecosystem.
Technical Indicators Support Solana's Uptrend 📊
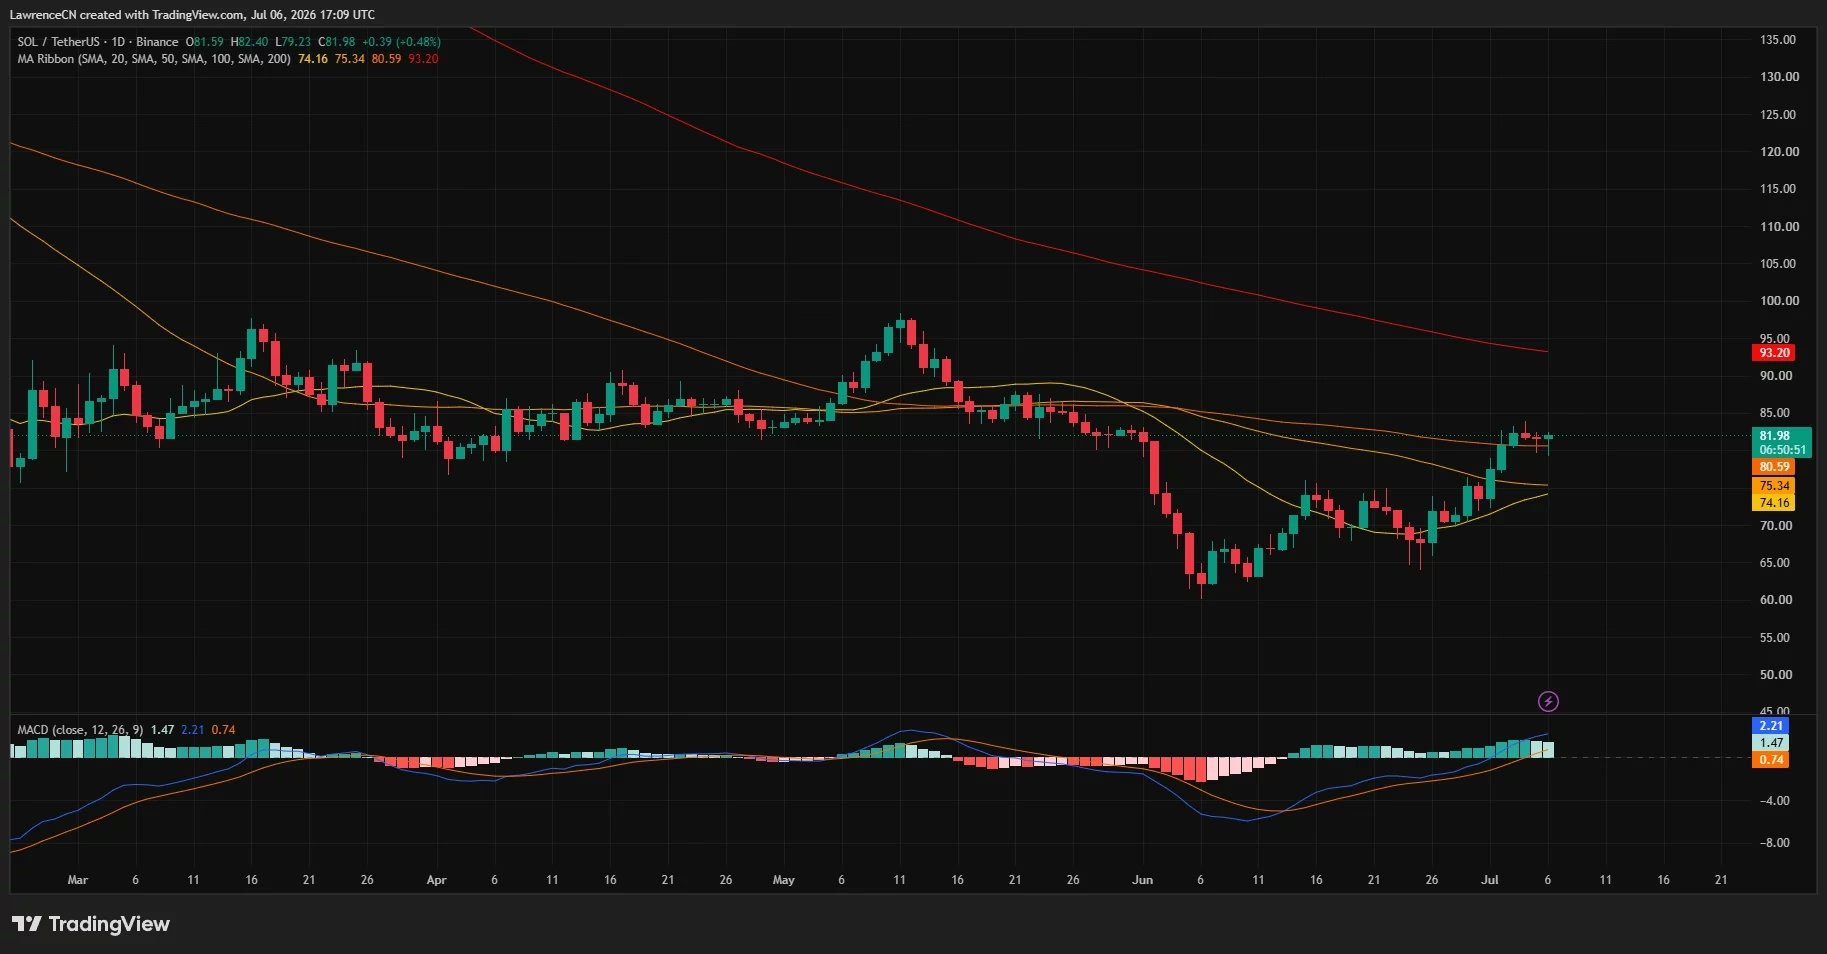
From a technical perspective, Solana's price action remains promising. The token is currently trading above its 20-day, 50-day, and 100-day moving averages. The MACD indicator also remains in bullish territory, suggesting sustained buying interest.
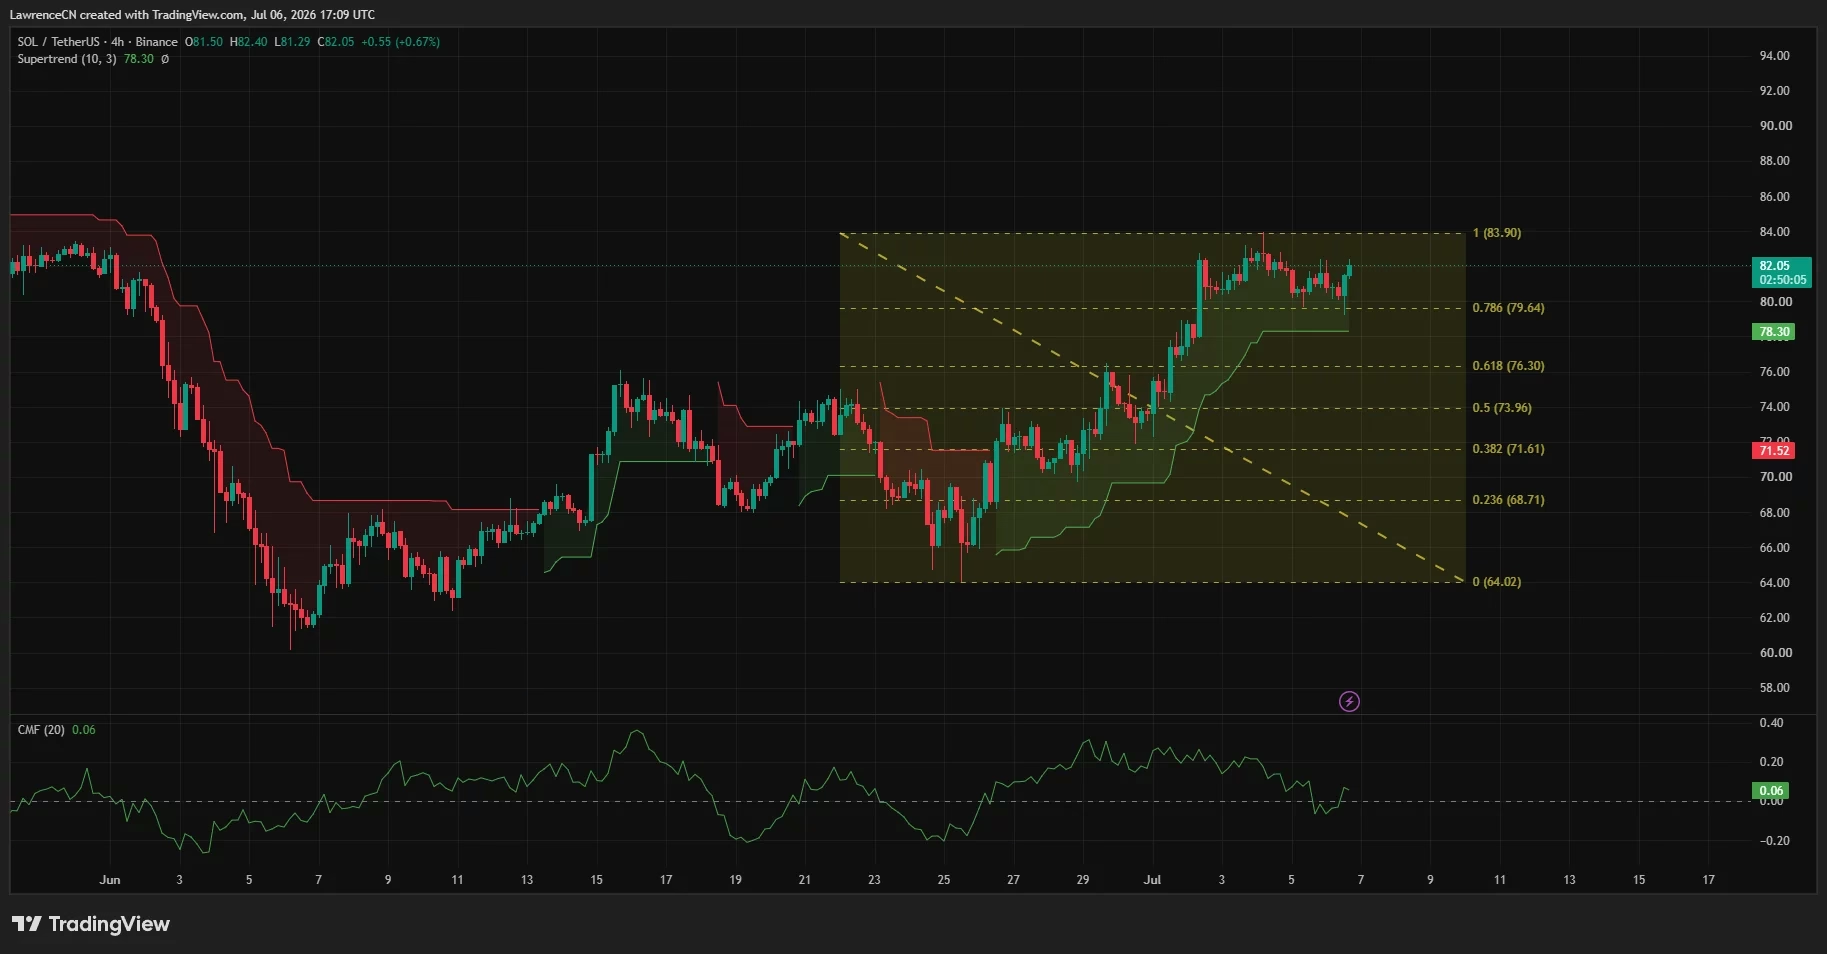
The Supertrend indicator has consistently held below the price near $78.30, while the Chaikin Money Flow indicator remains slightly above zero, indicating modest buying pressure. Immediate resistance is observed around the $84 level, with support zones near $78 and the Fibonacci level at $76 providing critical areas for bulls to defend.
Broader Market Context and Trends 🌐
Solana's recovery comes at a time when the overall cryptocurrency market is facing headwinds. Bitcoin's price fell by 1.65%, affecting the total cryptocurrency market capitalization, which dropped to $2.14 trillion. Yet, Solana's unique position in the market, with its high transaction speed and low costs, continues to attract developers and users.
The network's performance in the decentralized finance (DeFi) space is also noteworthy. Solana has led all Layer 1 and Layer 2 chains in decentralized application revenue and decentralized exchange trading volume, further cementing its place as a leading blockchain network.
Conclusion: A Promising Path Ahead 🚀
Solana's price recovery, coupled with strong on-chain activity and ETF inflows, paints a promising picture for the future. As the network continues to expand and attract users, its potential for growth remains high. For investors and developers, Solana represents a dynamic ecosystem with robust technological underpinnings.
In the coming months, market participants will be keenly watching Solana's ability to maintain its momentum and navigate the challenges posed by broader market conditions. With its strong fundamentals and active community, Solana is well-positioned to capitalize on emerging opportunities in the blockchain space.