Category:
SolanaSolana Price Risks $70 Drop as Buyers Retreat
Solana is facing critical technical headwinds as the cryptocurrency struggles to maintain momentum above key support levels. 📉 With trading activity cooling and capital flows turning negative, the blockchain token finds itself in a precarious position that could trigger a significant decline if buyer interest doesn't return soon.
Solana's Technical Breakdown Below $73 💔
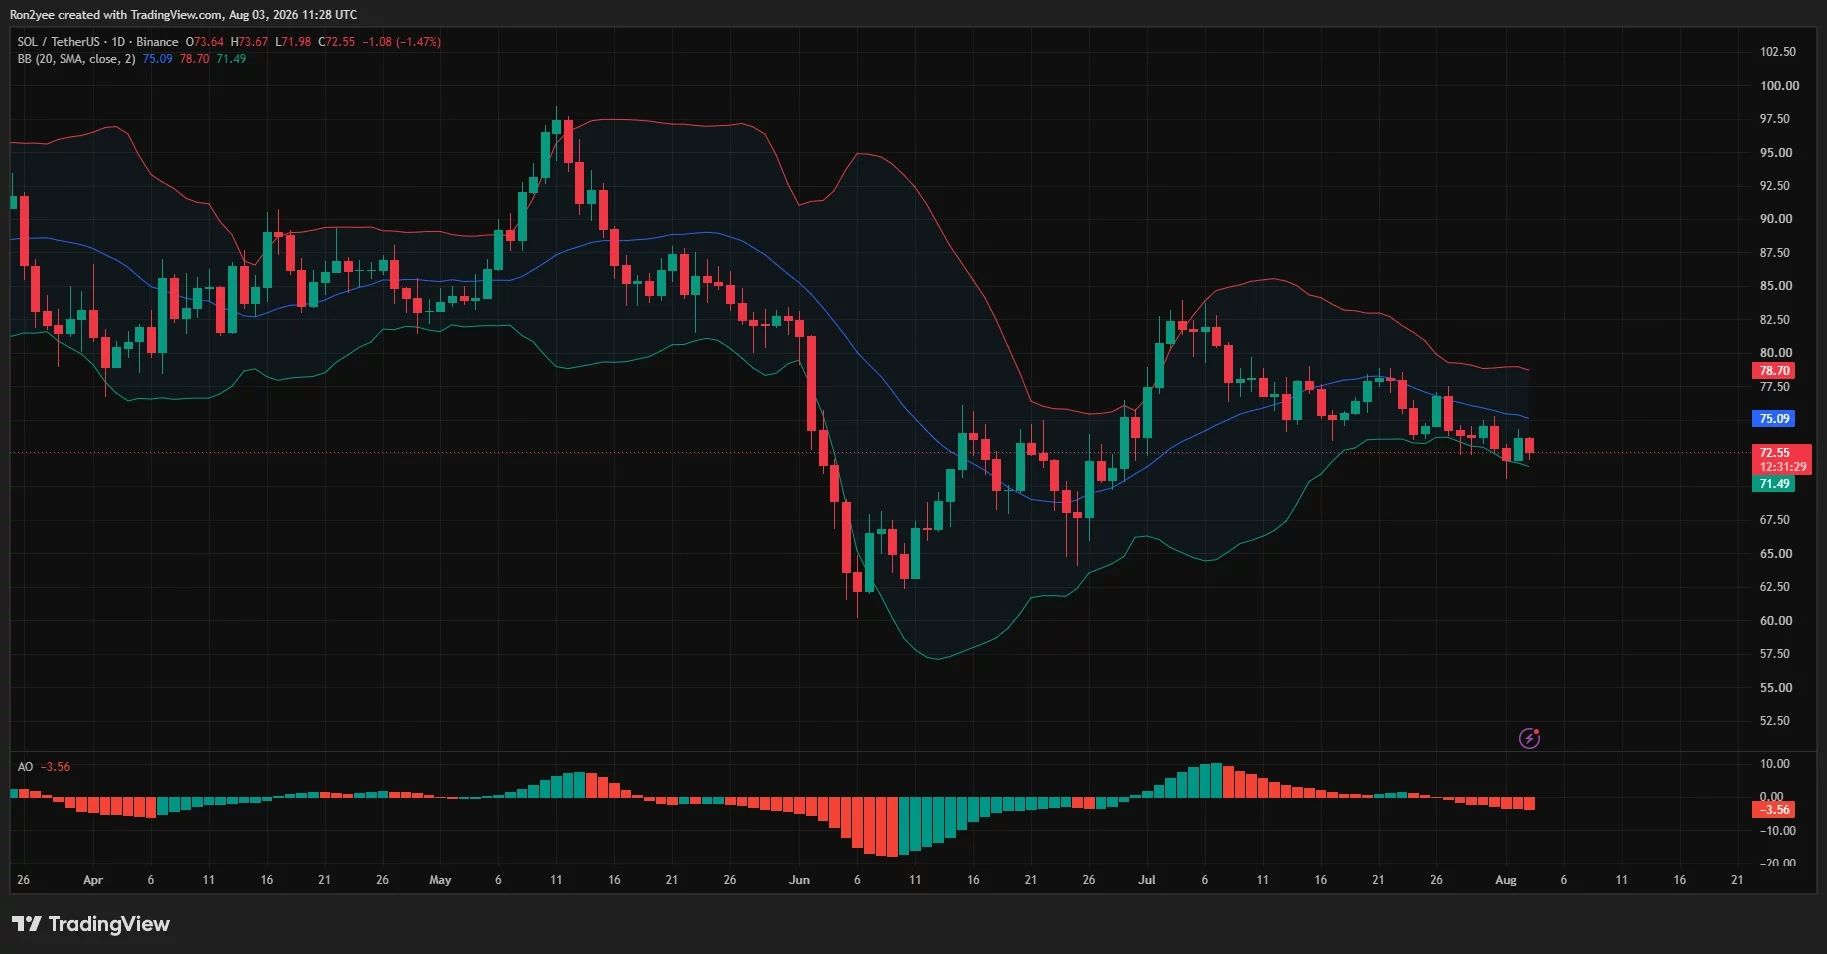
On August 3rd, Solana (SOL) slipped to $72.55, marking a 1.47% daily decline that extended a troubling trend from its July peak near $82.50. The token now trades dangerously close to its lower Bollinger Band, having briefly dipped below the $71.49 level before recovering modestly. This narrow recovery range tells an important story: while some buyers remain active around the $71.50–$72 zone, they lack the conviction needed to drive a sustained rebound.
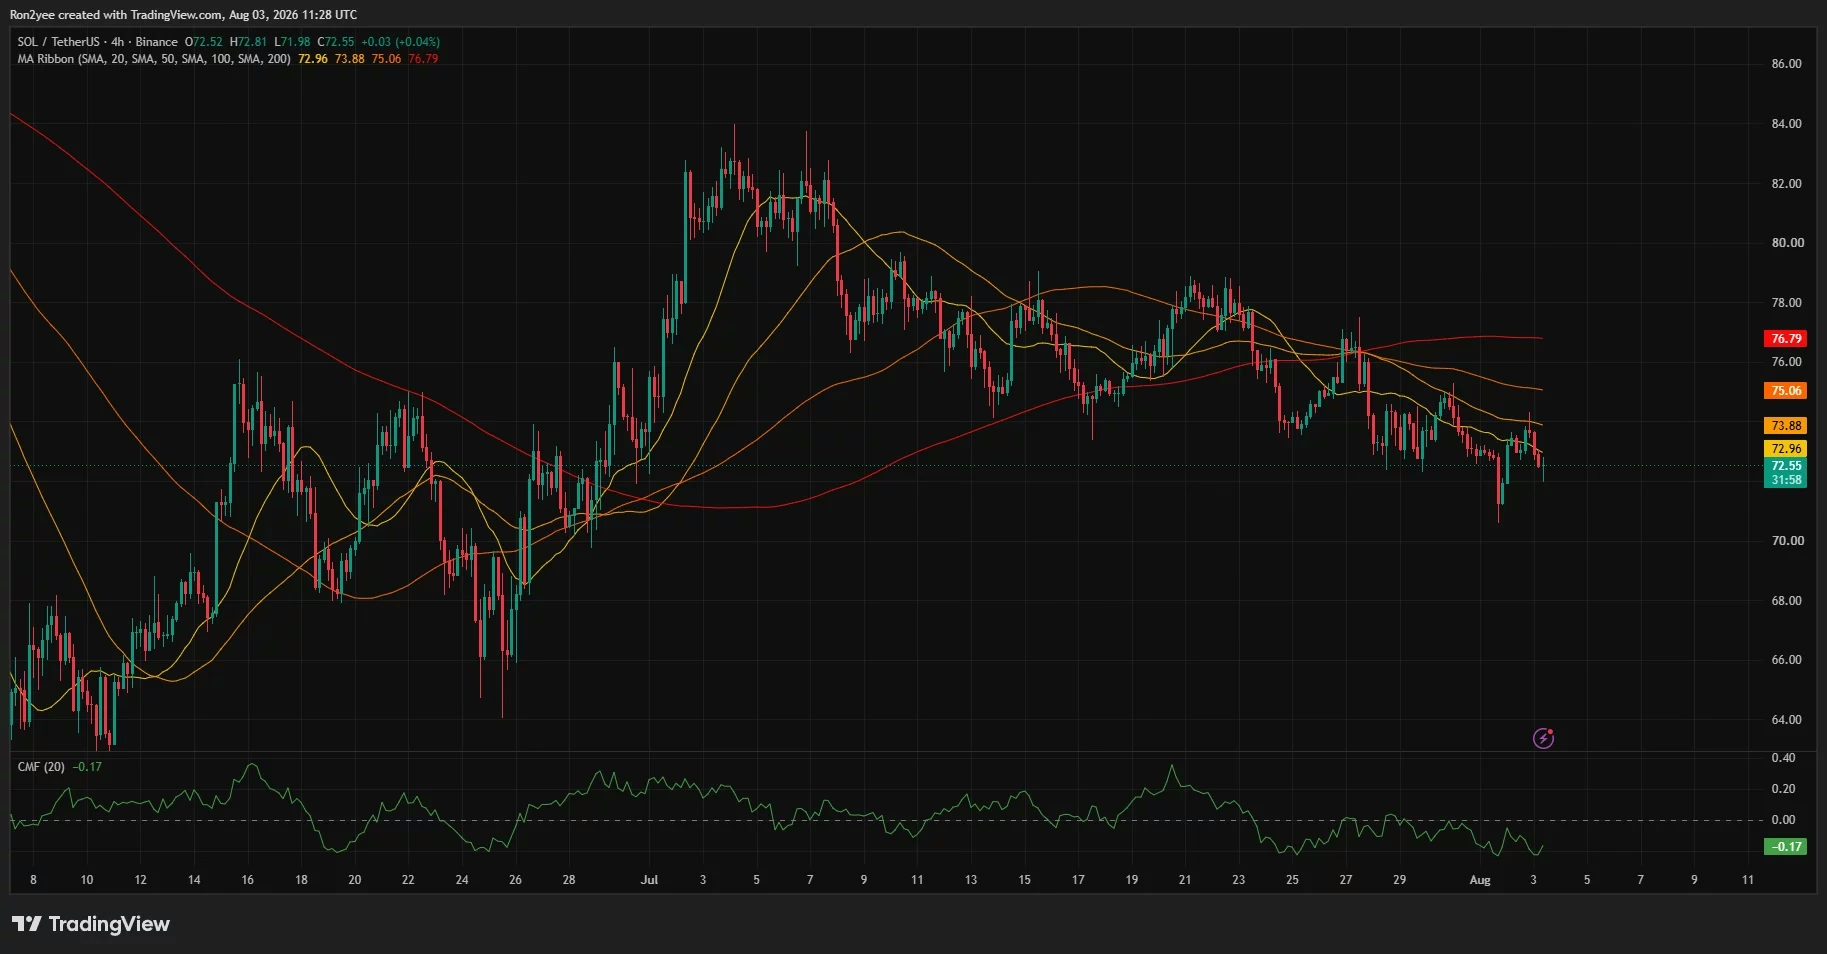
The technical picture deteriorates when examining the broader moving average structure. Solana trades below all four major moving averages on the 4-hour timeframe, with the 200-period SMA sitting at $76.79—a formidable resistance level that would need to be reclaimed to signal a genuine trend reversal. The daily Bollinger Band midpoint at $75.09, which previously supported price action, has now transformed into a resistance barrier—a classic sign of shifting market sentiment.
Capital Outflows Signal Weakness in Spot Demand 💸
Perhaps the most concerning indicator lies in the Chaikin Money Flow (CMF), which has deteriorated to -0.17. This metric reveals a fundamental problem: more capital is flowing out of Solana than flowing in, even as price attempts to stabilize. The negative CMF reading indicates that selling pressure substantially outweighs buying demand—a condition that typically precedes further downside movement.
This weakness becomes especially significant when considering that Solana's attempted recovery on August 2nd failed to attract corresponding spot market participation. Analysts have highlighted this divergence as a critical warning sign. When price rebounds but volume and capital inflows don't follow, it suggests the recovery lacks organic support and remains vulnerable to reversal.
The implications are profound: without genuine buying pressure from spot market participants, any rebound becomes dependent on leveraged derivatives positions. These synthetic rallies are inherently fragile, as they can evaporate quickly when traders unwind positions, leaving the token exposed to cascading selling.
Ecosystem Activity Cooling Creates Headwind 🌡️
Beyond technical factors, the Solana ecosystem itself shows signs of cooling momentum. Activity in speculative token trading on decentralized exchanges has moderated from previous highs, reducing the natural demand for SOL tokens needed to pay network fees and execute transactions. When on-chain activity weakens, it removes a fundamental use case that typically supports the token's value.
Fee generation metrics have similarly declined, suggesting reduced network utilization. This represents a concerning divergence from the narrative that drove SOL's earlier rally—the idea that network growth and adoption would continuously support token appreciation. As that tailwind fades, the token must rely more heavily on speculative positioning and macro risk appetite.
The Path Lower: $70 and Beyond 📍
If support at $72 fails to hold, Solana faces a cascading series of technical breaks that could accelerate the decline. The immediate downside target sits at $71.50, where another cluster of liquidation liquidity appears. A daily close below the lower Bollinger Band at $71.49 would likely trigger the next leg down, bringing the $70 psychological level into focus.
Should $70 break definitively, the next significant support zone emerges near $67.50, representing the June support region. This would constitute a roughly 8% decline from current levels—substantial but entirely plausible given the negative technical setup and weakening capital flows.
The bearish moving-average structure—where each shorter-term average sits below longer-term measures—confirms that this decline is established across multiple trading timeframes, not just a short-term aberration. This ordering suggests the downtrend has legs and may continue until structural conditions improve.
Liquidation Heatmap Reveals Competing Pressures ⚡
Analyzing the three-day liquidation heatmap reveals an interesting dynamic: while the largest concentration of leveraged long positions sits above the current price around $73.50–$74.50, significant liquidation clusters also exist below the market near $71.50 and $70. This creates competing pressure zones that could amplify volatility in either direction.
If Solana rebounds into the upside liquidation clusters around $73.50–$74.50, forced short-covering could accelerate the move higher, potentially testing $76 and beyond. However, the weak spot demand and negative CMF reading suggest this scenario requires external catalysts—a shift in macro conditions or positive news—to materialize.
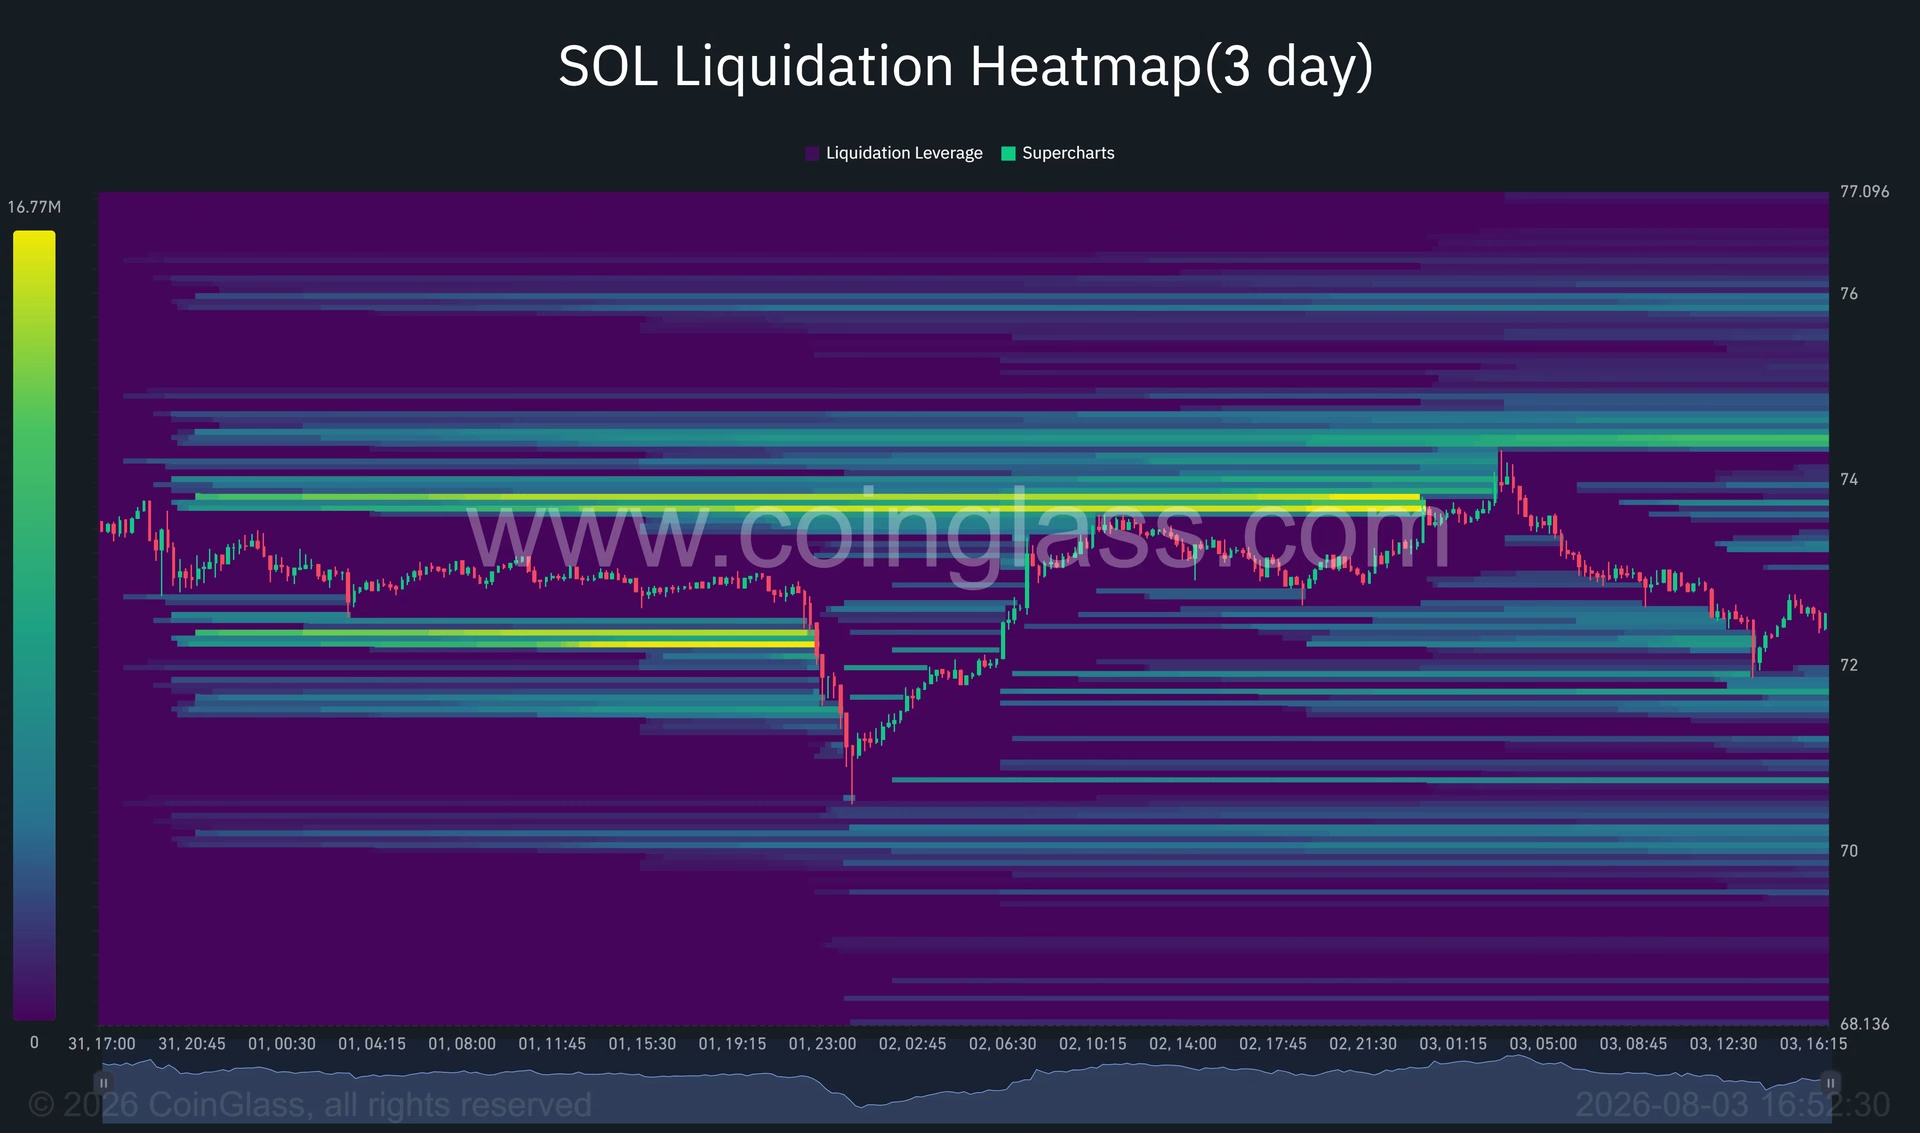
Conversely, if support fails at $72, the downside liquidation clusters near $71.50 and $70 could attract price, potentially triggering a more severe washout as leveraged longs are forced to exit positions.
Potential Catalyst: Fee Burn Governance Vote 🗳️
Solana has one potential catalyst that could shift sentiment: upcoming governance proposals addressing fee burn and token disinflation. These measures would represent meaningful changes to SOL's supply dynamics:
- Doubled annual disinflation from current levels to approximately 30%
- Removal of roughly $1.36 billion in projected token issuance over six years
- Increased daily token burns from approximately 650 SOL to 9,000 SOL
If approved, these changes would create a more deflationary token model that could support long-term value appreciation. However, it's crucial to note these remain proposals awaiting governance approval—not confirmed changes. The voting process could take weeks or months, meaning this catalyst may not provide immediate support to current price action.
Macro Backdrop and Federal Reserve Expectations 📊
Solana's near-term trajectory remains significantly influenced by broader macroeconomic conditions. High-beta assets like SOL face particular pressure when US Treasury yields rise, as investors rotate toward lower-risk dollar-denominated assets. With elevated Treasury yields currently in effect, the opportunity cost of holding volatile cryptocurrencies increases.
Any shift in Federal Reserve expectations—whether toward continued rate increases or eventual cuts—could meaningfully impact risk appetite. A dovish surprise from Fed officials could trigger a relief rally across high-beta tokens, while hawkish commentary could accelerate selling pressure. For Solana specifically, macro conditions may ultimately prove more influential than technical factors in determining whether the $70 level is tested.
What Traders Should Monitor 🎯
The short-term outlook remains decidedly bearish below the $75.06 level (the 100-period 4-hour SMA). Key levels to watch include:
Upside Resistance:
- $73.88 (50-period SMA and liquidation zone)
- $75.06 (100-period SMA)
- $76.79 (200-period SMA—critical barrier)
Downside Support:
- $72.00 (current support zone)
- $71.50 (lower Bollinger Band and liquidation cluster)
- $70.00 (psychological level with liquidation liquidity)
- $67.50 (June support region)
A confirmed recovery above $75.06 would improve the technical setup and potentially expose $76.79, suggesting a reversal of current bearish pressure. Conversely, a break below $71.49 with conviction would substantially increase the probability of testing $70 and the June support region.
The Bottom Line 🎬
Solana faces a critical juncture as technical deterioration combines with weakening spot demand and cooling ecosystem activity. While the liquidation heatmap suggests potential for short-term bounces, the negative Chaikin Money Flow reading and bearish moving-average structure indicate any recovery must be confirmed by genuine buying pressure from spot market participants.
The $70 level represents a meaningful support zone, but reaching it is entirely plausible if current conditions persist. Traders should remain vigilant for either a macro catalyst that restores risk appetite or a technical catalyst like the governance vote on fee burns. Until then, the path of least resistance points lower, with patience and defensive positioning likely the prudent approach. 🛡️
The coming days will prove critical in determining whether Solana stabilizes above $72 or extends its decline toward the $70 target that bears have marked in their sights.