Category:
SolanaSolana Price Risks Pullback as MACD Turns Bearish
Understanding the Current Solana Market Dynamics 📊
Solana has captured significant attention in the cryptocurrency markets, with SOL trading near the $95 mark following an impressive 26% rally from its recent lows. This surge represents one of the most compelling price movements in the altcoin space this quarter, driven by a confluence of regulatory clarity, network governance developments, and growing institutional interest in tokenized assets. However, technical indicators are beginning to flash warning signals that traders and investors should carefully monitor.
The recent price action tells a fascinating story about market sentiment and the delicate balance between bullish momentum and bearish consolidation. Understanding these dynamics requires examining both the fundamental catalysts supporting the rally and the technical warning signs that suggest caution may be warranted.
The Rally That Defied Expectations 🚀
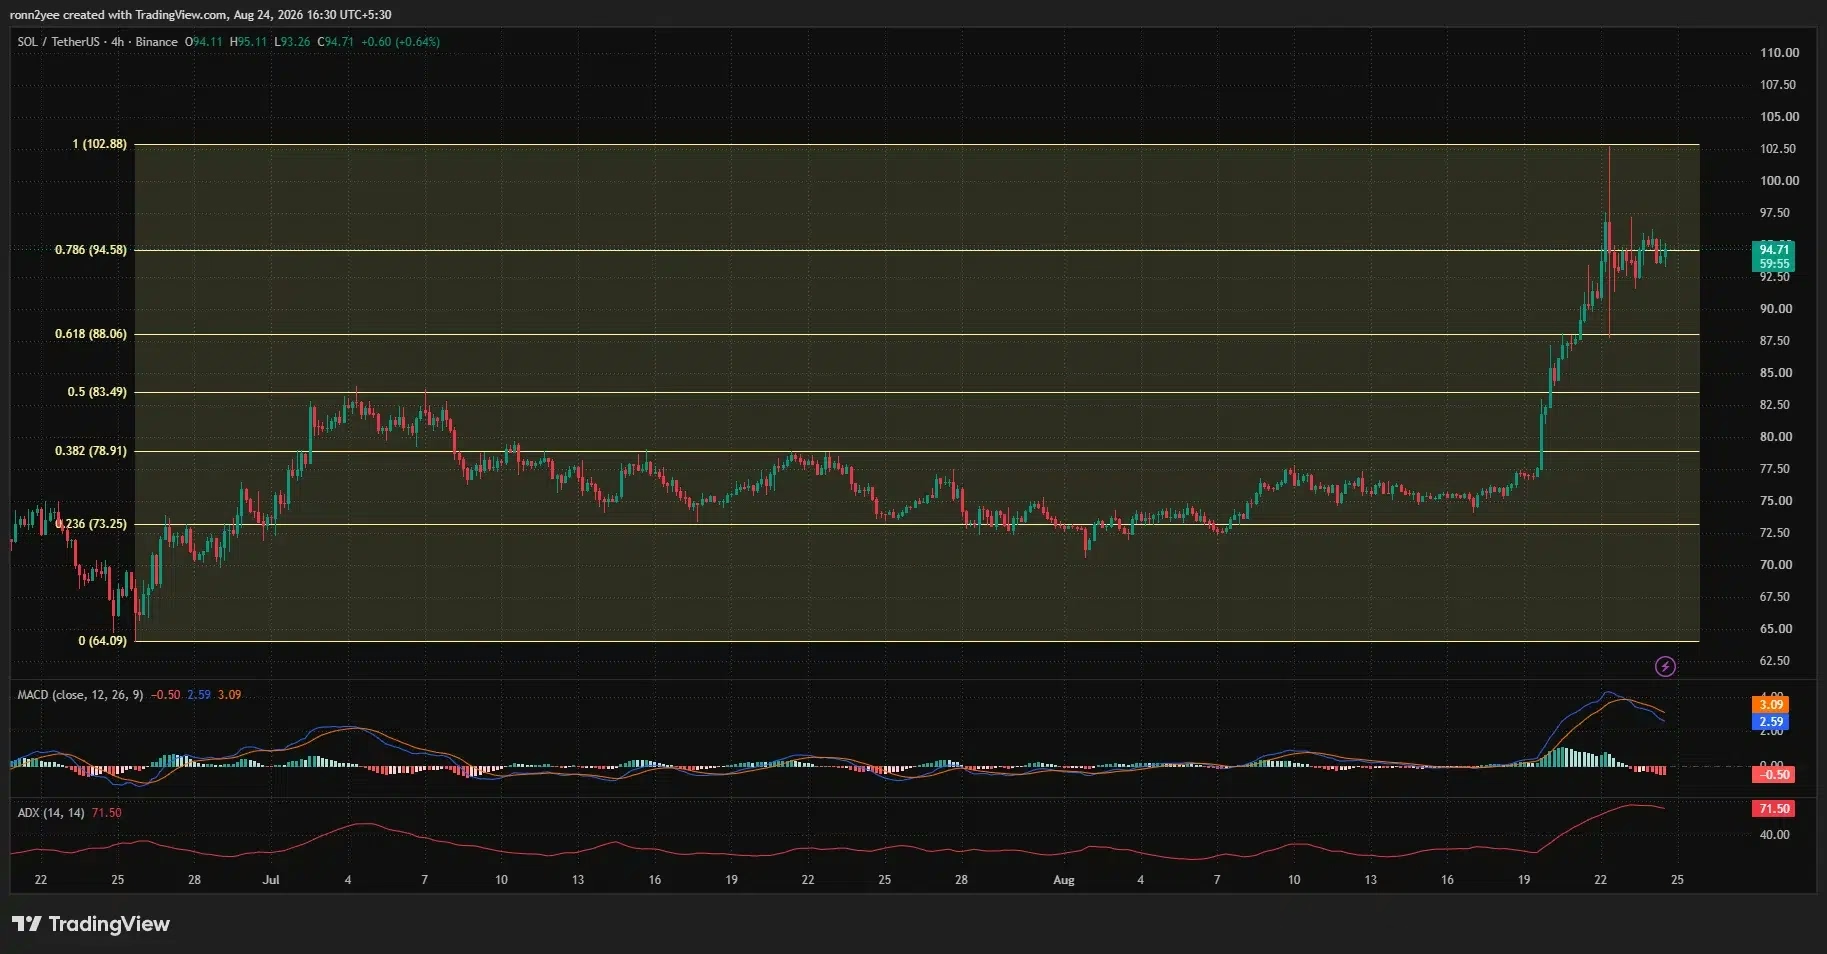
Solana's journey from approximately $75 to near $95 represents more than just a price movement—it reflects renewed confidence in the blockchain's ecosystem and regulatory framework. The breakout accelerated dramatically above the $78 resistance level on August 19, suggesting that buyers had been waiting for confirmation before committing fresh capital.
What makes this rally particularly noteworthy is that it occurred during a period of broader cryptocurrency recovery. The entire digital asset class benefited from positive macroeconomic signals, including Treasury debt management announcements and renewed political interest in cryptocurrency-friendly legislation like the CLARITY Act. These factors created an environment where quality blockchain networks like Solana could attract fresh investment flows.
The price extended through critical Fibonacci retracement levels, including the 50% retracement at $83.49 and the 61.8% level at $88.06. This methodical advance through key technical levels suggested that institutional buyers were participating in the move, not just retail traders chasing momentum.
Regulatory Tailwinds and Network Governance 🏛️
One of the most significant catalysts for Solana's recent performance came from the regulatory sector. The U.S. Securities and Exchange Commission's announcement of a proposed framework called Regulation Crypto Assets on August 18 provided much-needed clarity for blockchain projects and cryptocurrency companies.
This regulatory development is particularly important because it addresses one of the most pressing questions facing the industry: how existing securities laws apply to functional blockchain networks and token offerings. The SEC's framework offers crypto companies clearer pathways for raising capital under federal securities laws while establishing specific conditions for when crypto-related investment contracts might fall outside traditional securities requirements.
While this framework doesn't eliminate all regulatory risks for Solana specifically, it significantly reduced uncertainty in the market. The proposal period remains open through October 20, allowing stakeholders to provide feedback that could shape how digital assets are regulated going forward.
Simultaneously, Solana's community activated its governance mechanisms with the opening of three formal proposals through epoch 1023, which runs through approximately August 27. These proposals address critical network parameters:
- SGP-0001: Introduces the Solana Constitution as a unified governance framework
- SGP-0002: Proposes doubling the annual disinflation rate from 15% to 30%, potentially removing approximately 18.9 million SOL from scheduled emissions over a six-year period
- SGP-0003: Presents a new resource and inclusion fee structure that could dramatically increase daily SOL burning from roughly 648 tokens to approximately 9,000 tokens
These governance developments matter because they demonstrate active community participation and potential deflationary mechanisms that could support long-term price appreciation.
The Tokenized Asset Breakthrough 💎
Perhaps one of the most underappreciated catalysts for Solana's rally is the explosive growth of tokenized real-world assets (RWAs) on the network. According to recent data, the total value of tokenized assets on Solana has crossed the $4 billion threshold for the first time in the network's history.
This milestone represents a fundamental shift in how blockchain technology is being utilized. Tokenized real-world assets include everything from real estate and commodities to securities and intellectual property rights. The fact that Solana has become a preferred platform for these applications suggests that institutional players and sophisticated investors are building infrastructure on the network.
The number of RWA holders has also grown to approximately 348,489, indicating that this isn't merely a small cohort of whales but rather a diversified base of participants. This breadth of adoption is crucial for the long-term viability of the ecosystem and supports the narrative that Solana is becoming a serious contender for enterprise-grade blockchain applications.
Technical Warning Signs: The MACD Bearish Crossover ⚠️
Despite the positive fundamental backdrop, technical analysis reveals concerning signals that suggest the rally may be losing momentum. The most significant warning comes from the Moving Average Convergence Divergence (MACD) indicator, which has turned bearish on the 4-hour timeframe.
The MACD line has fallen below its signal line, with the MACD line currently at 2.59 compared to the signal line at 3.09. The histogram has declined to minus 0.50, indicating a clear bearish crossover. This technical pattern typically suggests that momentum is waning and that consolidation or a pullback may be imminent.
It's important to note that a MACD bearish crossover doesn't automatically predict a crash or substantial decline. Rather, it signals that the rate of price acceleration has slowed and that buyers may be taking profits after the impressive rally. In many cases, these signals precede periods of consolidation where price moves sideways before establishing a new direction.
The 4-hour Average Directional Index (ADX) registered 71.50, which is significantly above the 25 threshold that typically indicates a strong trend. However, elevated ADX readings combined with a bearish MACD crossover suggest that while the trend remains strong, its momentum component is weakening—a classic setup for consolidation or pullback scenarios.
Resistance Levels and Liquidation Dynamics 📍
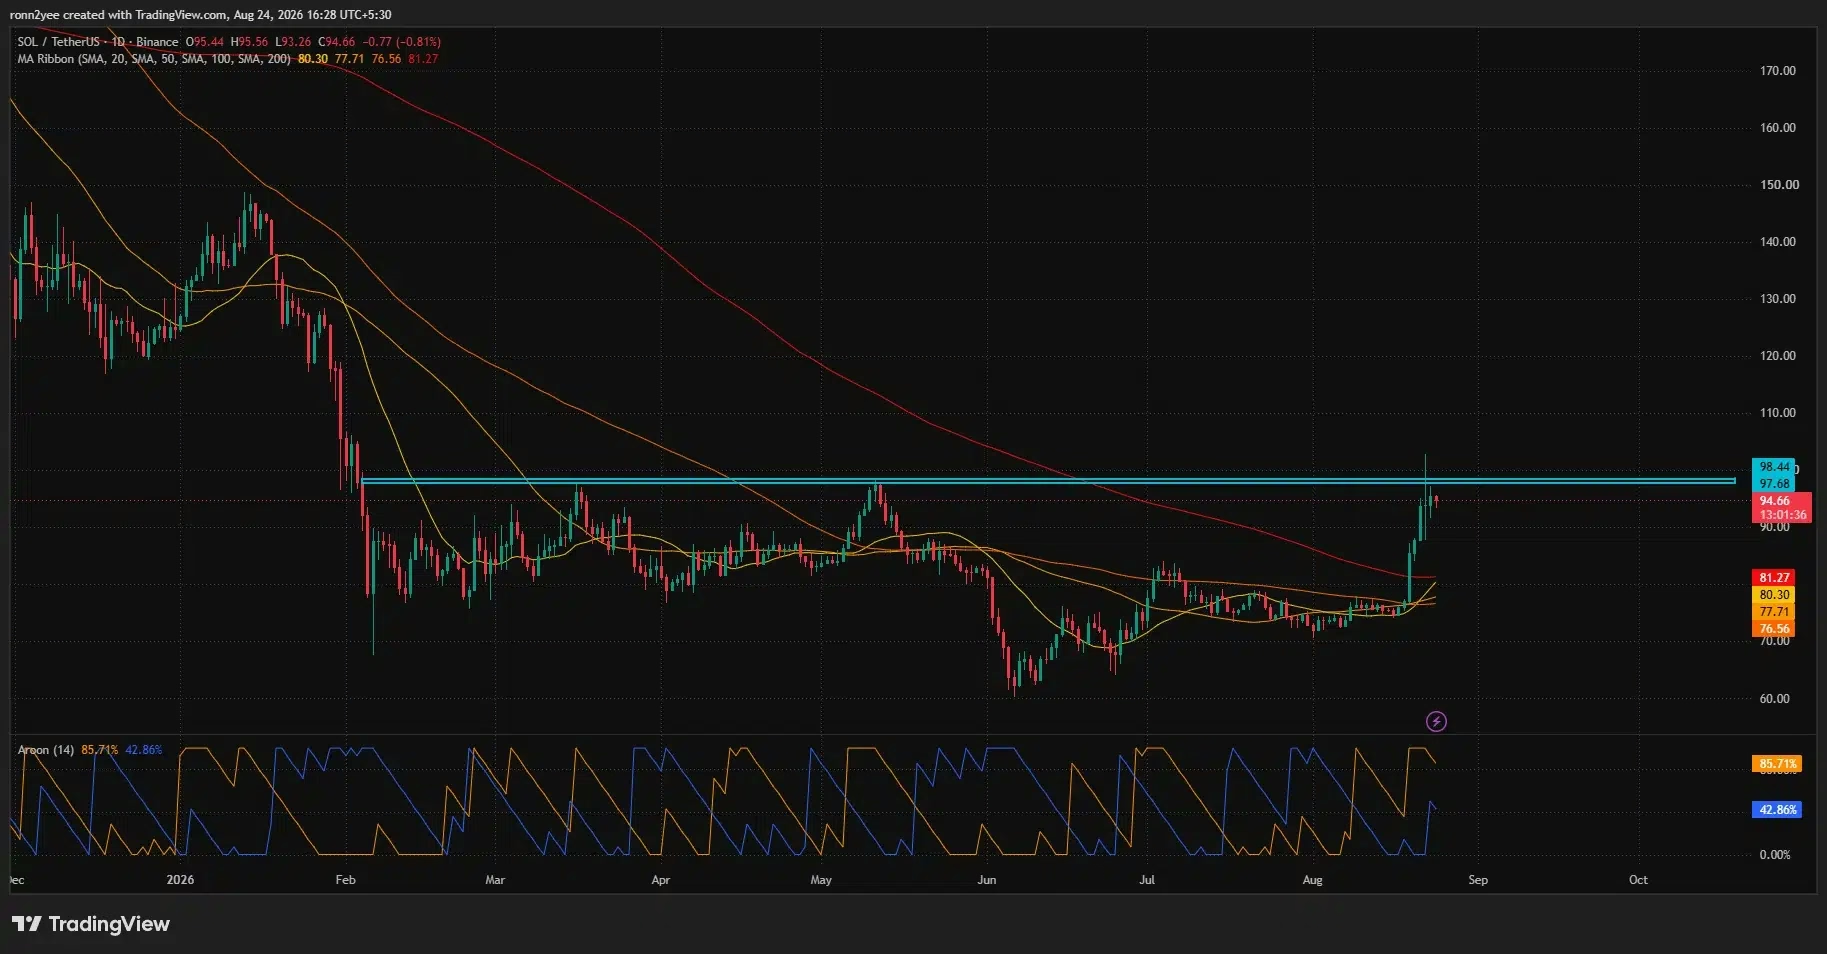
Solana faces critical resistance between $97.68 and $98.44, levels that the price briefly tested during the latest rally before retreating. A confirmed breakout above this zone would bring the $100 psychological level back into focus, followed by the August 22 wick at $102.88. Clearing that high would remove the most visible nearby supply zone and potentially open the path toward $105 and beyond.
However, the liquidation landscape tells an important story about where the real battle is occurring. CoinGlass's 24-hour liquidation heatmap reveals the largest concentration of leveraged positions clustered around $96.20–$96.40.
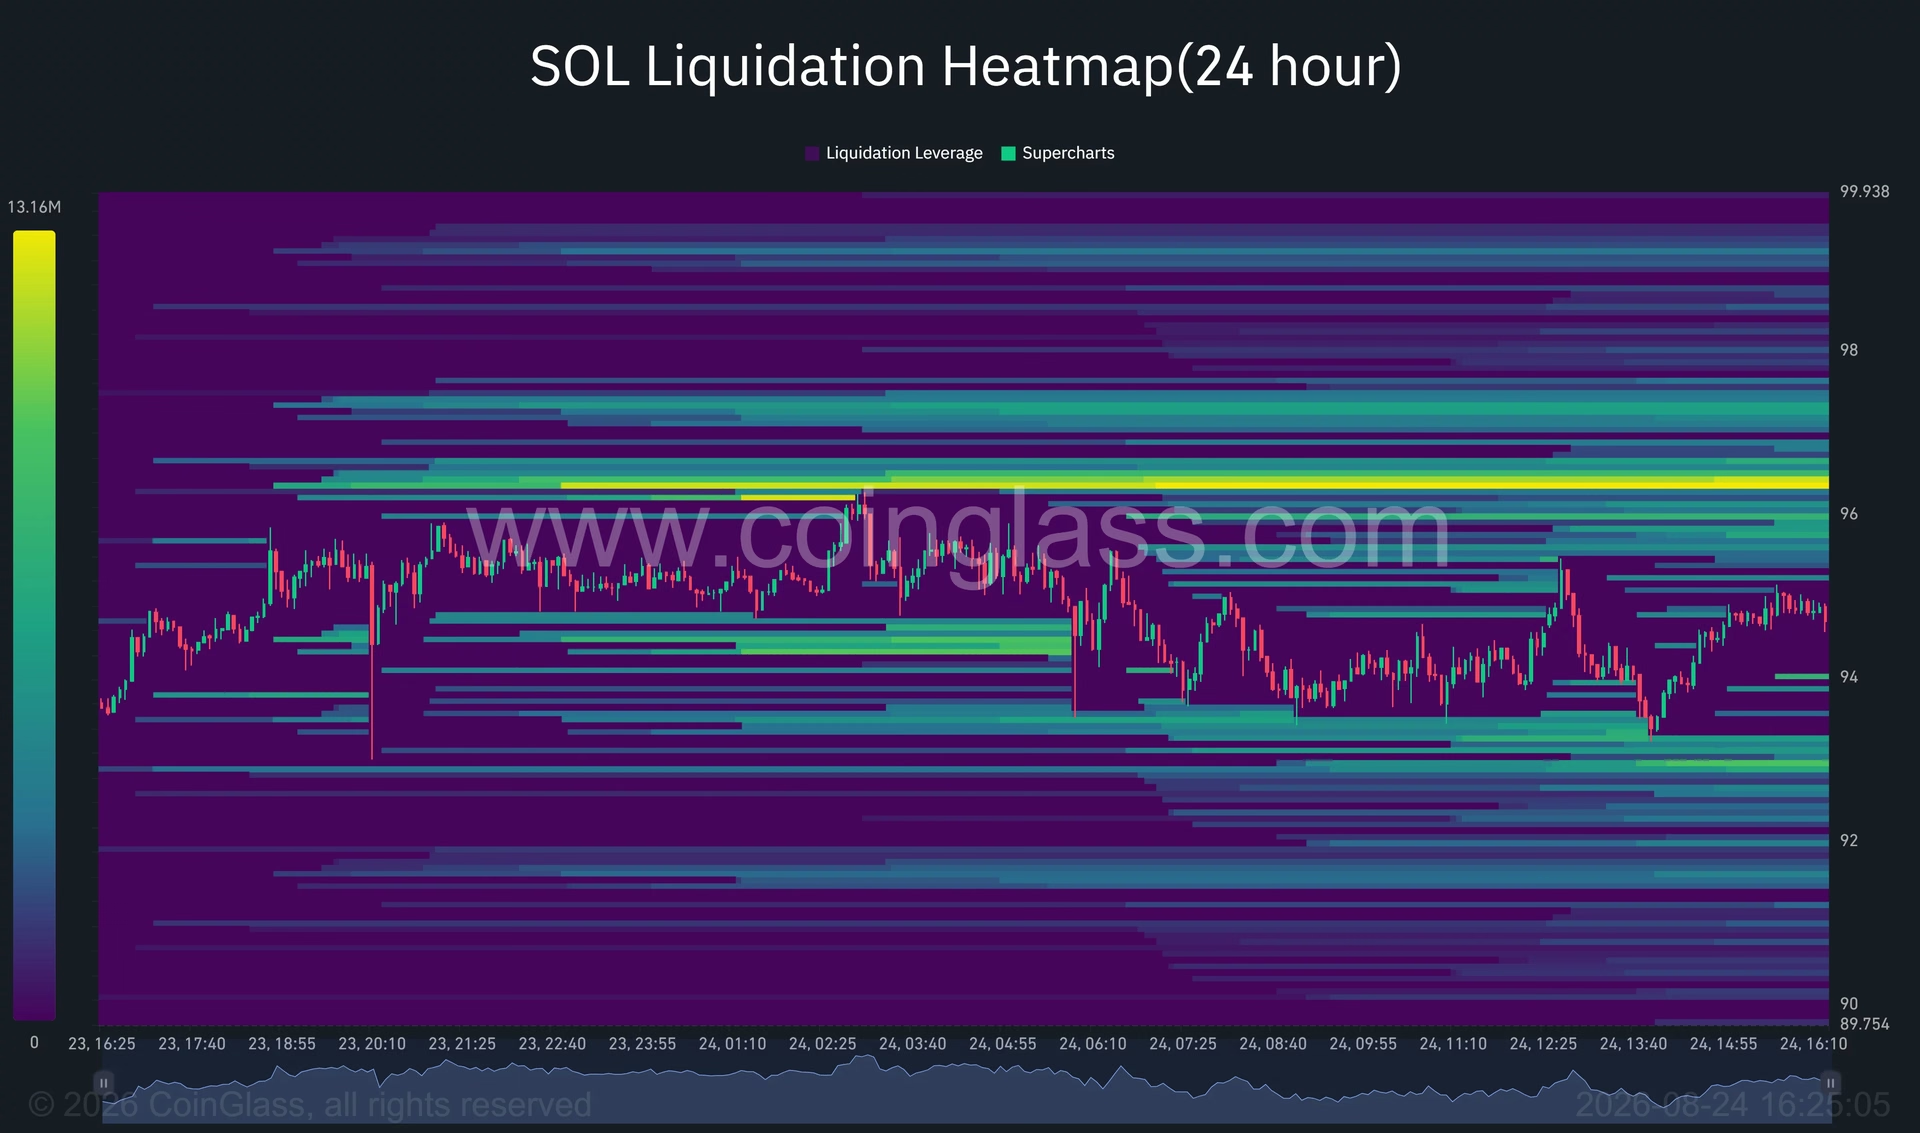
This liquidation concentration is significant because price often gravitates toward areas containing dense leveraged positions. If SOL moves above $96, it could trigger cascading short liquidations that force position closures, potentially providing enough buying pressure to retest the $97.68–$98.44 resistance zone. Further liquidation liquidity exists between $97 and $99.50.
On the downside, support sits near $94.58, which corresponds to a key Fibonacci level. A close below this level would expose the $92.50–$93.25 area, where another concentration of liquidation orders exists. A rejection below $94 could produce a faster move toward these lower liquidity pools before spot buyers potentially re-enter the market.
The deeper $83.49 level would become important if sellers reverse the entire breakout structure, while a move below $78.91 would materially weaken the current bullish setup and suggest that the rally was merely a temporary relief bounce.
What's Next for Solana Traders? 🎯
The current setup presents a classic technical dilemma for traders and investors. The fundamental catalysts remain intact—regulatory clarity, governance participation, and RWA growth all support a constructive long-term outlook. However, the short-term technical picture suggests that consolidation or pullback is likely before the next significant leg higher.
Crypto analysts are watching the $98–$102 area as the main resistance zone. A decisive break above $98.44 with volume confirmation would signal that buyers remain committed to extending the rally. Conversely, a rejection in this zone combined with the bearish MACD crossover could trigger a pullback toward the $92–$94 support area.
The Aroon indicator provides some bullish context, with Aroon Up at 85.71% compared to Aroon Down at 42.86%, showing that recent highs carry more weight than recent lows. This suggests that the overall trend remains tilted toward buyers, even as short-term momentum weakens.
Key Takeaways for Market Participants 💡
Solana's current market position reflects the tension between strong fundamental developments and technical warning signals. The 26% rally from $75 to $95 demonstrates genuine interest in the ecosystem, supported by regulatory progress, governance activation, and the remarkable growth of tokenized assets on the network.
However, the MACD bearish crossover and price rejection at the $97.68–$98.44 resistance zone suggest that traders should exercise caution before chasing the rally further. The liquidation concentration around $96.30 creates a potential flashpoint where price action could accelerate in either direction.
For long-term investors, the fundamental story remains compelling. For short-term traders, patience may be rewarded as consolidation likely precedes the next significant move. The next few trading sessions will be crucial in determining whether Solana can break above resistance or if a pullback toward $92–$94 materializes first. Monitoring volume, the MACD histogram for signs of reversal, and price action around the liquidation clusters will be essential for making informed decisions in this dynamic market environment.
The broader cryptocurrency ecosystem will be watching closely to see whether Solana can maintain its position as a leading smart contract platform or if the technical weakness signals a broader market rotation.