Category:
SolanaSolana Price Stalls Below $75: Spot Selling Pressure Intensifies
Solana's Consolidation Struggle: Why SOL Can't Break Through $75 🔒
Solana has found itself trapped in a frustrating holding pattern, with the cryptocurrency struggling to maintain momentum above the critical $75 level. As of early August 2026, SOL was trading around $73.84, caught between competing forces of institutional interest and persistent spot selling pressure. This technical gridlock has left traders questioning whether the current consolidation represents an accumulation opportunity or a precursor to further decline.
The inability to decisively move past $75 marks a significant psychological barrier for the Solana network's native token. Despite recent positive developments in the blockchain ecosystem, including institutional adoption initiatives, SOL remains constrained by technical resistance and waning retail demand. Understanding the mechanics behind this price stall requires examining both the technical setup and the underlying market sentiment.
Technical Resistance: Moving Averages Create a Ceiling 📊
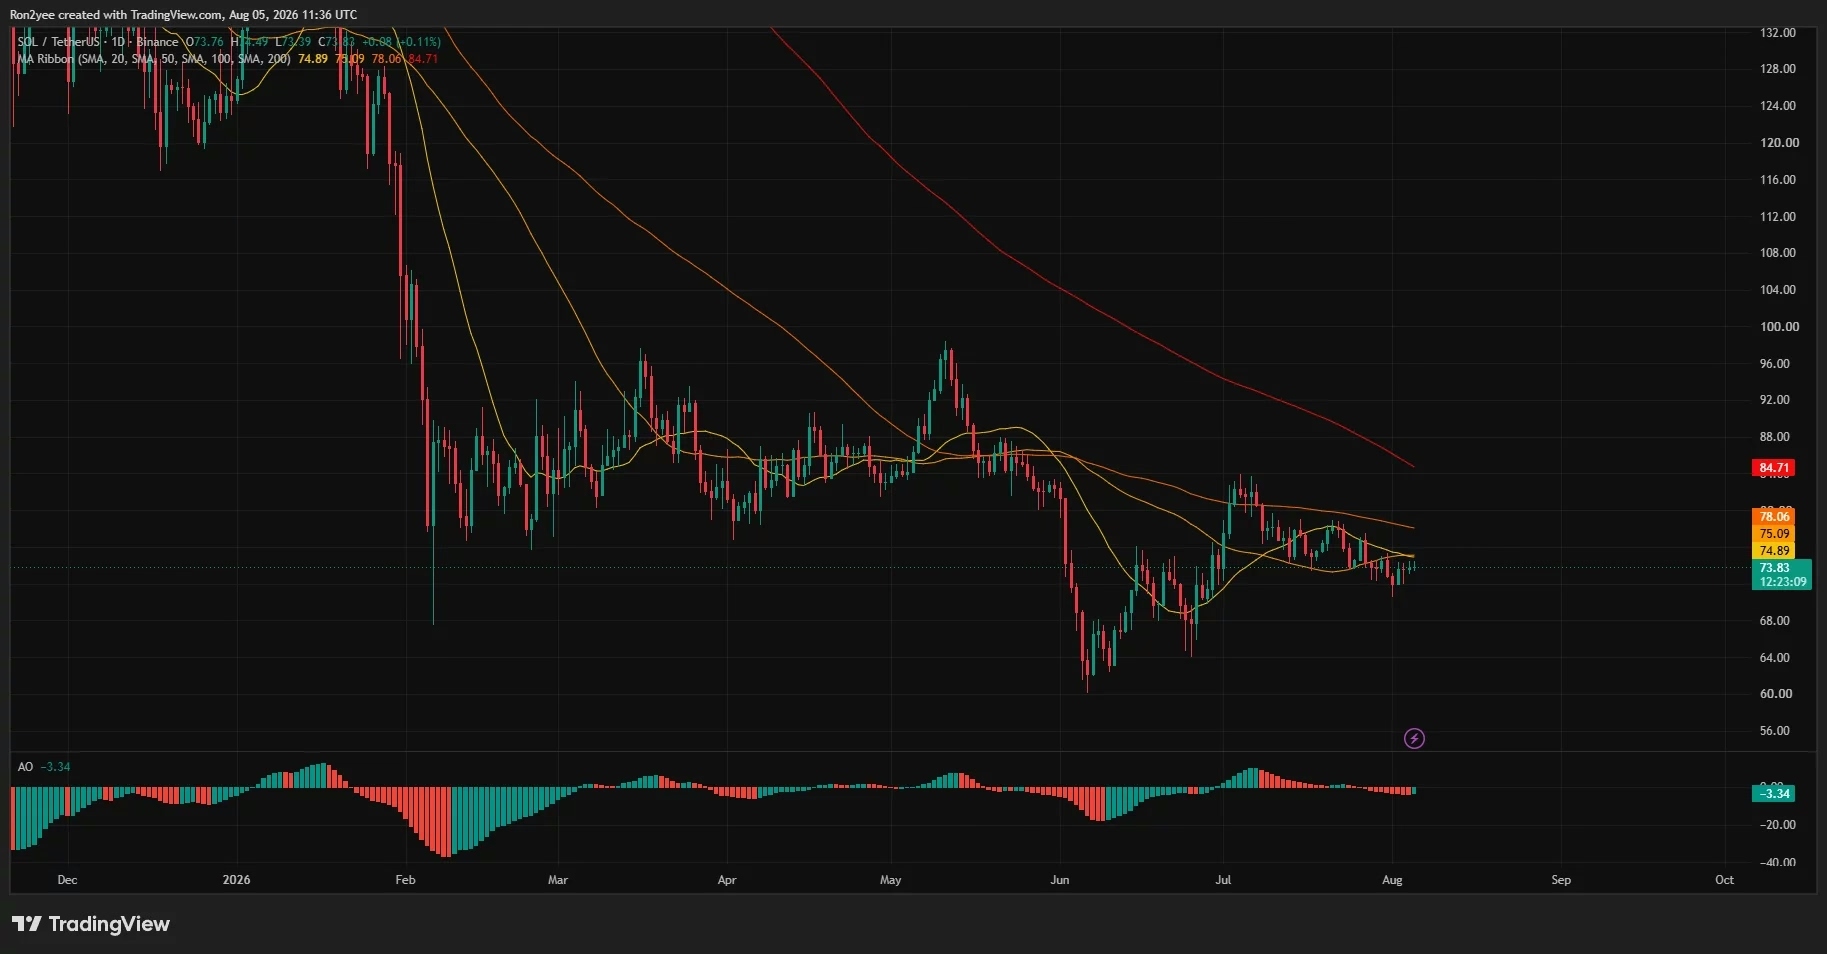
The daily chart reveals a bearish technical structure that continues to weigh on SOL's upside potential. The token is currently trading below all four major moving averages—a configuration that typically favors sellers over buyers. The 20-day simple moving average sits at $74.89, while the 50-day average rests at $75.09, creating a tightly grouped resistance zone that has proven remarkably difficult to penetrate.
This clustering of moving averages between $74.89 and $75.09 acts as an invisible ceiling, with each rejection reinforcing bearish sentiment. When a cryptocurrency trades below all its major moving averages, it signals that intermediate-term momentum remains negative. The broader trend structure continues to favor downside pressure, with sellers maintaining control of the price action.
The 100-day simple moving average stands at $78.06, providing the next significant resistance level if SOL manages to break through the immediate $75 zone. However, the most formidable barrier remains the 200-day SMA near $84.71—a level that represents the longer-term trend and would require substantial bullish commitment to overcome.
Momentum Indicators Suggest Renewed Bearish Pressure 📉
The daily Awesome Oscillator painted a concerning picture for bulls, registering at minus 3.34 with red histogram bars indicating that bearish momentum has begun building again after a brief respite in late July. This momentum deterioration occurred despite SOL holding above the $70.60 swing low on the 4-hour chart, preventing an outright breakdown but failing to inspire confidence among buyers.
The divergence between price support and momentum weakness creates an unstable equilibrium. While technical support levels remain intact, the underlying momentum structure suggests that this support could be tested soon if selling pressure intensifies. The red histogram bars on the Awesome Oscillator serve as an early warning signal that the recent consolidation may be giving way to renewed downward pressure.
The Distribution Narrative: Spot Selling Undermines Consolidation 🚨
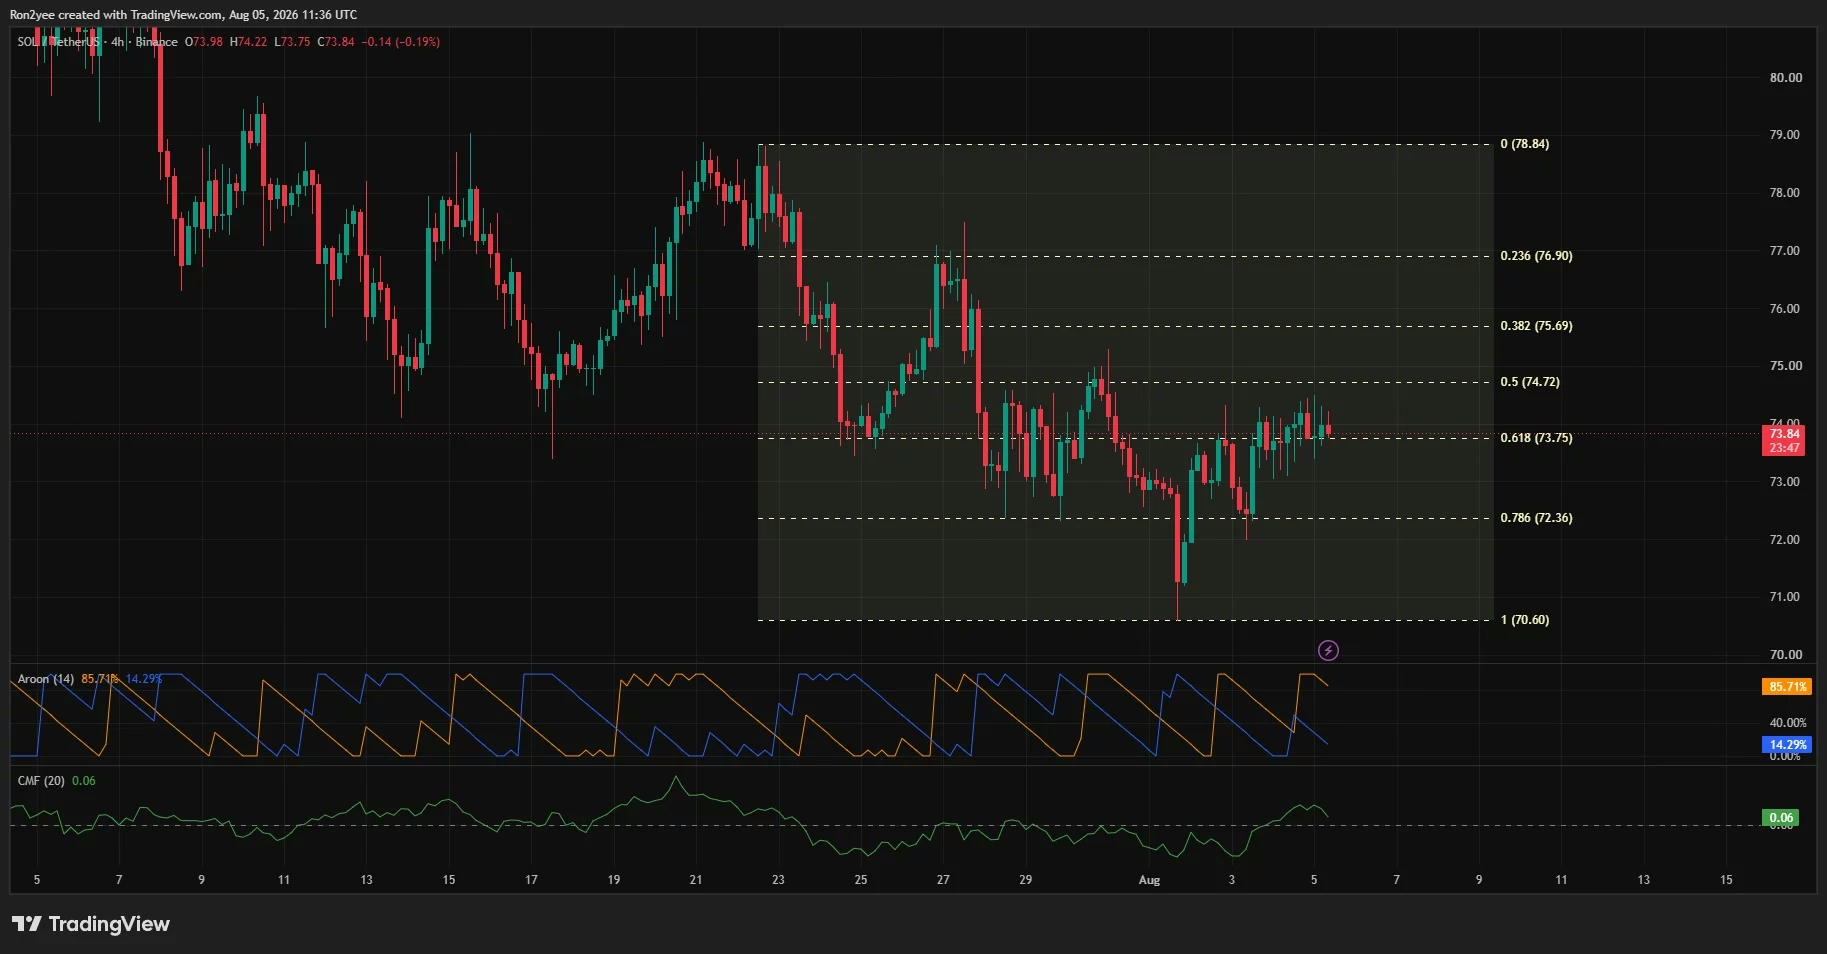
While SOL appears to be consolidating around the 61.8% Fibonacci retracement level at $73.75, a troubling pattern has emerged that deserves investor attention. Market analysts have highlighted that this sideways price action coincides with persistent spot selling—a phenomenon known as distribution in technical analysis terminology.
Distribution describes a market condition where sellers gradually reduce their holdings while maintaining price stability within a narrow range. This pattern can be deceptively dangerous because it creates a false sense of security while systematically weakening the market's structural support. Once short-term buying demand dries up, the market becomes vulnerable to sharp declines as the accumulated selling pressure is finally released.
The 4-hour Chaikin Money Flow indicator provided some mixed signals, registering at 0.06 and suggesting that capital continues to enter the market. However, this positive reading was contradicted by the Aroon Down indicator, which stood at 85.71%—substantially above the Aroon Up reading of 14.29%. This disparity reveals that recent price lows have carried more technical strength than recent highs, indicating that buyers are defending support but have not regained meaningful control.
Together, these indicators paint a picture of a market in transition. Buyers are mounting a defensive stand, but they lack the conviction to drive prices higher. Meanwhile, sellers continue to reduce positions methodically, setting the stage for a potential breakdown once buying interest wanes.
Liquidation Heatmap: Where the Next Volatility Spike Could Occur 🔥
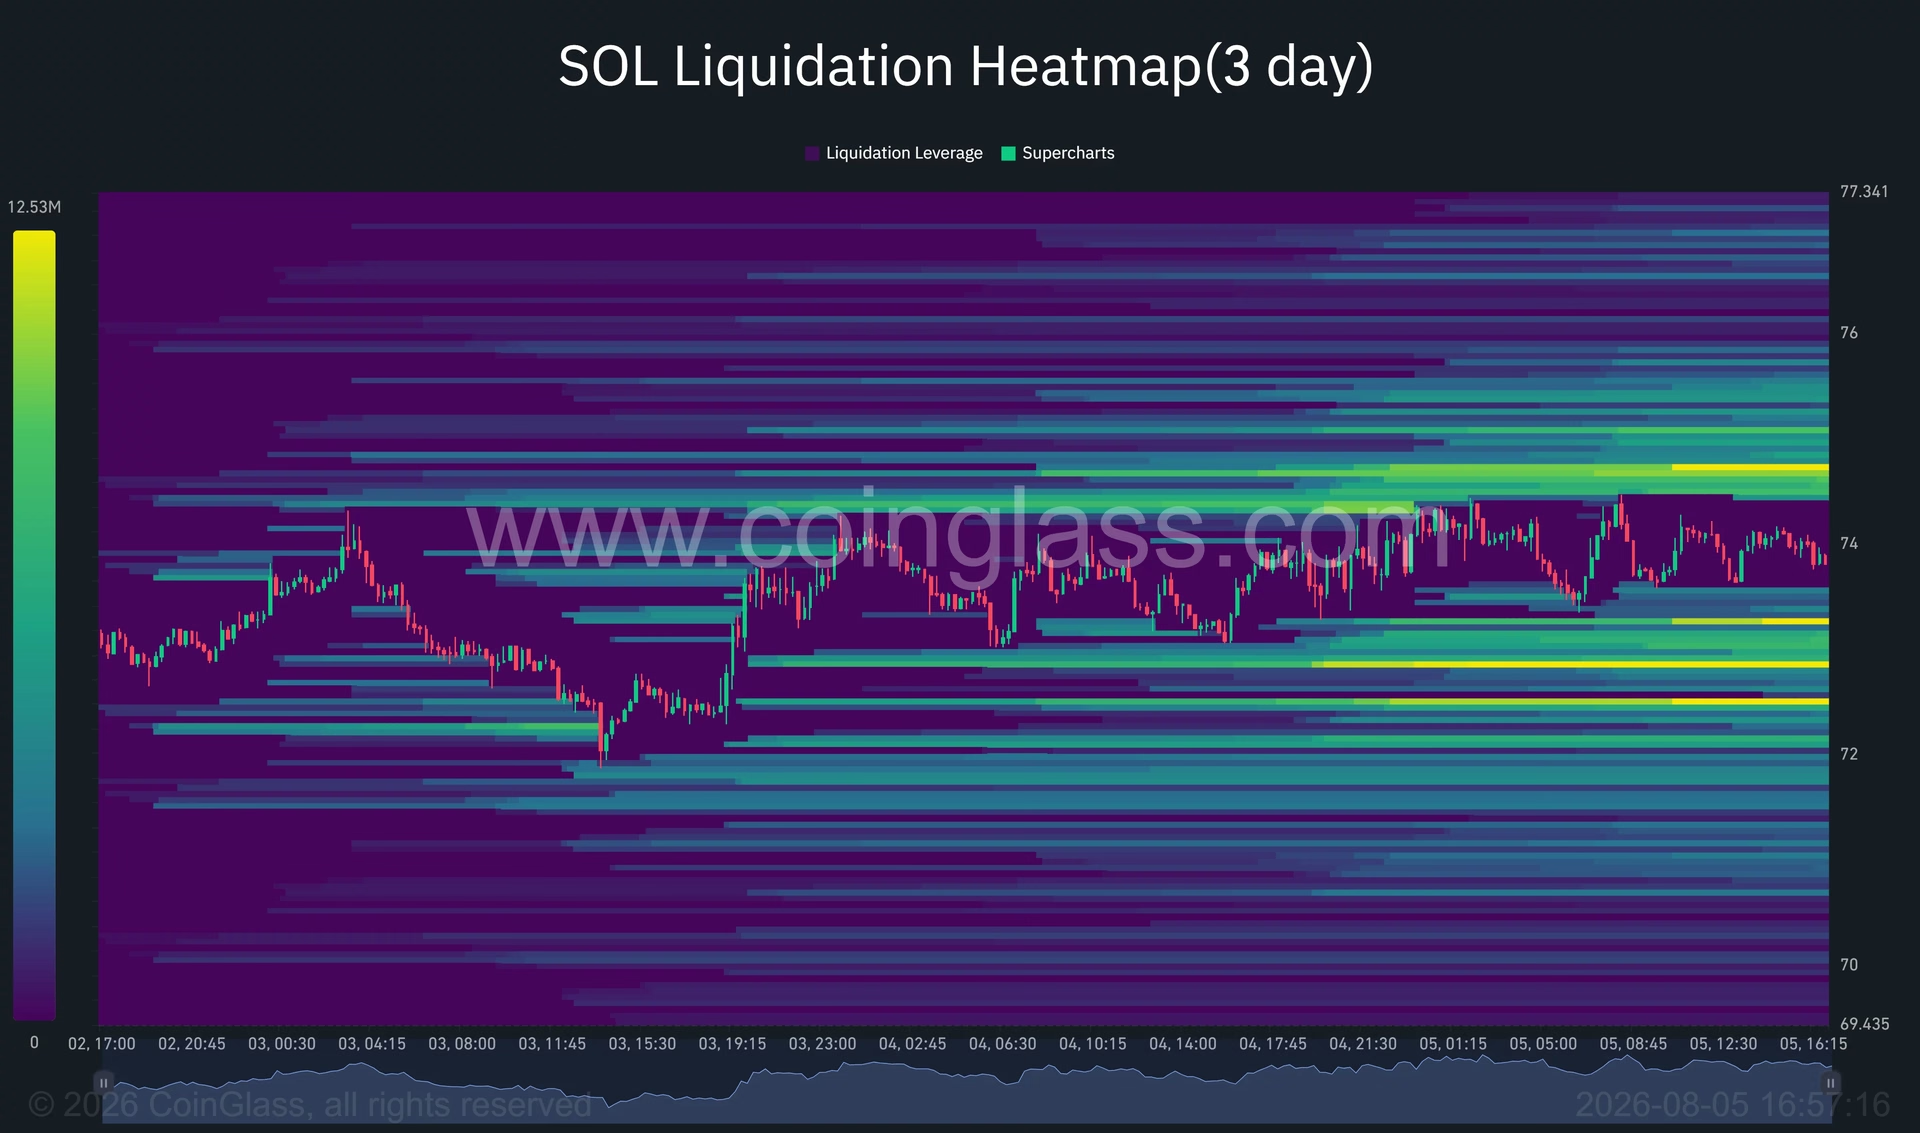
The 3-day liquidation heatmap reveals a fascinating dynamic: leverage has accumulated on both sides of the current price, creating potential flashpoints for sudden volatility spikes. Understanding these liquidation clusters is essential for traders seeking to anticipate the next significant price move.
Bullish Liquidation Scenario:
The most concentrated short liquidations sit directly above SOL's current price, clustered between $74.70 and $75.00. A breakthrough above this zone could cascade into forced position closures, potentially accelerating upward movement toward $76. Additional liquidity appears between $76.40 and $77.30, overlapping with the 4-hour Fibonacci resistance at $76.90 and the July swing high at $78.84.
Bearish Liquidation Scenario:
Conversely, significant long-liquidation clusters sit between $72.60 and $73.00—dangerously close to current price levels. A loss of the $73.75 support level could trigger cascading liquidations that send SOL toward the 78.6% Fibonacci retracement at $72.36. Failure to hold that level would expose $70.60, and a confirmed break below that critical support would invalidate the current consolidation pattern and increase the risk of another test of the June recovery zone.
The liquidation heatmap doesn't predict which outcome will occur first—it merely identifies the zones where forced position closures could amplify existing moves. The real question is whether buyers or sellers will reach their liquidation clusters first.
The $76 Breakout Level: Bulls' Last Stand Before Recovery 💪
Market analysts have identified $76 as the crucial breakout level that would signal a genuine recovery attempt. Analyst Michaël van de Poppe suggested that a breakthrough above this threshold would constitute a powerful bullish trigger, potentially setting up a buy-the-dip strategy with a target as high as $120.
This $76 level sits above the 38.2% Fibonacci retracement at $75.69, and a sustained close above this zone would mark a significant technical achievement. Such a move would push SOL back above its 20-day and 50-day moving averages simultaneously—a development that would represent a genuine shift in the intermediate-term trend structure.
However, bulls shouldn't expect smooth sailing even if $76 is breached. Subsequent resistance layers await at $76.90, $78.06, and the July swing high at $78.84. The daily 200-day average near $84.71 would present another formidable test before the $120 target comes into view.
Institutional Catalysts: Why BlackRock's Move Failed to Spark Breakout 🏛️
Recent positive developments have failed to unlock the breakout that many expected. BlackRock expanded its blockchain-based cash management strategy in late July, with a regulatory filing indicating that its Daily Reinvestment Stablecoin Reserve Vehicle would issue on-chain shares across supported public blockchains—including Solana. This fund, which invests in cash, short-dated US Treasury instruments, and overnight repurchase agreements, represents significant institutional validation of the Solana ecosystem.
The SEC filing provides Solana with another compelling institutional use case, positioning the blockchain as a viable settlement layer for sophisticated financial instruments. Yet despite this positive news, SOL failed to mount a sustained rally, highlighting how technical factors and spot selling pressure can override fundamental catalysts in the short term.
Governance developments also remain in focus, with SGP-0003 linking two significant protocol improvements: SIMD-0550, which would accelerate SOL's disinflation schedule, and SIMD-0553, a resource-based fee proposal that could substantially increase token burns. Industry reports suggest these changes could lift daily burns from approximately 650 SOL to as many as 9,000 SOL—a dramatic increase that could have meaningful long-term supply dynamics implications.
Looking Forward: The Path Forward for SOL 🚀
Solana currently finds itself at a critical juncture, caught between longer-term supply changes and immediate technical pressure. The next few trading sessions will prove decisive in determining whether the current consolidation represents genuine accumulation or distribution.
Key Levels to Monitor:
- $76: Breakout level that would signal recovery attempt
- $75.09: The 50-day moving average resistance
- $73.75: Critical support at the 61.8% Fibonacci retracement
- $72.36: The 78.6% Fibonacci retracement that could trigger further decline
- $70.60: The swing low that, if broken, would invalidate the consolidation pattern
For bulls, a close above $76 would strengthen the recovery case considerably. For bears, a loss of $72.36 would place $70.60 back in focus and suggest that the current consolidation was indeed a distribution pattern rather than an accumulation opportunity. ⚡
Important Disclaimer: This analysis is provided for educational purposes only and should not be considered investment advice. Cryptocurrency markets remain highly volatile and unpredictable. Always conduct your own research and consult with qualified financial advisors before making investment decisions.