Category:
Market AnalysisBitcoin Price Struggles to Maintain $60K Level

In the dynamic world of cryptocurrency, Bitcoin's recent attempt to break above the $60,000 mark has been met with challenges. Despite briefly surpassing this psychological barrier, Bitcoin's price has slipped back, raising concerns among analysts about the underlying demand dynamics.
A Fragile Market Outlook
Bitcoin's price activity reflects a broader sentiment of caution in the market. Analysts point out that weak inflows from stablecoins, which are often used to facilitate crypto purchases, indicate a lack of fresh buying interest. This is a critical factor as stablecoins like USDC and USDT have shown reduced issuance rates, suggesting that new capital is not entering the market at the pace required to sustain a breakout.
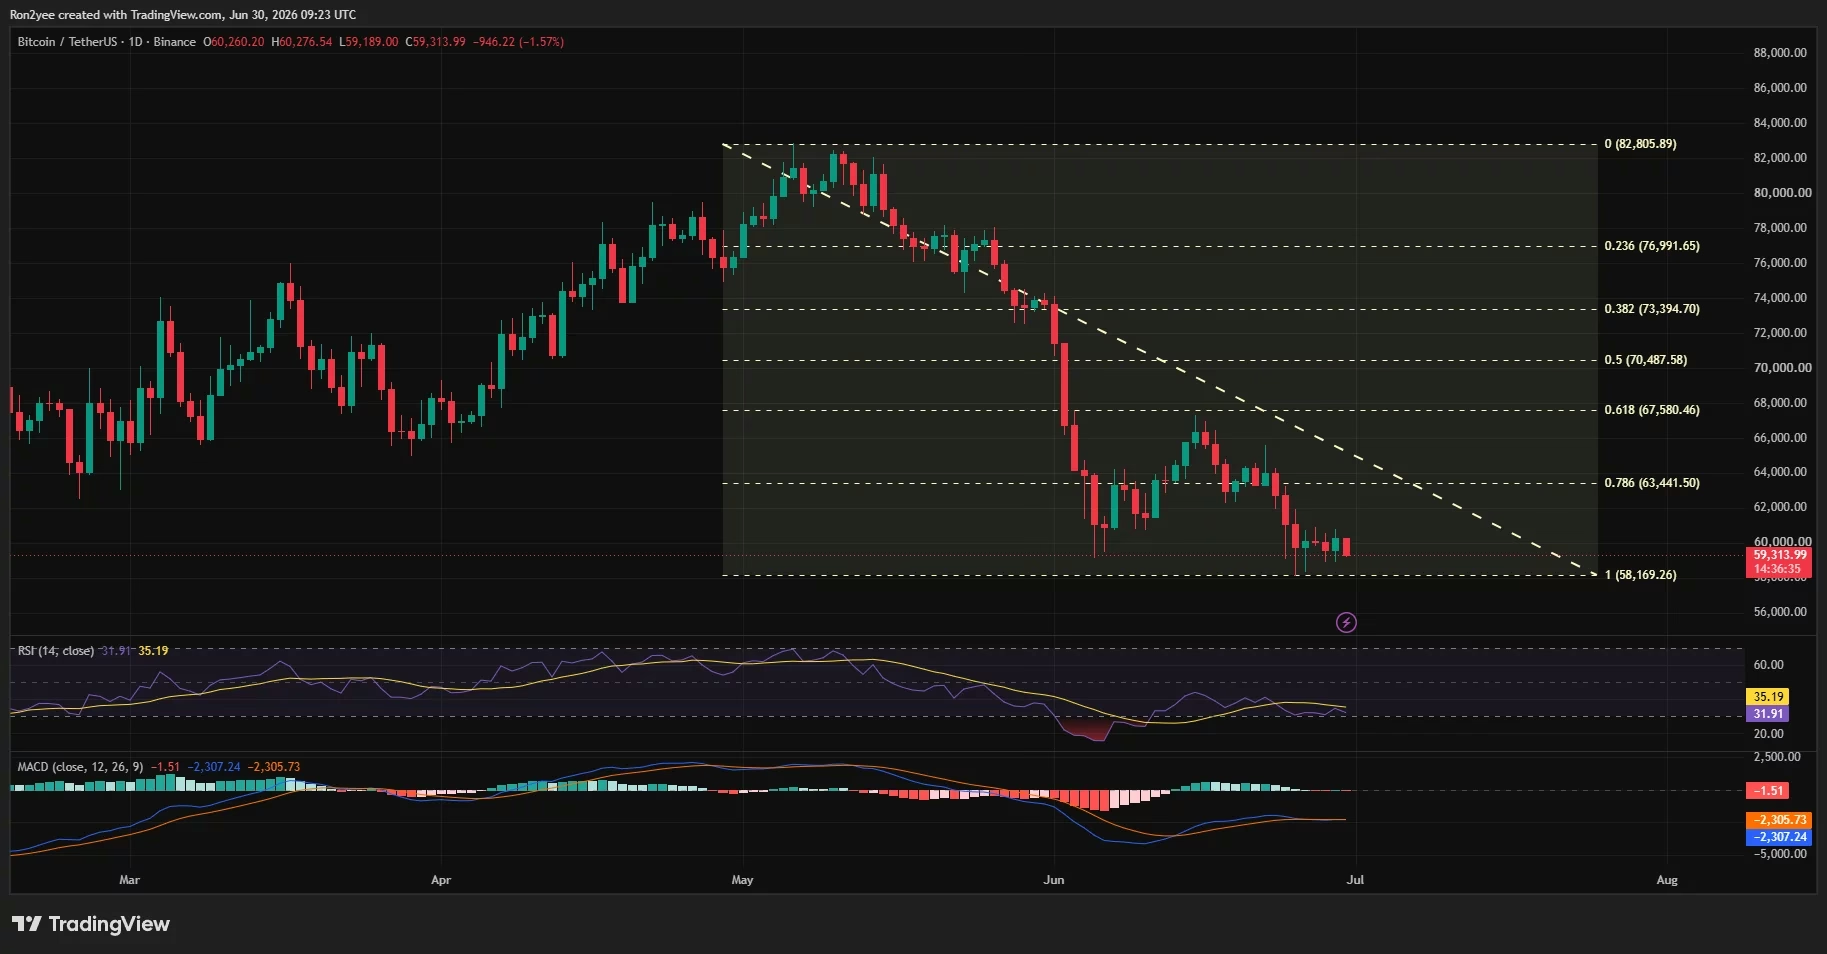
Key Support Levels and Market Risks
Currently, the $58,000 to $59,000 range serves as a crucial support zone for Bitcoin. A breakdown below this level could intensify selling pressure, potentially driving prices into the mid-$50,000 range. Technical indicators such as the daily RSI and MACD continue to reflect a bearish outlook, with the former nearing oversold territory.
Institutional Influence and Market Liquidity
Institutional activities also play a significant role in Bitcoin's price dynamics. Recent data indicates a substantial $1.79 billion outflow from U.S. spot Bitcoin exchange-traded funds (ETFs) in late June, marking the largest withdrawal this year. These outflows have contributed to the liquidity challenges, as fund managers sell Bitcoin to meet investor redemptions, thus removing a significant source of market demand.
Moreover, companies like Strategy have announced potential Bitcoin sales to fulfill financial obligations, further adding to the supply pressure.
Macro Factors and Economic Influences
The macroeconomic environment continues to impact Bitcoin's performance. Higher-than-expected U.S. inflation figures have tempered expectations for Federal Reserve rate cuts, prompting investors to shift towards fixed-income assets. Additionally, geopolitical developments, such as U.S.-Iran negotiations, add layers of uncertainty to the market.
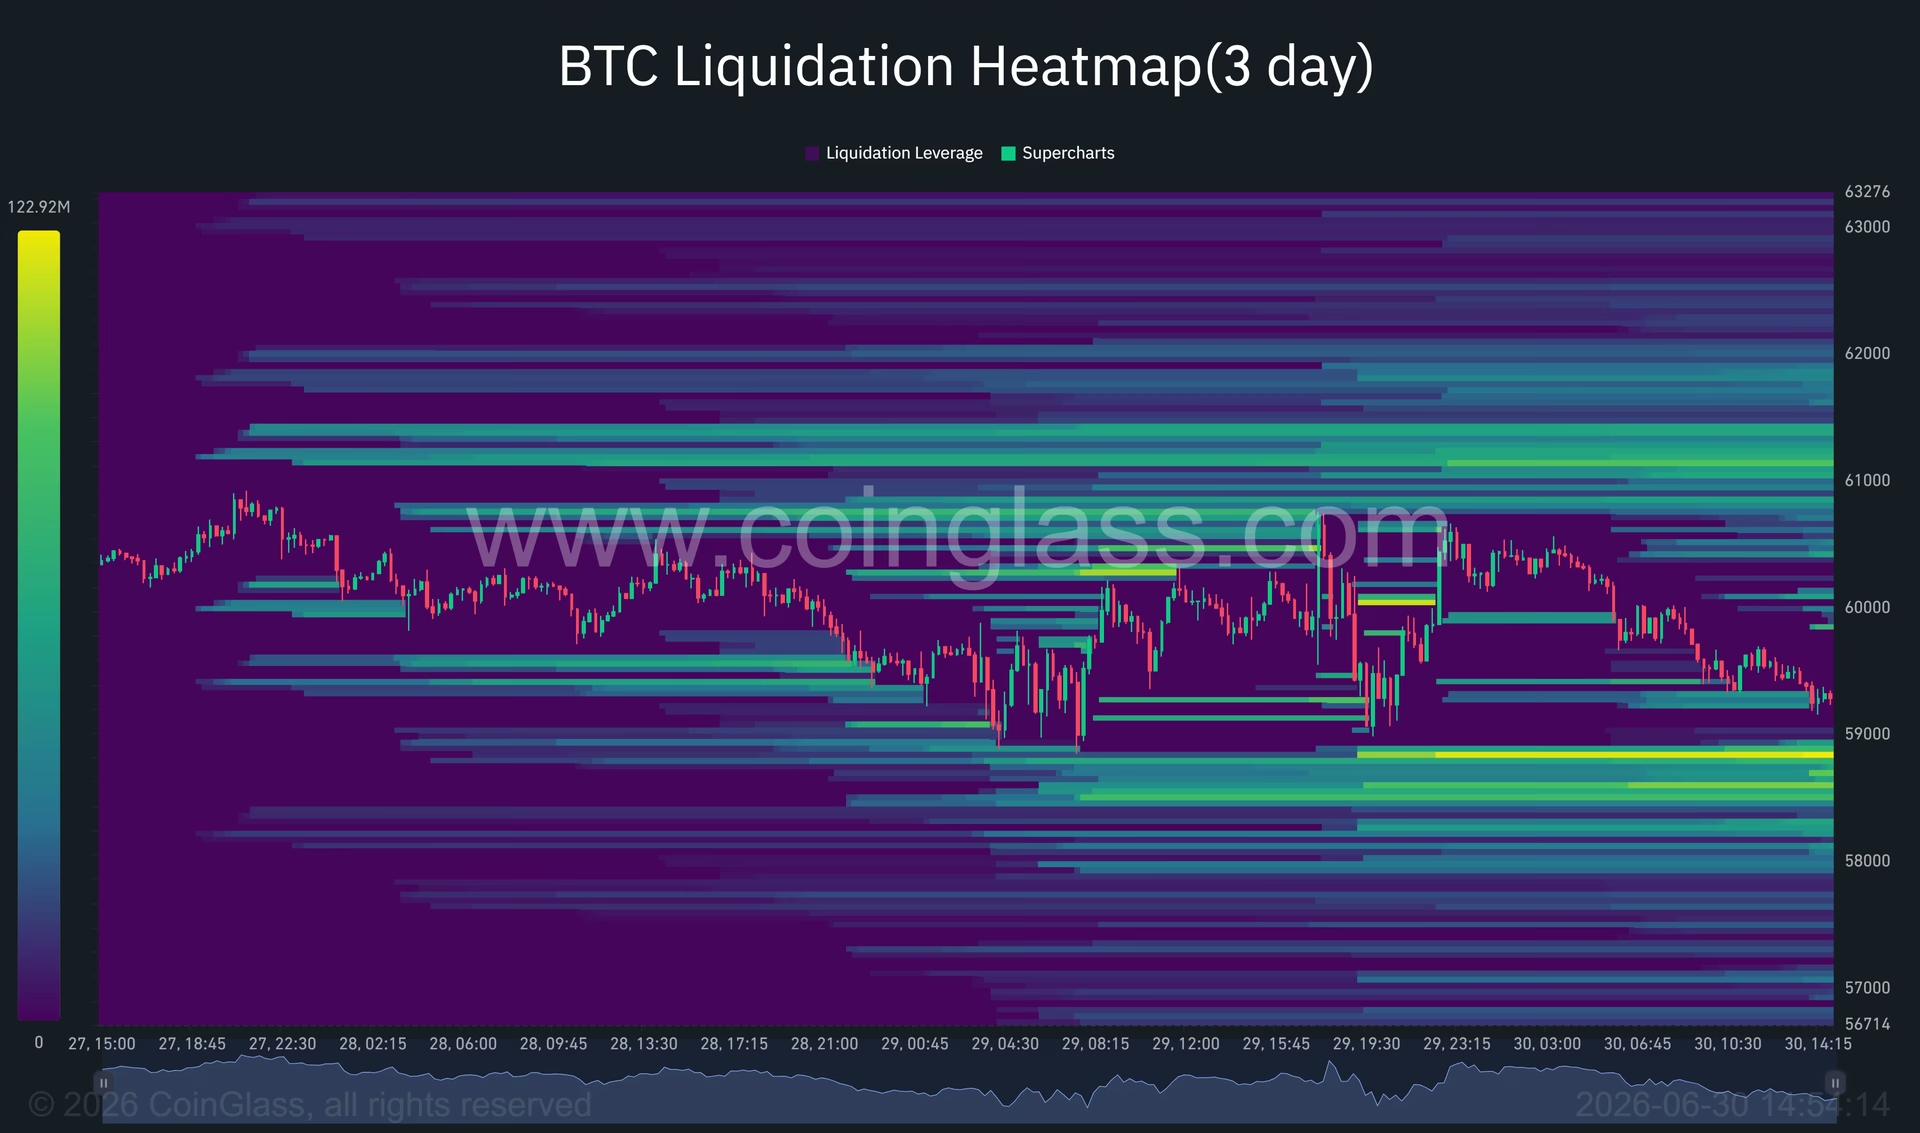
Derivatives and Volatility
Current derivatives positioning suggests heightened volatility, with significant liquidity clusters identified around $58,800 to $59,000, and another between $61,000 to $61,500. These levels could witness increased price activity depending on market momentum.
Conclusion: Cautious Optimism
While Bitcoin's immediate outlook remains uncertain, the key lies in whether it can hold the critical support levels. A successful defense could lead to a relief rally, but continued weakness in stablecoin issuance and macroeconomic headwinds could weigh heavily on Bitcoin's ability to sustain higher price levels.
Investors and traders should remain vigilant, considering the potential for increased volatility and shifting market conditions. As always, the cryptocurrency landscape is one that demands careful analysis and strategic foresight.
You May Also Like

Market Analysis
Bitcoin and XRP Face Resistance Amid Geopolitical Tensions
July 21, 2026

Market Analysis
Cathie Wood's $20M SpaceX Bet Soars 7%
July 21, 2026

Market Analysis
Will Protocol v25 Boost Pi Network Price Over $0.10?
July 21, 2026

Market Analysis
Can Cardano Hit $0.20 Amid Chart Patterns?
July 21, 2026