Category:
Market AnalysisBitcoin Price Stalls at $65K: Holder Selling Risk Intensifies

Bitcoin's struggle to maintain momentum above the $65,000 psychological barrier reveals a critical juncture for the cryptocurrency market. 📊 As of early August 2026, BTC hovered near $65,015, representing a precarious position that has drawn increased scrutiny from market analysts and traders alike. The digital asset's inability to decisively break through this resistance level signals underlying tension between bullish recovery attempts and persistent selling pressure from long-term participants.
Understanding Bitcoin's Current Price Position 🎯
The cryptocurrency landscape has shifted dramatically since Bitcoin's May peak near $82,000. That rally represented one of the most significant bull runs in recent memory, but the subsequent pullback has left many investors reassessing their strategies. Currently trading approximately 3.7% below the short-term holder realized price, Bitcoin finds itself in a vulnerable position that could trigger a wave of profit-taking.
What makes this situation particularly noteworthy is the compression between current price levels and key cost basis thresholds. The $65,000 level has become a battleground where institutional and retail traders are testing each other's resolve. Multiple attempts to hold above this price point have failed, suggesting that sellers remain well-entrenched at higher levels.
The Short-Term Holder Selling Risk 📉
One of the most compelling factors influencing Bitcoin's near-term trajectory involves the behavior of short-term holders—investors who have held their coins for less than 155 days. According to on-chain analysis, these participants maintain an average acquisition price of approximately $67,523, creating a significant psychological pressure point.
The mathematics here are compelling: Bitcoin currently trades $2,571 below this cost basis, or roughly 3.8%. This narrow gap represents the closest convergence since July 21, meaning an increasing number of short-term holders are approaching breakeven on their positions. For many traders who entered the market during the recent rally, a recovery toward $67,500 would provide an attractive exit opportunity.
Historical context reveals a troubling pattern:
- Bitcoin has closed below the short-term holder realized price for 279 of the previous 284 days
- This extended period below cost basis has created pent-up selling pressure
- As the market approaches the breakeven threshold, distribution typically accelerates
Analysts expect that when Bitcoin approaches $67,523, short-term holders will begin liquidating positions to exit near breakeven without absorbing significant losses. This phenomenon, often referred to as "dumping into the market," could create a temporary ceiling that prevents further upside movement.
Technical Analysis: Mixed Signals on Multiple Timeframes ⚙️
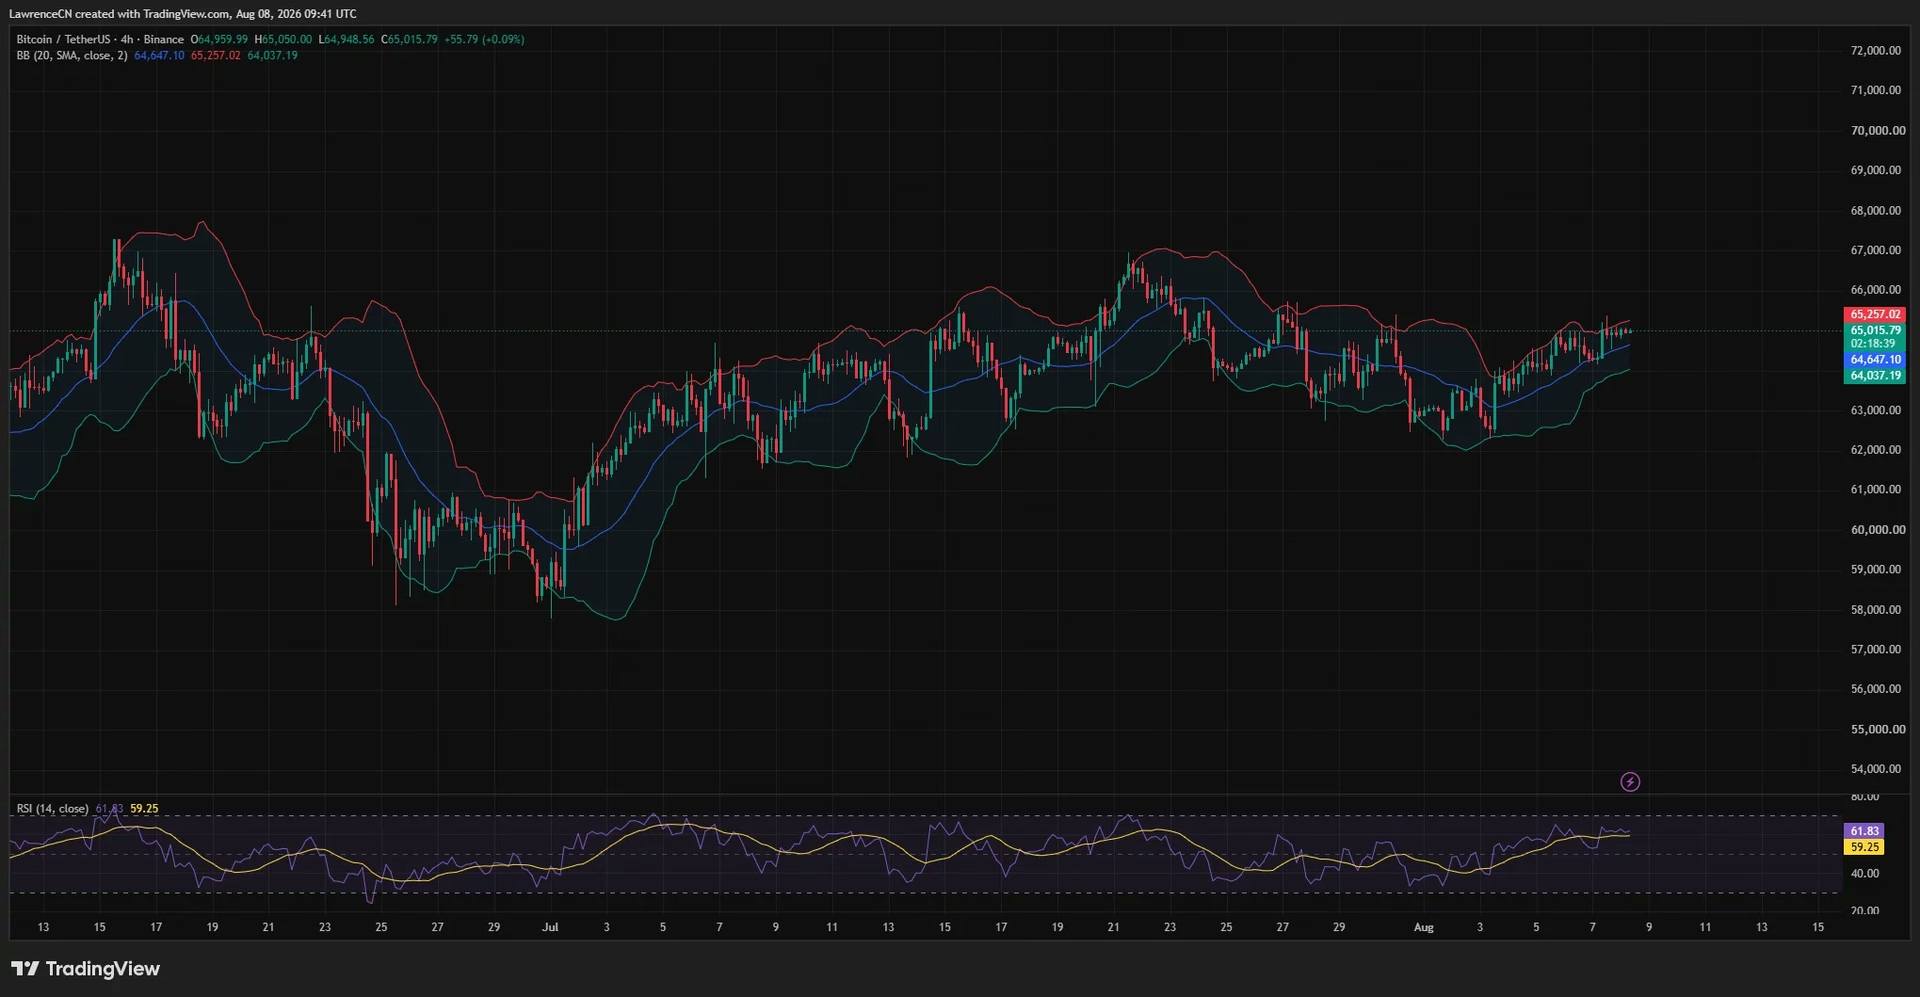
The technical picture presents a nuanced view of Bitcoin's immediate prospects. On the 4-hour chart, momentum indicators paint a relatively constructive scenario. The relative strength index (RSI) stands at 61.83, positioning itself above its moving average of 59.25 without entering overbought territory—a sweet spot that suggests room for additional buying without exhausting buyers.
Bitcoin is currently trading above the Bollinger Band midline at $64,647 and approaching the upper band at $65,257. A sustained close above the upper band could support a move toward $65,600, followed by potential tests of $66,000. However, the daily timeframe tells a different story.
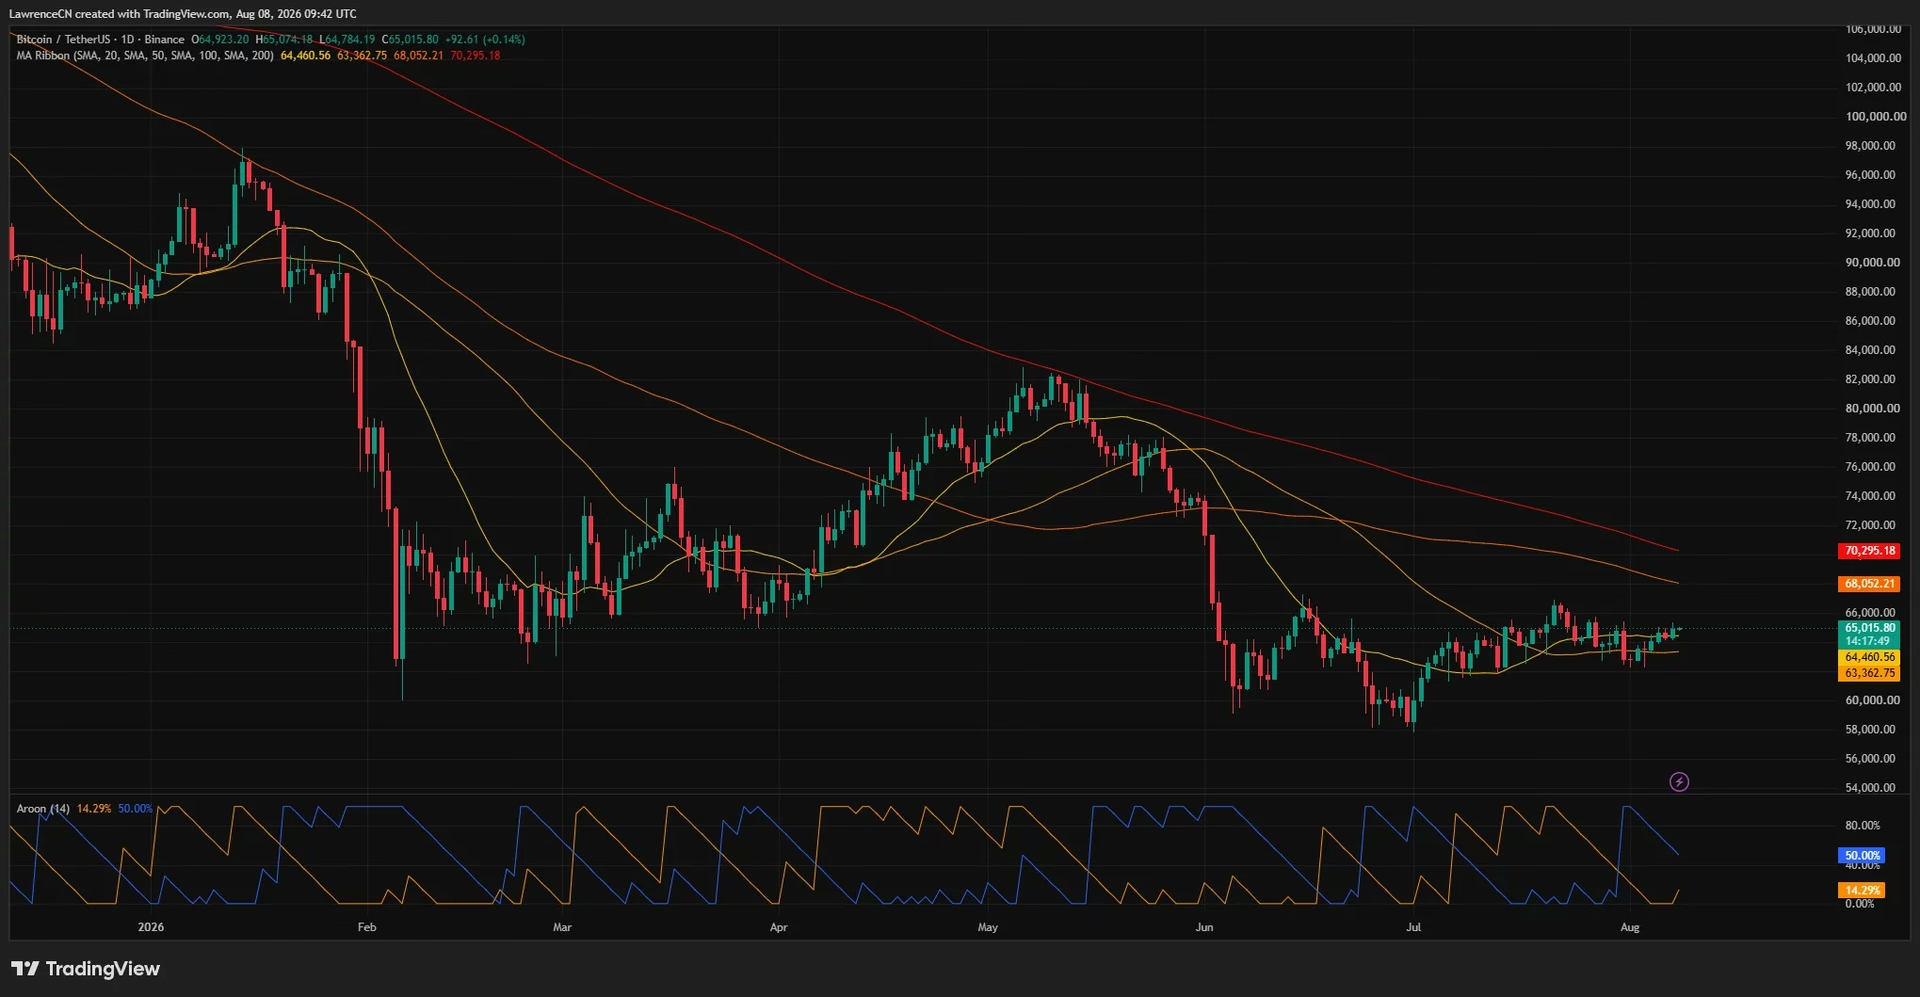
On the daily chart, momentum remains decidedly mixed. The Aroon Up indicator sits at 50%, while Aroon Down registers at 14.29%. While this differential favors buyers, the moderate Aroon Up reading fails to confirm a strong daily uptrend. Bitcoin remains below critical long-term moving averages:
- 100-day SMA: $68,052 (resistance)
- 200-day SMA: $70,295 (major resistance)
- 50-day SMA: $63,363 (support)
- 20-day SMA: $64,461 (support)
These moving average levels reveal that while Bitcoin has recovered from its August 2 low near $62,200, the broader downtrend initiated after the May peak remains firmly intact. The short-term recovery has not yet reversed this macro structure, suggesting limited upside until Bitcoin can establish support above $67,523.
Liquidation Clusters: Where the Real Action Lies 🔥
Understanding where leveraged positions cluster provides crucial insight into potential price movements. The one-week liquidation heatmap reveals a fascinating dynamic: competing liquidity pools above and below Bitcoin's current trading range.
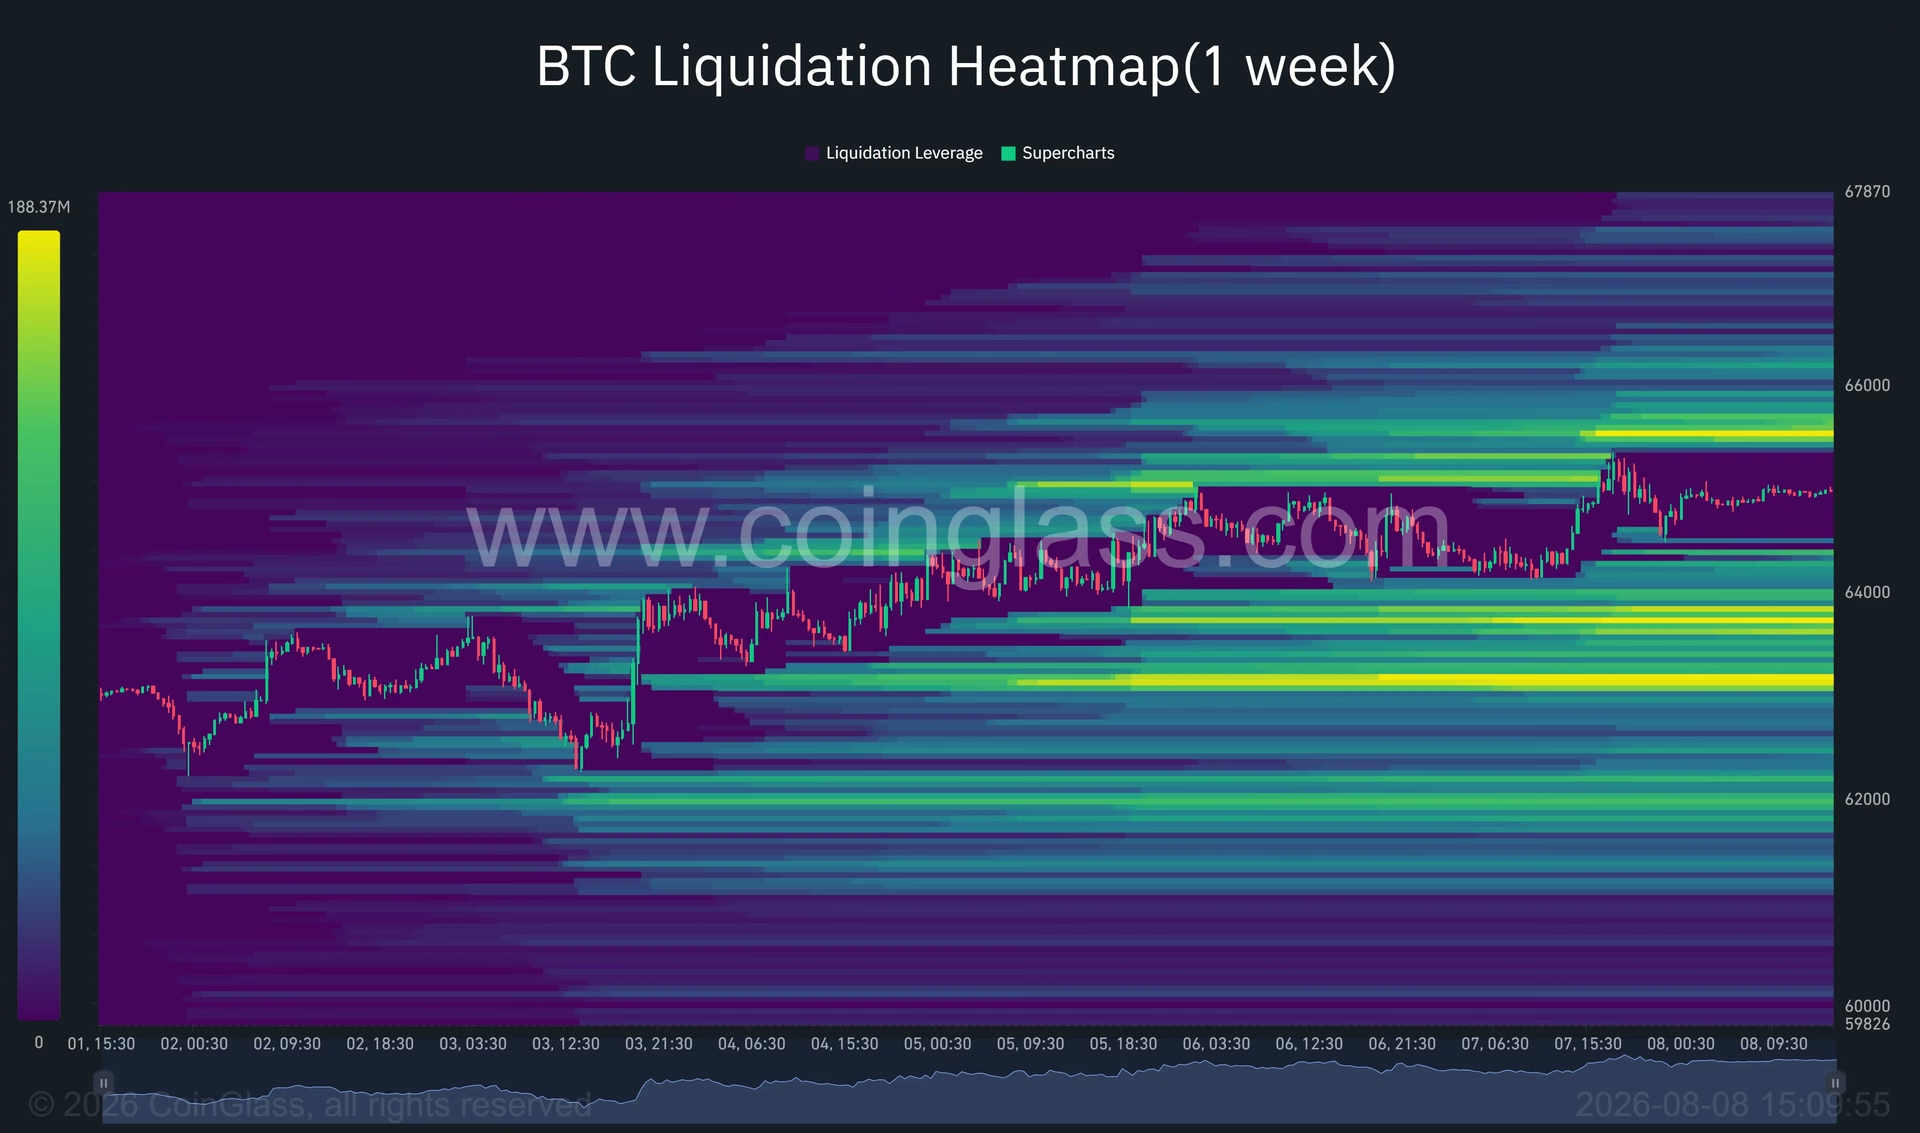
On the upside, significant liquidation clusters appear concentrated around $65,500–$65,700. A decisive move through this zone could trigger a cascade of short liquidations, potentially accelerating a test toward $66,000. Additional liquidity exists above $66,000, though the concentration weakens considerably at higher levels.
The downside picture presents denser clusters:
- Primary cluster: $63,700–$63,900
- Secondary cluster: Near $63,000
- Extended support: $62,000–$63,000 demand zone
- Deeper support: $59,000 if intermediate levels fail
This positioning creates a fascinating dynamic where Bitcoin operates between competing liquidity pools. A breakout above $65,600 would likely trigger a short squeeze, while a breakdown below $64,000 could accelerate movement toward the denser downside clusters. For traders, this represents a high-stakes environment where positioning matters enormously.
Market Structure and Key Resistance Levels 📈
Bitcoin must navigate several critical thresholds to establish a sustainable recovery. The immediate battle centers on $65,000, where sellers have repeatedly demonstrated their presence. Successfully establishing support above this level would represent a psychological victory, but the path to broader recovery remains steep.
The $65,250–$65,600 range represents the next critical battleground. Bitcoin must clear this zone convincingly to establish momentum toward $66,000 and ultimately the short-term holder cost basis. Failure to break through this range could send the price retreating toward the Bollinger midline at $64,647, followed by the lower band at $64,037.
A deeper decline would expose $63,360, where the daily 50-day simple moving average is located. This level has historically provided support during corrections, but if broken, the broader demand zone near $62,000–$63,000 becomes the next significant support area.
Weekend Trading Considerations 🌍
A unique aspect of current market dynamics involves the weekend trading environment. U.S. spot Bitcoin ETFs and CME futures close on weekends, meaning any sharp price movements occurring during this period could create gaps when markets reopen Monday. This structural reality adds an additional layer of uncertainty for traders managing positions through the weekend.
Historically, these gaps have created opportunities for both momentum traders and mean-reversion specialists. A significant move outside the $64,000–$66,000 range over the weekend could produce notable dislocations when regulated U.S. products resume trading Monday morning.
The Broader Market Context 🌐
Bitcoin's current struggle must be understood within the context of broader cryptocurrency market dynamics. The digital asset class remains influenced by macroeconomic factors including interest rate expectations, inflation data, and regulatory developments. The recent employment data showing U.S. payrolls falling by 23,000 has added complexity to the narrative, potentially supporting arguments for more accommodative monetary policy.
Additionally, ongoing regulatory discussions—including developments around clarity legislation—continue to shape investor sentiment. The regulatory environment remains a crucial variable that could either accelerate or impede Bitcoin's recovery trajectory.
Current Bias and What Investors Should Monitor ✅
The immediate bias remains mildly bullish while Bitcoin holds above $64,000. However, this positive sentiment comes with significant caveats. The short-term holder cost basis at $67,523 and long-term moving averages above $68,000 represent formidable barriers to broader recovery.
Key levels to monitor:
- $65,000: Psychological support/resistance
- $65,600: Critical resistance with liquidation cluster
- $67,523: Short-term holder cost basis and major resistance
- $64,000: Support level that, if broken, could accelerate downside
- $63,000: Broader demand zone
Traders and investors should remain vigilant about positioning near these levels, as the concentration of liquidations suggests high volatility could materialize rapidly. The current environment rewards careful risk management and disciplined position sizing.
Conclusion: A Market at an Inflection Point 🎬
Bitcoin's stall at $65,000 represents far more than a simple price consolidation—it reflects fundamental tension between recovery optimism and distribution concerns. The proximity to the short-term holder cost basis creates a powerful psychological magnet that could either accelerate a breakout or trigger renewed selling pressure.
For market participants, the coming days will prove critical in determining whether Bitcoin can establish support above current levels and build momentum toward $67,500 and beyond, or whether selling pressure from near-breakeven holders will reassert control. The liquidation heatmap suggests that whichever direction Bitcoin chooses, volatility will likely accompany the move.
Remember: this analysis represents educational content and should not be considered investment advice. Always conduct your own research and consult with qualified financial advisors before making trading decisions. 💡
You May Also Like

Market Analysis
XRP Price Falls 5% as Leverage Hits Seven-Month High
August 26, 2026

Market Analysis
Crypto Market Hits Extreme Greed: What This Means for Bitcoin
August 26, 2026

Market Analysis
Ethereum Price Rally Overheats Below $2,550 Resistance
August 26, 2026

Market Analysis
Hyperliquid Price Rally: HYPE Targets $97 Amid $80 Support
August 25, 2026