Category:
Market AnalysisXRP Price Falls 5% as Leverage Hits Seven-Month High

The cryptocurrency market witnessed a significant shift in XRP dynamics as the token experienced a notable pullback following one of its most impressive rallies in recent memory. Understanding the mechanics behind this price movement requires examining the interplay between bullish momentum, leverage accumulation, and market sentiment that characterized this period. 📊
XRP's Dramatic Weekly Rally and Sudden Correction 🚀
XRP demonstrated remarkable strength during late August, surging from approximately $1.00 to an intraday peak near $1.69 before retreating to around $1.44. This move represented gains exceeding 50% at its height, marking one of the token's strongest weekly advances since the SEC settlement announcement. Despite the 5.36% decline over 24 hours, XRP remained approximately 43.7% higher on a weekly basis, showcasing the underlying strength of the broader trend.
The rally unfolded within a context of improving market conditions across the cryptocurrency landscape. Bitcoin's movement toward $80,000, driven by falling U.S. Treasury yields and renewed exchange-traded fund demand, created favorable conditions for risk assets. XRP notably outperformed most large-cap cryptocurrencies during this recovery phase, suggesting specific catalysts beyond general market sentiment were at play. 💡
The Leverage Trap: Seven-Month High Signals Caution ⚠️
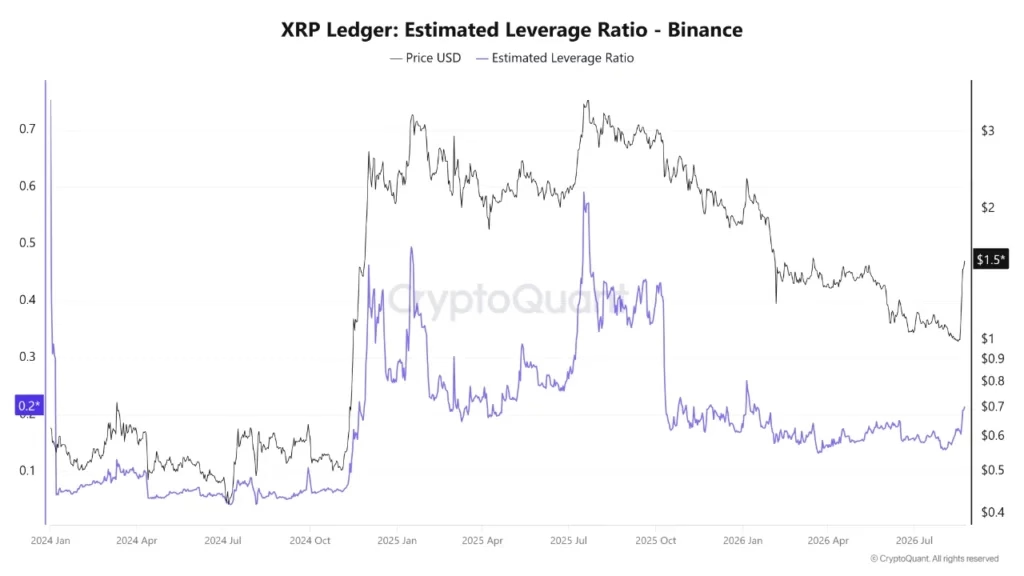
Beneath the surface of XRP's impressive gains, a concerning development emerged: leverage on major exchanges reached levels not seen since January. Binance's estimated XRP leverage ratio climbed to approximately 0.21, representing the highest reading in seven months according to CryptoQuant data. This metric compares futures open interest against the amount of XRP held in exchange reserves, with higher readings indicating increased leveraged derivatives exposure relative to immediately available supply.
The concentration of long positions across major exchanges painted a picture of aggressive bullish positioning. Binance recorded approximately two long accounts for every short account among standard traders, with the ratio among top traders approaching three to one. OKX exhibited similar dynamics, showing close to two longs for each short. This imbalance created a precarious situation where any significant price reversal could trigger cascading liquidations.
Futures trading activity dwarfed spot market participation, with $6.4 billion in 24-hour futures volume exceeding reported spot volume by more than five times. CoinGlass data showed XRP futures open interest near $3.45 billion, with spot activity trailing at approximately $1.2 billion. This divergence highlighted the speculative nature of much of the recent buying pressure and raised questions about the sustainability of the rally. 📈
Understanding Liquidation Cascades and Market Risk 🌊
While elevated leverage ratios don't guarantee a correction, they substantially increase the risk of rapid price declines if key support levels break. When leveraged positions become undercollateralized, exchanges automatically liquidate them to prevent losses. Multiple simultaneous liquidations can accelerate even modest price declines into sharp selloffs, as forced selling creates additional downward pressure.
The $1.42 to $1.50 support zone represented the immediate battlefield for price action. A sustained break below $1.42 could expose support levels between $1.30 and $1.35, while a larger breakdown might target the $1.00 to $1.10 zone. Conversely, reclaiming the $1.45 to $1.50 area would position XRP to challenge the previous peak near $1.69, though this scenario appeared increasingly unlikely given the technical deterioration observed.
Technical Indicators Show Overextension 📉
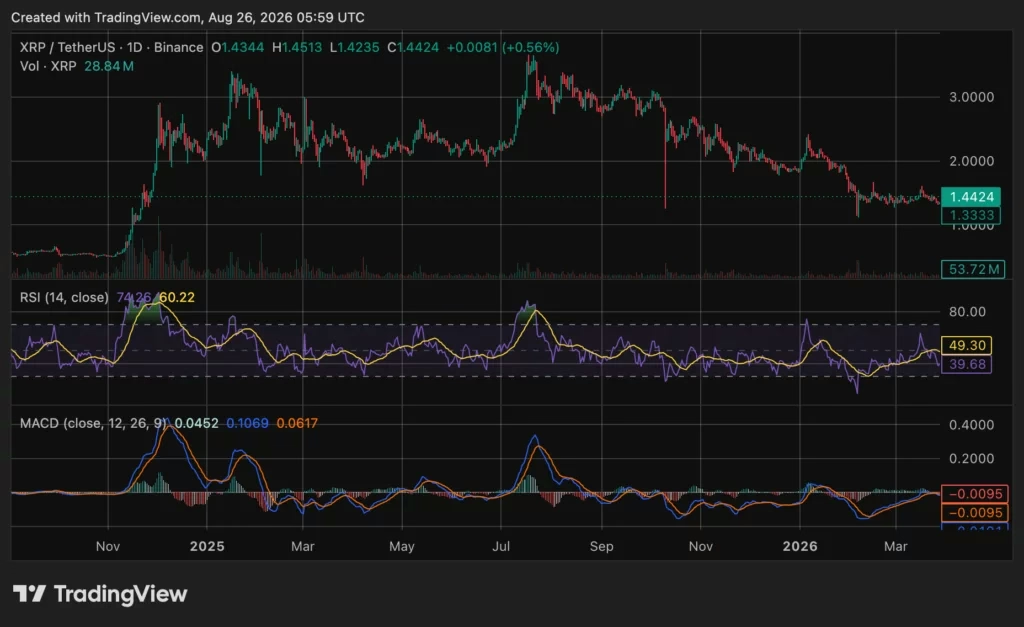
XRP's relative strength index (RSI) reached 74.29 on the daily timeframe, well above the conventional overbought threshold of 70. This reading confirmed strong momentum but simultaneously suggested the rally had become dangerously extended. While overbought conditions don't necessarily trigger immediate reversals—particularly during strong trends—they do increase the probability of pullbacks or consolidation periods.
The MACD indicator presented a more nuanced picture. Its main line stood at 0.1069, above the signal line at 0.0617, with the positive histogram expanding to 0.0453. These readings confirmed that upward momentum remained present despite the daily decline, suggesting the broader trend retained some bullish characteristics even as the token retreated from its peak.
The technical setup reflected a classic scenario of momentum exhaustion: strong directional movement followed by profit-taking and leverage reduction. The combination of overbought RSI readings and extreme leverage positioning created a high-risk environment where even minor negative catalysts could trigger significant selling pressure. 🎯
ETF Activity: Distinguishing Volume from Genuine Inflows 💰
Bitwise's XRP ETF recorded impressive trading volumes, exceeding $80 million during its strongest recent session after topping $60 million during each of the preceding two sessions. However, trading volume represents the value of fund shares changing hands rather than new capital entering the product. U.S. spot XRP ETFs recorded approximately $13.8 million in combined net inflows on August 24, a figure substantially lower than the headline trading volumes might suggest.
This distinction carries important implications for understanding institutional accumulation versus retail speculation. High trading volumes can reflect existing investors rotating positions or taking profits rather than new money entering the market. The cumulative net inflows reaching $1.56 billion provided context for the ETF's growth, but the daily inflow figures suggested that much of the recent trading activity involved position adjustments rather than fresh institutional capital deployment.
The $494.1 million in net assets reported by the Bitwise XRP ETF as of August 24 represented meaningful institutional exposure, yet the trading activity patterns indicated that existing investors were actively managing their positions amid the volatility. This behavior is consistent with risk management practices during periods of extended rallies and elevated leverage. 🔄
Onchain Activity: More Nuance Than Headlines Suggest 🔗
Claims of dramatic increases in XRP receiving addresses circulated across social media, with some sources citing 698% growth. However, these figures often lacked transparency regarding data sources, measurement periods, and methodologies. More detailed analysis showed active addresses rising 654.71%, from 47,180 to 356,070, representing a substantial increase but requiring careful interpretation.
Active addresses include wallets sending or receiving transactions and are not identical to new receiving addresses. Higher address activity can reflect transfers between exchanges, automated wallet operations, payments, or speculative trading rather than accumulation by long-term holders. While the spike in network participation confirmed increased engagement with the XRP network, it primarily indicated heightened volatility and trading activity rather than exclusively proving investor accumulation and holding.
The onchain activity nonetheless confirmed a sharp increase in network participation, a pattern typically accompanying periods of stronger volatility. This consistency with XRP's rapid advance and subsequent pullback suggested that the onchain metrics were reflecting genuine market dynamics rather than fundamental shifts in holder behavior. 📊
Market Context: Broader Cryptocurrency Dynamics 🌍
XRP's price action occurred within the context of broader cryptocurrency market recovery, driven by improving macroeconomic conditions and renewed institutional interest through ETF products. The decline in U.S. Treasury yields reduced the opportunity cost of holding non-yielding assets like cryptocurrencies, while ETF demand provided a structural bid for major digital assets.
XRP's outperformance relative to most large-cap cryptocurrencies during this period suggested that specific catalysts beyond general market sentiment were driving the rally. The SEC settlement and regulatory clarity surrounding XRP provided a fundamental backdrop for improved sentiment, while technical factors and leverage accumulation created the conditions for the sharp rally and subsequent correction.
Historically, XRP remains more than 60% below its July 2025 record of $3.65, providing context for the current price action within a longer-term perspective. The recent rally represented recovery from early August lows rather than a breakout to new all-time highs, an important distinction for assessing the sustainability of the move. 🎪
Key Takeaways and Forward Outlook 🔮
XRP's 5% pullback amid seven-month high leverage readings illustrated the risks inherent in highly leveraged rallies. While the underlying trend remained bullish—with the token up 43.7% weekly—the technical and structural conditions suggested caution was warranted. The concentration of long positions and elevated leverage created a scenario where modest support breaks could trigger significant cascading liquidations.
Investors and traders should monitor several key levels: the immediate support zone at $1.42, followed by the $1.30 to $1.35 area and the larger breakout zone between $1.00 and $1.10. Resistance remained concentrated between $1.45 and $1.50, with the previous peak near $1.69 representing the ultimate bullish target. The divergence between futures volume and spot activity warranted continued monitoring, as it suggested that much of the recent price action involved leveraged speculation rather than fundamental accumulation.
The XRP price action served as a reminder that impressive rallies built on elevated leverage carry inherent risks. While momentum indicators remained bullish, the overbought readings and extreme positioning suggested that consolidation or pullback was a natural and potentially healthy development. Market participants should approach this environment with appropriate risk management, recognizing that the current setup presents both opportunities and significant downside risks. 💡✨
You May Also Like

Market Analysis
Crypto Market Hits Extreme Greed: What This Means for Bitcoin
August 26, 2026

Market Analysis
Ethereum Price Rally Overheats Below $2,550 Resistance
August 26, 2026

Market Analysis
Hyperliquid Price Rally: HYPE Targets $97 Amid $80 Support
August 25, 2026

Market Analysis
Bitcoin Price Dips Below $80K: RSI Signals Overbought Territory 📉
August 25, 2026