Category:
Market AnalysisBitcoin Price Dips Below $80K: RSI Signals Overbought Territory 📉

Bitcoin's recent retreat below the $80,000 mark has sparked renewed discussion among traders and analysts about whether the cryptocurrency's impressive rally has run its course. 🚨 After climbing nearly 25% from the $63,000–$65,000 range in just a few weeks, BTC encountered significant selling pressure that forced a pullback from its intraday peak near $81,250. This correction highlights the ongoing tension between bullish momentum and technical warning signals in the current market environment.
The digital asset's journey through key price levels—$70,000, $72,000, and $78,000—demonstrated the strength of institutional demand, particularly from U.S. spot Bitcoin exchange-traded funds. However, reaching the $80,000 psychological barrier proved more challenging than many optimistic traders anticipated. Understanding the mechanics behind this pullback requires examining both the technical indicators flashing red and the broader market dynamics at play.
Bitcoin Price Action: From Euphoria to Consolidation 📊
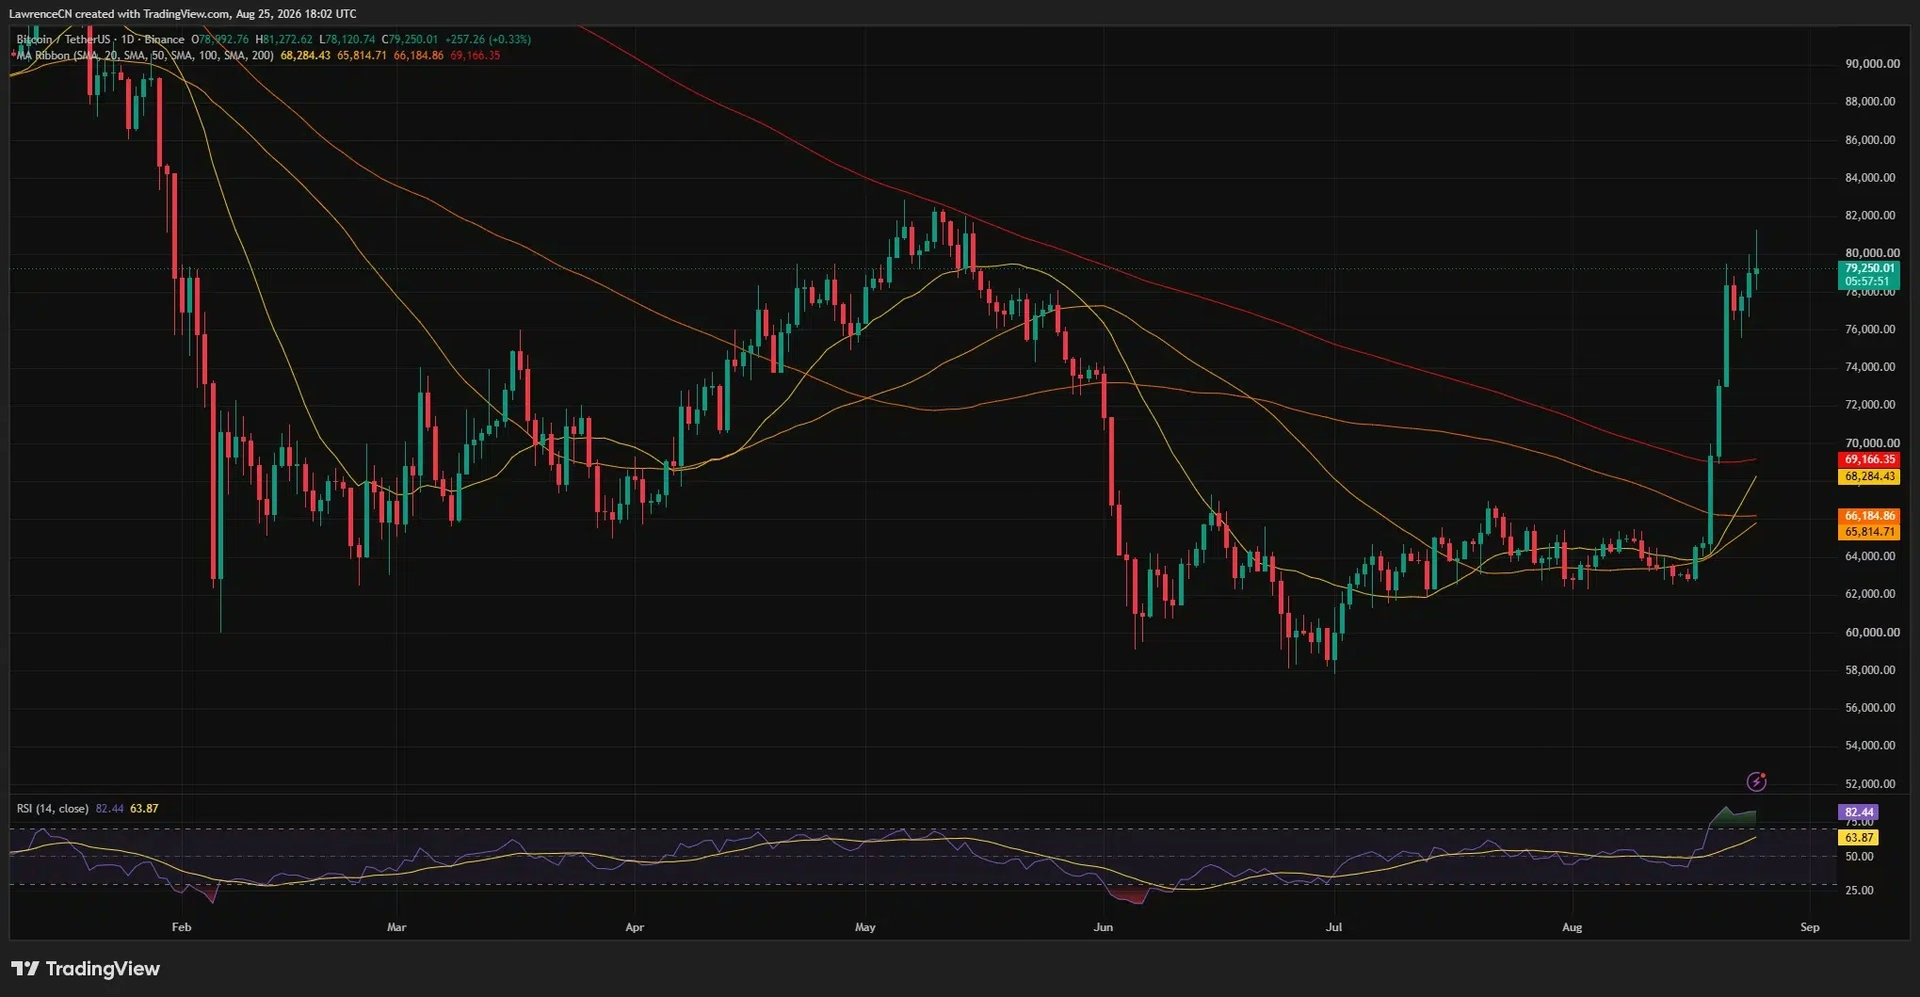
On August 25, Bitcoin price traded near $79,250 after its brief venture above $81,200 encountered resistance. This 2.5% pullback from the intraday peak represents a natural correction following an aggressive rally that had captured the attention of retail and institutional investors alike. The pullback occurred despite favorable macro conditions, including a weaker U.S. dollar and renewed concerns about currency debasement that typically support Bitcoin's value proposition.
The strength of institutional participation became evident through Bitcoin ETF inflow data. U.S. spot Bitcoin exchange-traded funds attracted an impressive $337.56 million in net inflows on August 24 alone. BlackRock's IBIT fund led this charge with $208.9 million in new capital, while Fidelity's FBTC followed with $104.6 million. These figures underscore the growing acceptance of Bitcoin as a legitimate institutional asset class, even as price volatility creates near-term uncertainty.
The RSI Warning: When Overbought Becomes a Red Flag 🚨
Bitcoin's daily Relative Strength Index (RSI) reached 82.44—a level that sits far above the conventional 70 threshold used to identify overbought conditions. This extreme reading represents one of the most significant technical warning signals, suggesting that Bitcoin's price had risen rapidly relative to its recent trading history. While an overbought RSI doesn't guarantee that a rally has ended, it substantially increases the probability of consolidation or deeper pullbacks as early buyers lock in gains.
The RSI moving average, which smooths out short-term fluctuations, stood at 63.87, indicating that while current readings are extreme, the overall momentum trajectory hasn't reversed completely. This distinction matters because it suggests the market remains in a bullish phase, even if immediate pullback risks have increased. Historically, Bitcoin has experienced sharp corrections after RSI readings exceed 80, with many traders using these extremes as signals to reduce leverage or take partial profits.
Moving Averages Provide Support Framework 📈
Despite the pullback, Bitcoin maintained its position above all major moving averages on the daily chart—a bullish signal that shouldn't be overlooked amid the technical warning signs. The 20-day simple moving average sits at $68,284, followed by the 200-day SMA at $69,166. Longer-term averages like the 50-day ($65,815) and 100-day ($66,185) sit even lower, creating a supportive structure beneath the current price.
The breakthrough above the 200-day SMA represents a critical shift in Bitcoin's technical structure. During the June-to-mid-August period, BTC remained trapped below this crucial long-term average while consolidating between $58,000 and $66,000. Breaking above this level signals a meaningful transition from sideways consolidation to genuine uptrend formation—a development that validates the bullish narrative despite current pullback pressures.
Four-Hour Timeframe Shows Trend Strength Persists 💪
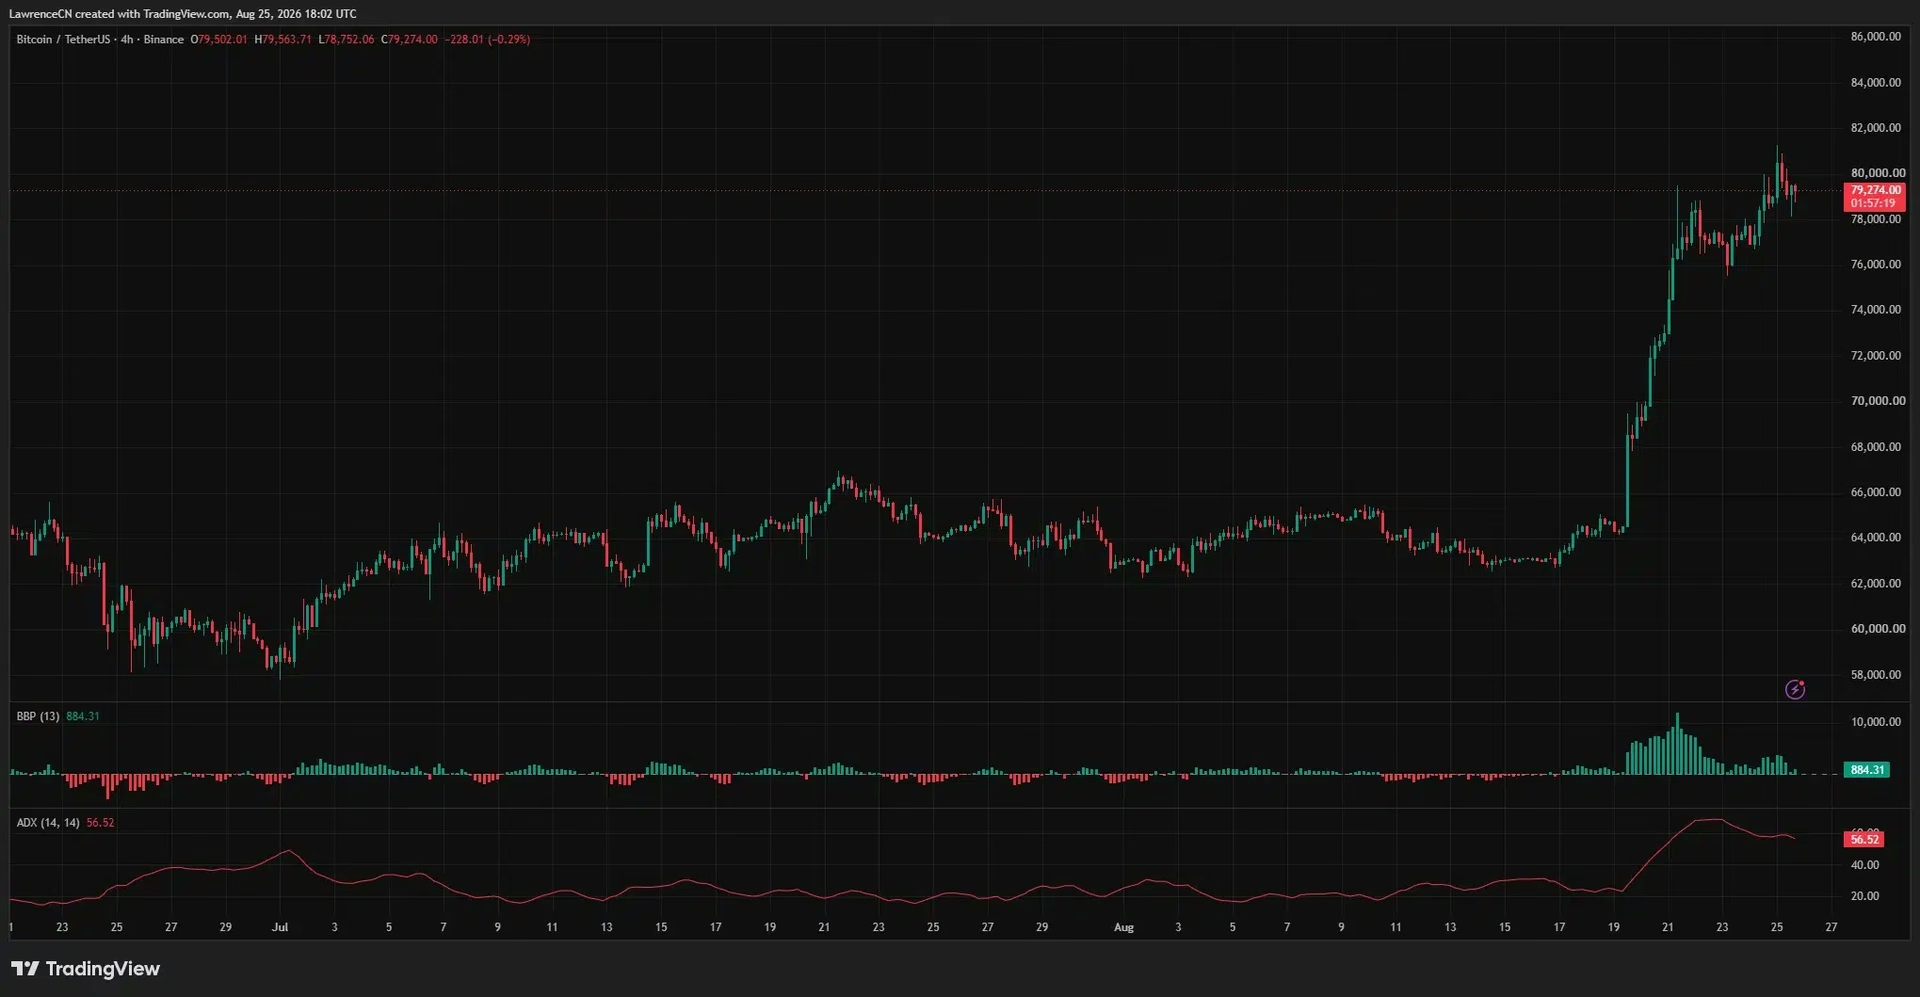
The 4-hour chart reveals that Bitcoin's broader uptrend structure remains remarkably intact, even as daily overbought conditions raise near-term correction risks. The Average Directional Index (ADX) stands at 56.52, far exceeding the 25 threshold typically associated with an established trend. This reading confirms that Bitcoin remains in a genuine trending phase rather than choppy, directionless price action.
However, momentum indicators suggest that the acceleration phase may be moderating. Bull Bear Power, while remaining positive at 884, has declined sharply from the levels recorded during the most aggressive portion of the rally. The ADX itself has begun easing after reaching higher readings during the initial breakout. These developments indicate that upward momentum persists but is no longer accelerating at the same velocity—a pattern that often precedes consolidation or temporary retracement.
Some technical analysts have identified bearish divergences on the 4-hour chart, where price recorded higher highs while momentum indicators produced lower highs. This pattern can signal weakening buying pressure, though it requires confirmation through support breakdown before traders should act on the signal. Potential correction targets identified by market observers include the $72,000–$74,000 zone, representing roughly a 5-7% pullback from current levels.
Liquidation Heatmap Reveals Critical Price Zones 🎯
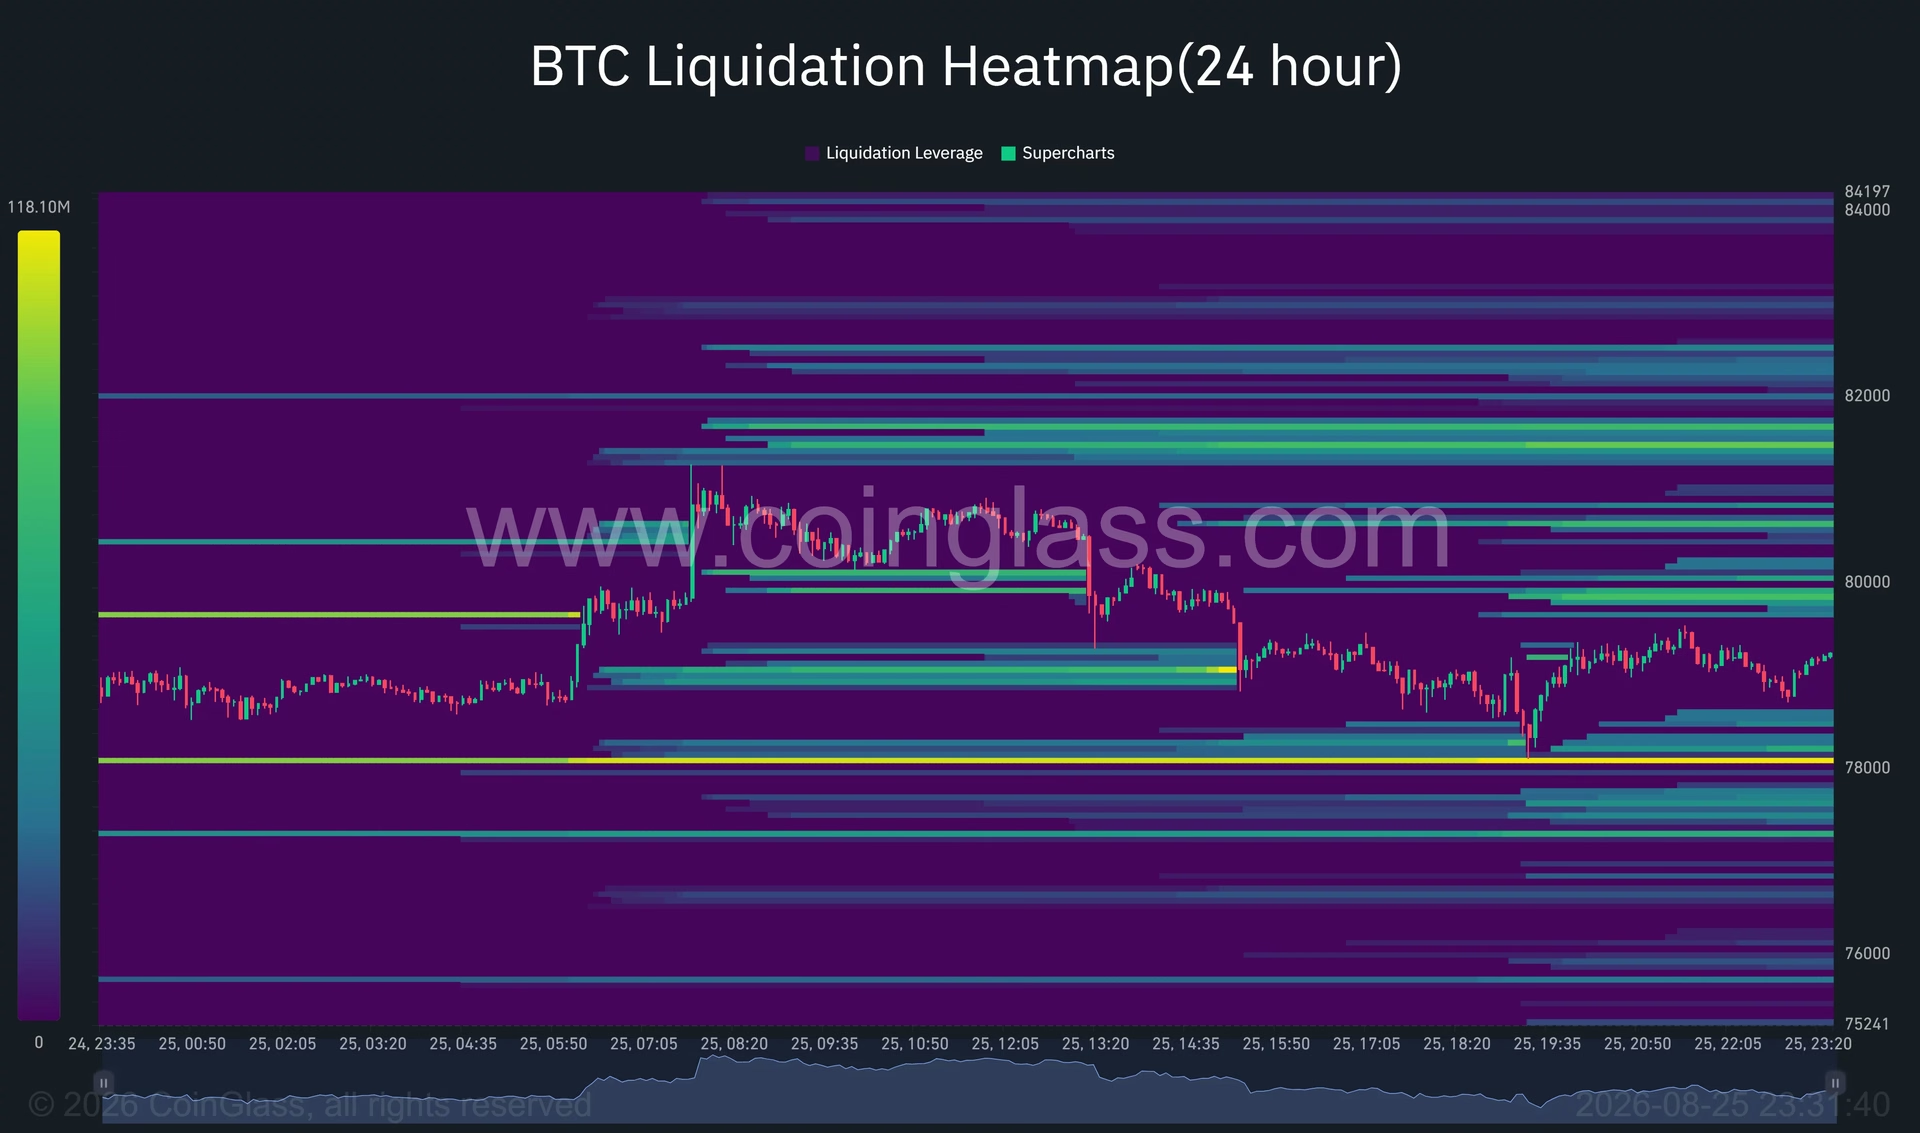
The 24-hour liquidation heatmap provides crucial insights into where leveraged traders have positioned themselves and where forced closures could trigger sharp price moves. The most prominent nearby liquidity concentration appears around $78,000—a level Bitcoin briefly approached during the August 25 session before recovering. A confirmed break below $78,000 could draw price toward additional liquidation clusters at $77,200–$77,500, with lower concentrations visible around $75,500–$76,000 if a more substantial correction develops.
Upside liquidity is equally significant. The strongest nearby resistance concentrations appear between $79,700–$80,100 and around $80,500, with larger clusters stacked between $81,000–$81,700 and near $82,200–$82,500. These liquidity zones represent areas where traders have positioned stop-losses and take-profit orders, making them likely targets for price movement in either direction.
It's important to understand that liquidation heatmaps identify where forced closures could occur, but they don't predict which cluster price will reach first. Bitcoin's current position—sandwiched between substantial liquidity on both sides—creates conditions for sharp intraday swings in either direction. The market remains vulnerable to whipsaw moves that could trigger cascading liquidations.
Derivatives Market Positioning Remains Measured ⚖️
Bitcoin futures open interest declined approximately 1.9% to $56.31 billion from $57.38 billion, suggesting that traders closed positions rather than aggressively opening new short exposure as price retreated. This measured response indicates that the market hasn't panicked into bearish positioning, which could prevent a severe liquidation cascade if downside pressure intensifies.
The broader derivatives market showed $179.2 million in estimated liquidations across the market-wide ecosystem, with $100.2 million in shorts and $79 million in longs. This relatively modest liquidation volume suggests that leverage levels remain controlled and that the market hasn't become dangerously overleveraged—an important distinction that reduces tail-risk concerns.
What Bitcoin Needs to Sustain the Breakout 🔑
For the bullish narrative to remain intact, Bitcoin must reclaim and hold the $79,200–$80,000 area on a closing basis. Breaking through the intraday high near $81,250 would significantly weaken the failed-breakout signal and place the May resistance region around $82,000–$83,000 back in play. This scenario would validate the theory that the pullback represents a healthy consolidation within a larger uptrend rather than the beginning of a major reversal.
The first important downside zone sits between $77,500 and $78,000. A confirmed break below this area would expose $76,500–$77,000, followed by $75,700–$76,000. These levels represent critical support zones that, if violated, could trigger more aggressive selling and potentially confirm the bearish divergence signals identified on shorter timeframes.
Broader Context: Why Bitcoin Rallied in the First Place 🌍
Understanding the fundamental drivers behind Bitcoin's 25% rally provides important context for assessing whether the current pullback represents a temporary pause or the beginning of a more significant correction. The weaker U.S. dollar has historically supported Bitcoin valuations, as investors seek alternative stores of value when currency debasement concerns mount. Additionally, renewed focus on the Federal Reserve's monetary policy stance has kept currency depreciation concerns in the forefront of market discussions.
Institutional adoption continues to accelerate, with spot Bitcoin ETFs providing easier access for traditional finance participants. The approval and successful launch of these products in the United States represented a watershed moment for Bitcoin's mainstream acceptance. Consistent inflows from these vehicles suggest that institutions view current price levels as attractive, even amid near-term technical concerns.
Key Takeaways: Navigating the Current Uncertainty 💡
Bitcoin's slip below $80,000 amid overbought RSI readings presents a classic case of technical warning signals conflicting with bullish structural developments. Several critical points emerge from this analysis:
-
Technical warnings exist but don't guarantee reversals: Overbought RSI readings increase correction risks but don't confirm that rallies have ended. Bitcoin remains above all major moving averages, maintaining its bullish structure.
-
Institutional demand remains robust: Consistent ETF inflows suggest that institutions view pullbacks as buying opportunities rather than signals to reduce exposure.
-
Liquidation zones create volatility potential: The concentration of leveraged positions near $78,000 and between $81,000–$82,000 means sharp intraday moves remain likely in either direction.
-
$80,000 represents a critical threshold: Reclaiming and holding this level would validate the breakout narrative, while confirmed breaks below $77,500 would signal more serious technical deterioration.
-
Momentum remains positive but moderating: While the broader trend structure shows strength, the deceleration in momentum indicators suggests the aggressive phase of the rally may be maturing.
The coming days will be crucial in determining whether Bitcoin uses this pullback as a launching pad for another leg higher toward $82,000–$83,000 or whether it represents the beginning of a more substantial correction. Traders and investors should monitor the $79,200–$80,000 support zone closely, as this area will likely determine the next significant directional move. 🚀
You May Also Like

Market Analysis
XRP Price Falls 5% as Leverage Hits Seven-Month High
August 26, 2026

Market Analysis
Crypto Market Hits Extreme Greed: What This Means for Bitcoin
August 26, 2026

Market Analysis
Ethereum Price Rally Overheats Below $2,550 Resistance
August 26, 2026

Market Analysis
Hyperliquid Price Rally: HYPE Targets $97 Amid $80 Support
August 25, 2026