Category:
Market AnalysisHyperliquid Price Rally: HYPE Targets $97 Amid $80 Support

Hyperliquid Reaches New Heights in Historic Rally 🚀
The cryptocurrency market has witnessed remarkable momentum across digital assets, and Hyperliquid stands at the forefront of this bullish movement. The HYPE token recently achieved an all-time high near $83.27, marking a significant milestone for the decentralized derivatives trading platform. This achievement represents more than just a price milestone—it reflects growing confidence in Hyperliquid's infrastructure and its role in reshaping how traders access leveraged markets.
The journey to this record level has been nothing short of impressive. Starting the week around $69.60, HYPE demonstrated the kind of explosive growth that captures market attention and attracts institutional interest. The token's performance underscores the broader strength in alternative layer-1 and specialized blockchain platforms that offer unique value propositions beyond general-purpose computing.
The Catalyst Behind HYPE's Bullish Surge 📈
Several factors converged to create the perfect environment for Hyperliquid's remarkable ascent. The acceleration began in mid-August when the token jumped from below $60 to approximately $70 in a single session, establishing momentum that would carry through the following weeks. This wasn't merely technical trading—fundamental developments provided genuine support for the rally.
Hyperliquid's ecosystem expansion played a crucial role in driving adoption metrics upward. Integration developments with major cryptocurrency platforms, including notable partnerships with established exchanges, signaled growing institutional acceptance of Hyperliquid's technology stack. Additionally, the launch of Elysium L2 for the Hyperliquid ecosystem opened new possibilities for scaling and composability within the platform.
The macroeconomic environment also favored risk assets during this period. Falling US Treasury yields, particularly following expanded long-dated bond buyback operations by the Federal Reserve, reduced borrowing cost pressures that had previously constrained cryptocurrency valuations. When traditional finance becomes less attractive, capital flows increasingly seek higher-yield opportunities in digital assets, creating tailwinds for quality projects like Hyperliquid.
Breaking Through Previous Resistance Levels 💪
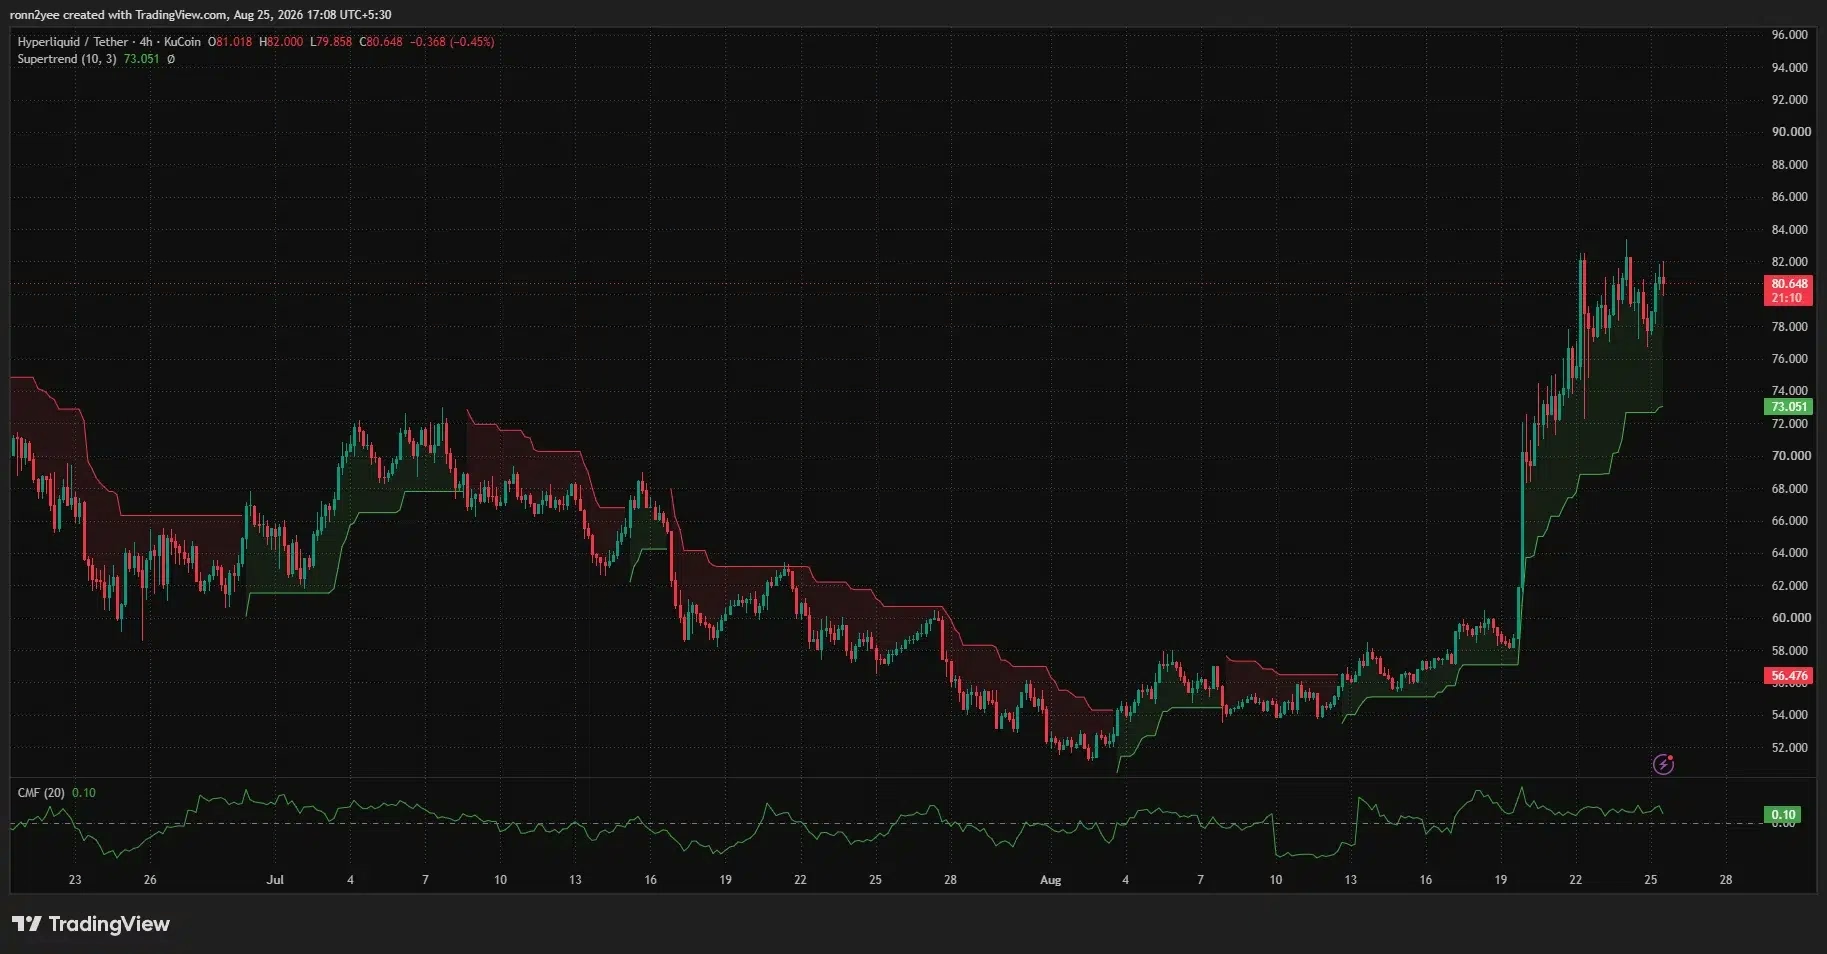
The path to record highs wasn't without obstacles. Throughout June and July, HYPE faced repeated resistance near the $75 level, creating a psychological barrier that many traders believed would cap the rally. However, buyers demonstrated conviction by systematically pushing through these levels, establishing a clear trend of higher highs and higher lows.
The breakthrough accelerated as momentum built. After breaking through the $75 resistance zone, buyers extended their positions aggressively. The token briefly traded above $83 before profit-taking pulled prices back toward the $78 area. This consolidation pattern is actually healthy for sustainable rallies, as it allows momentum indicators to reset while maintaining the overall uptrend structure.
On the 4-hour timeframe, the technical setup remains particularly constructive. The Supertrend indicator—a trend-following tool that identifies directional momentum—continues to signal bullish conditions above the $73.05 support level. This suggests that even during minor pullbacks, the underlying trend structure remains intact and supportive of further upside exploration.
Overbought Signals Create Short-Term Uncertainty ⚠️
While the bullish narrative dominates, technical analysts have noted some warning signs that warrant attention. The daily Relative Strength Index (RSI) reached 74.91, well above the 70 threshold typically associated with overbought conditions. This elevated reading indicates that the rally has become extended relative to historical norms, suggesting that new buyers are entering at elevated prices.
However, experienced traders understand that overbought conditions during strong uptrends don't automatically signal imminent reversals. In fact, some of the most powerful rallies maintain elevated RSI readings for extended periods. The key distinction lies in whether new buying is driven by genuine fundamental adoption or purely speculative leverage. The Chaikin Money Flow indicator provides insight here, and its positive reading of 0.10 suggests that spot market demand remains stronger than leverage-driven buying.
The Moving Average Convergence Divergence (MACD) indicator reinforces the bullish perspective. With the MACD line at 5.89 above the signal line at 3.28, and a positive histogram reading of 2.61, momentum remains intact despite the overbought RSI reading. This divergence between momentum indicators actually suggests the rally has room to extend further before exhaustion becomes apparent.
Price Targets: Can HYPE Reach $97? 🎯
Analysts have begun projecting ambitious targets for Hyperliquid's next leg higher. The immediate resistance sits at the 100% Fibonacci level around $83.52, calculated from the advance between approximately $25.64 and the current record area. A confirmed daily close above this level would place HYPE in price discovery territory, where limited historical supply makes identifying resistance more challenging.
If buyers maintain momentum through $83.52, the psychological $90 level becomes the next natural target. However, the most intriguing projection involves the $97 to $100 range. Crypto analysts have noted that HYPE is currently printing its second-largest monthly candle, with approximately 63% gains already achieved in August. If the token were to match May's impressive 91% monthly expansion, it would indeed reach near the $97 level by month's end.
This projection remains conditional on sustained momentum, but the technical setup certainly permits such an outcome. The daily chart's Fibonacci retracement levels and the 4-hour Supertrend support suggest that current support levels are well-defined, allowing traders to maintain positions with reasonable risk management.
Liquidation Clusters: The Hidden Risk Factor 🔥
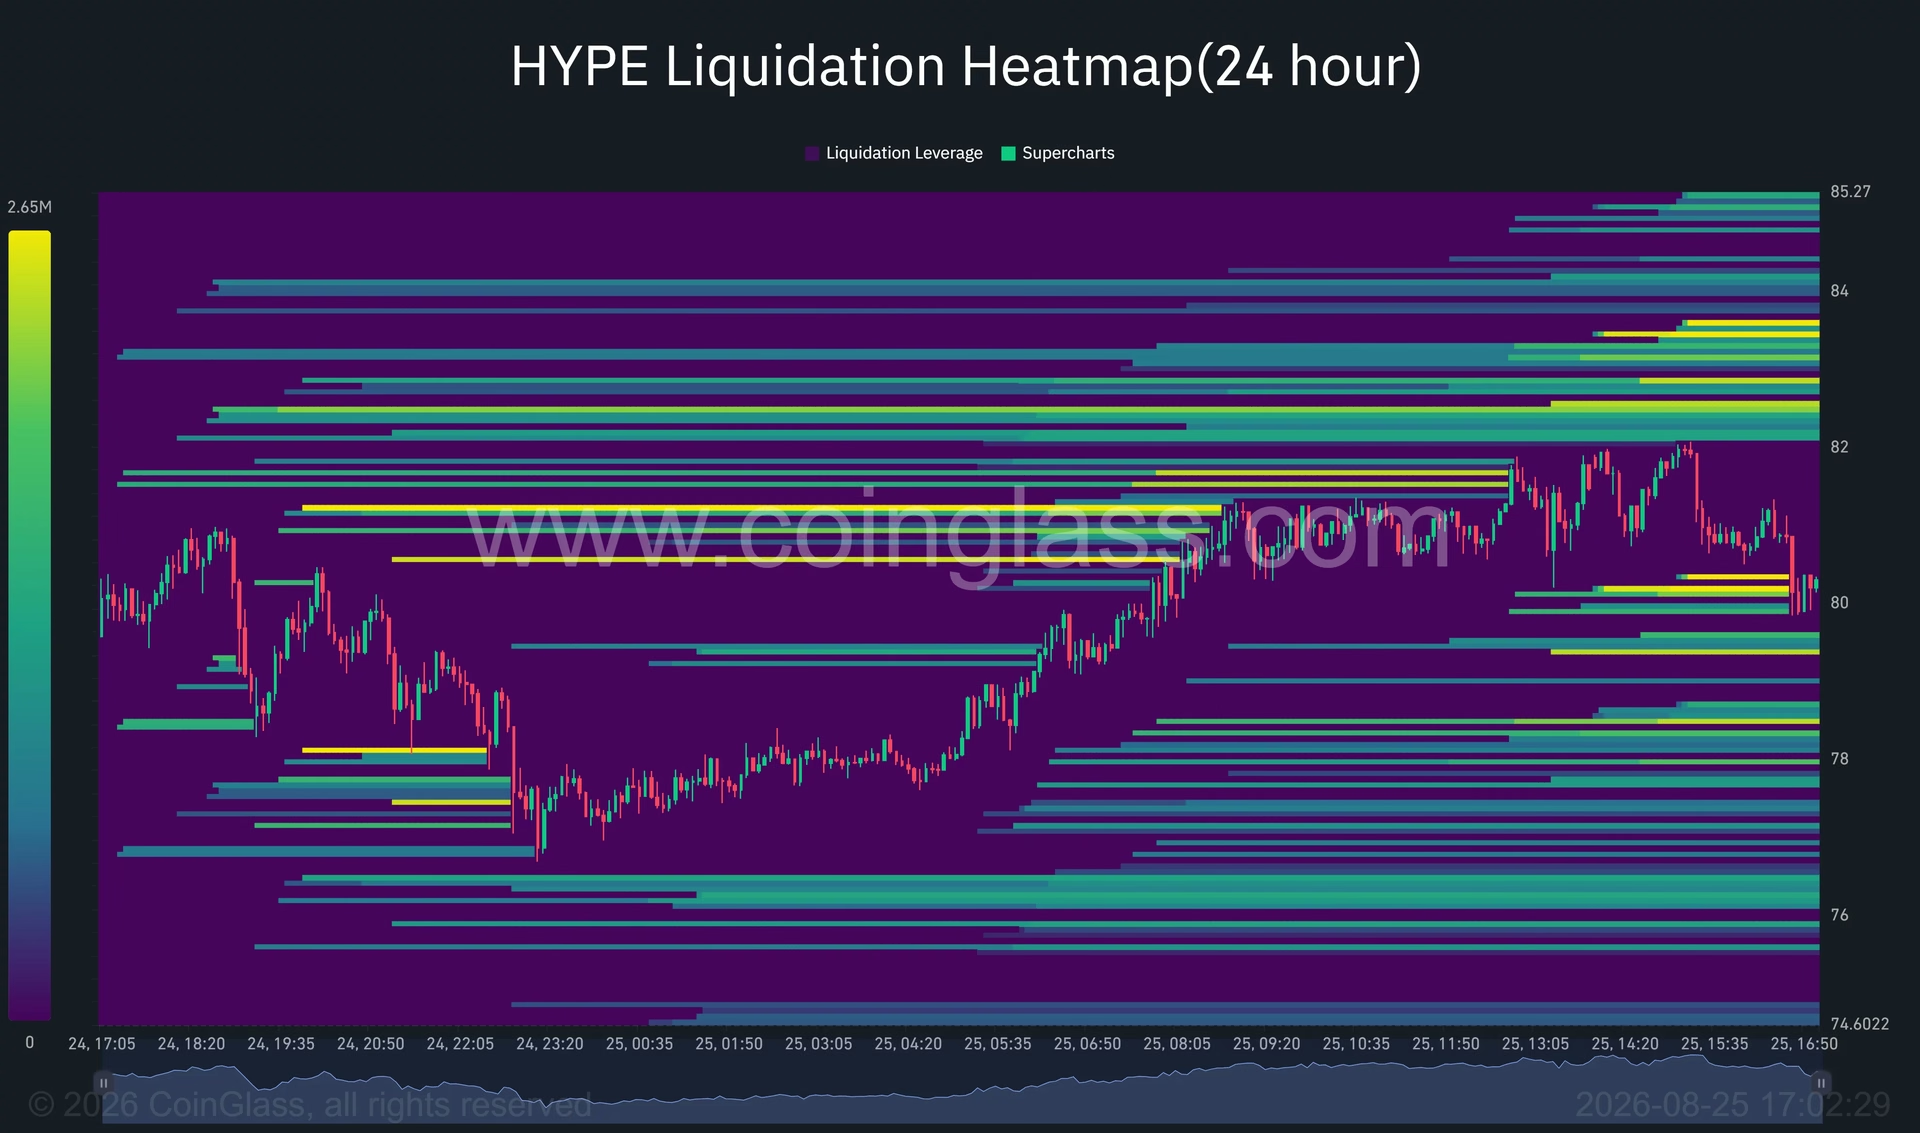
Beneath the surface of Hyperliquid's impressive price action lies a complex landscape of leveraged positions that could amplify volatility in either direction. The 24-hour liquidation heatmap reveals concentrated liquidity clusters that act like magnets for price movement, particularly in the current consolidation zone.
Upside liquidation concentrations sit above $82, with additional bands between $82.50 and $84. A decisive move through $82 could trigger a cascade of leveraged short closures, generating market buy orders that accelerate the move toward the record high. The strongest overhead concentrations appear around $82.30 and $83.40, suggesting that reaching these levels could spark significant liquidation volume.
Downside liquidation risk is equally pronounced. Concentrated leverage sits around $80, $79.30, and $78.40. Breaking below $80 could force long position liquidations, drawing the price toward these clusters in a self-reinforcing cycle. Larger liquidity pockets also exist around $76–$77, making that range an important support level if the current consolidation breaks lower.
This two-way liquidation risk explains why HYPE has been trading in a relatively tight consolidation pattern despite the overbought conditions. Traders on both sides of the market have built defensive positions, creating a delicate balance between bulls and bears.
Support Structure and Downside Scenarios 📊
While the bullish case dominates current market sentiment, prudent traders must also consider downside scenarios. The former resistance level and Fibonacci retracement around $71.14 form a stronger support zone below the immediate $73.05 Supertrend level. This area proved significant during June and July, as HYPE repeatedly faced resistance near these levels. If the current uptrend weakens, this zone could transform from former resistance into reliable support.
A deeper correction could extend toward the 61.8% Fibonacci retracement at $61.41, though such a move would require a more substantial breakdown in the current uptrend. The $54.58 level represents the next major support, but reaching this area would indicate a significant reversal of the current bullish structure.
Understanding these support levels helps traders develop comprehensive trading plans that account for both upside opportunities and downside risks. The key threshold to monitor remains the $73.05 Supertrend level—a break below this point would signal that the immediate uptrend has exhausted itself.
Market Context: Why Hyperliquid Matters Now 🌟
Hyperliquid's remarkable performance reflects broader trends in cryptocurrency market infrastructure development. As the industry matures, specialized platforms that offer superior user experiences and innovative features gain competitive advantages over generalized competitors. Hyperliquid's focus on leveraged derivatives trading with an emphasis on speed, capital efficiency, and user control has resonated strongly with the trading community.
The platform's emphasis on decentralization and transparency distinguishes it from traditional centralized exchanges. By enabling traders to maintain custody of their assets while accessing sophisticated trading tools, Hyperliquid appeals to the core values of cryptocurrency enthusiasts while delivering practical functionality that serious traders demand.
Furthermore, the regulatory environment surrounding cryptocurrency derivatives continues to evolve. Hyperliquid's proactive engagement with policy discussions—including advocacy for equitable perpetual futures frameworks—positions the platform as a thoughtful participant in shaping the industry's future. This approach builds credibility with both traders and regulators.
Technical Consolidation Suggests Continued Strength 💫
Price action has begun consolidating between approximately $77 and $83 following the rapid breakout. This consolidation pattern, while potentially frustrating for momentum traders, actually represents a healthy development for sustainable rallies. The consolidation allows several important technical processes to occur simultaneously: overbought conditions can normalize, weaker hands can be shaken out, and institutional participants can accumulate positions at more reasonable prices.
A close below $77 would weaken the immediate structure and potentially expose the Supertrend support at $73.05. However, the repeated entry of buyers during declines toward $77–$78 suggests that this area commands genuine support from conviction-based traders rather than algorithmic liquidations alone.
The consolidation pattern also provides an opportunity for momentum indicators to reset. While the daily RSI remains elevated, extended consolidation periods typically allow these indicators to decline toward more neutral readings, setting up conditions for another strong leg higher without triggering capitulation-style reversals.
What Traders Should Monitor 👀
As Hyperliquid navigates this critical juncture, several key levels and indicators warrant close attention:
Immediate Resistance: $83.52 (100% Fibonacci level) and $82–$84 (liquidation clusters)
Immediate Support: $80 (liquidation concentration), $77–$78 (repeated buyer entry zone)
Structural Support: $73.05 (Supertrend level), $71.14 (former resistance/Fibonacci level)
Key Indicators: Daily RSI (currently 74.91), Chaikin Money Flow (currently 0.10), MACD (currently bullish)
Volume Dynamics: Monitoring whether volume increases on breakouts above $83.52 versus consolidation periods
Traders should also remain aware of the liquidation heatmap, as sudden moves through concentrated leverage zones could produce outsized price movements that create both opportunities and risks.
Looking Ahead: The $97 Question 🔮
The question of whether Hyperliquid can reach $97 by month's end ultimately depends on sustained momentum and continued positive developments for the ecosystem. The technical setup certainly permits such a move, with well-defined support levels and bullish trend indicators supporting further upside exploration.
However, markets rarely move in straight lines. The consolidation pattern between $77 and $83 may extend longer than some traders expect, or a brief correction toward $73 could test conviction before the next leg higher. These potential setbacks would not invalidate the broader bullish case—they would simply represent normal market behavior within an established uptrend.
What remains clear is that Hyperliquid has established itself as a significant player in the cryptocurrency derivatives ecosystem. Whether the token reaches $97, $90, or experiences a pullback to $71, the fundamental growth trajectory of the platform appears intact. For traders and investors, the key is maintaining disciplined risk management while remaining responsive to changing technical conditions.
The coming weeks will likely determine whether current momentum can overcome overbought conditions and liquidation resistance, or whether consolidation and profit-taking will dominate. Either way, Hyperliquid's remarkable rally has already demonstrated the market's confidence in the platform's vision and execution.
You May Also Like

Market Analysis
XRP Price Falls 5% as Leverage Hits Seven-Month High
August 26, 2026

Market Analysis
Crypto Market Hits Extreme Greed: What This Means for Bitcoin
August 26, 2026

Market Analysis
Ethereum Price Rally Overheats Below $2,550 Resistance
August 26, 2026

Market Analysis
Bitcoin Price Dips Below $80K: RSI Signals Overbought Territory 📉
August 25, 2026