Category:
Market AnalysisEthereum Price Rally Overheats Below $2,550 Resistance

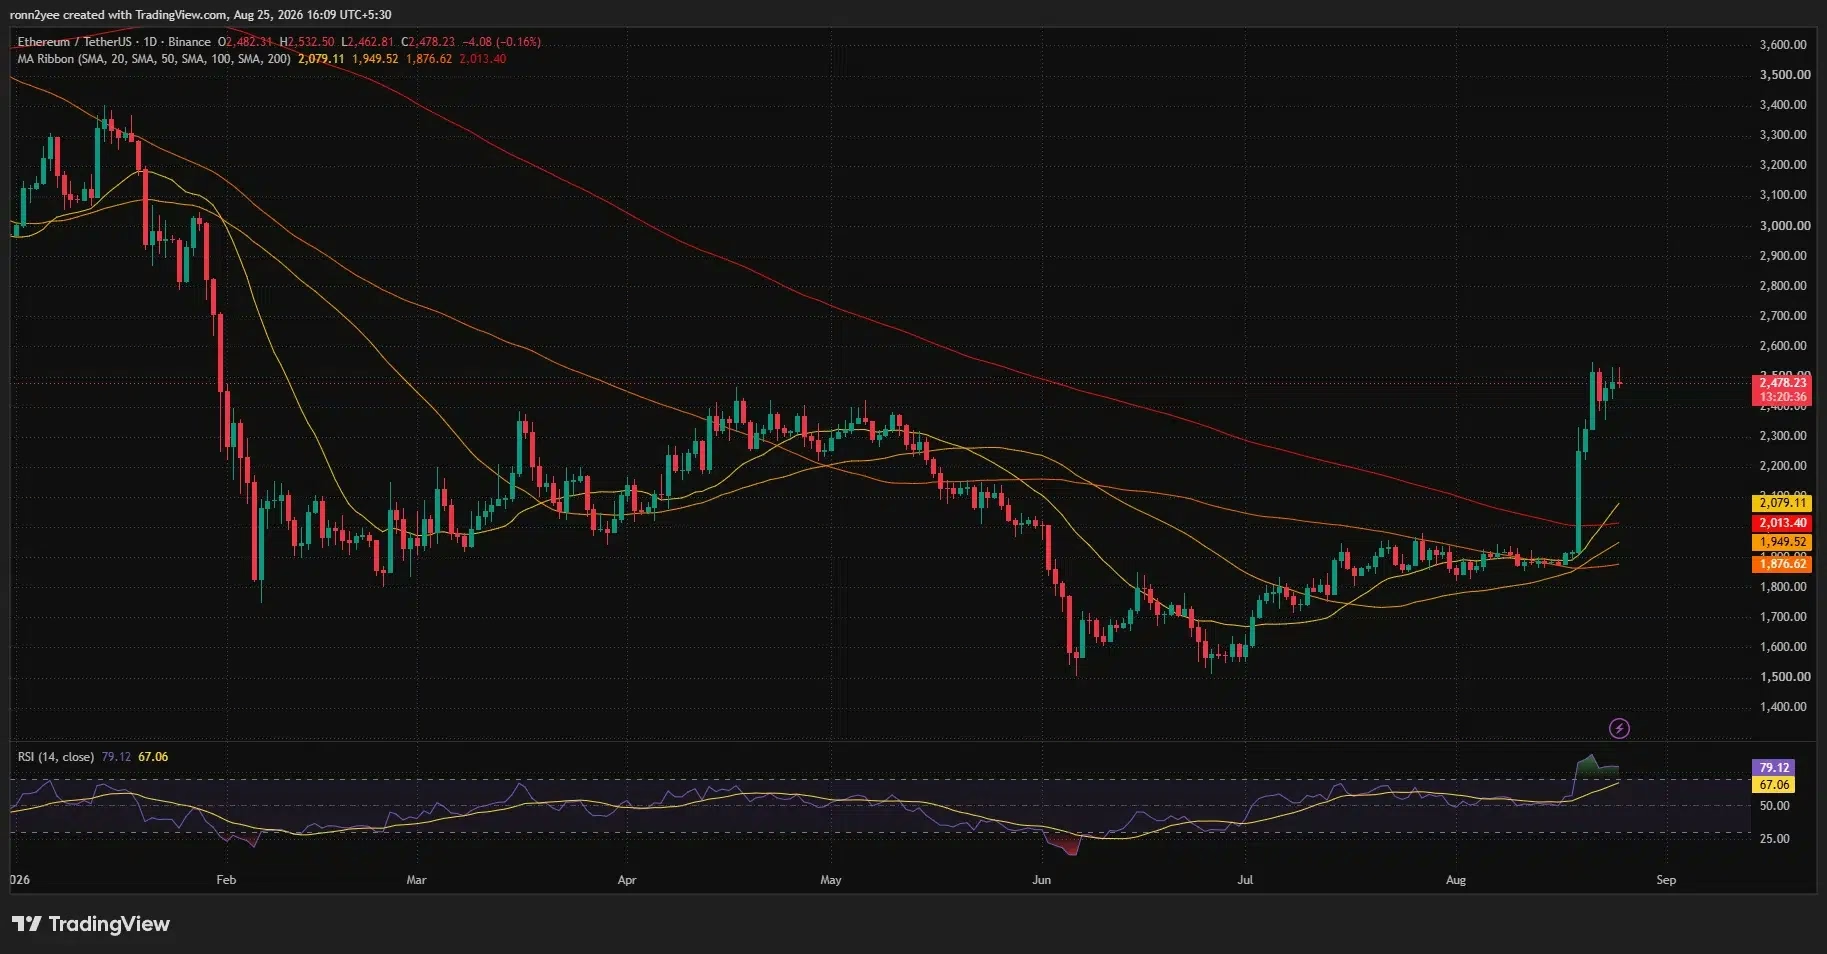
Ethereum has staged a remarkable comeback, surging approximately 30% in just seven days to approach critical resistance levels that will determine whether the cryptocurrency can extend its gains toward $3,000 or faces a significant pullback. 🚀 Trading near $2,478 as of late August 2026, ETH has captured the attention of both retail and institutional investors, but technical indicators suggest the rally may be running out of steam.
The Explosive Week That Changed Everything
The journey from $1,916 to above $2,500 represents one of Ethereum's most dramatic weekly moves in recent memory. 📈 Starting from a relatively quiet period in early August when ETH languished between $1,800 and $1,950, the breakout came suddenly and with tremendous force. Within days, Ethereum pierced through multiple psychological levels—$2,000, $2,200, and $2,400—establishing a seven-month high that caught many market participants off guard.
This wasn't merely a technical bounce. The rally demonstrated genuine market conviction, with price consolidating between $2,420 and $2,530 since August 22nd rather than retreating back to pre-breakout levels. This consolidation pattern suggests that buyers remain committed to supporting higher prices, even as sellers attempt to establish resistance.
What Triggered the Breakout?
Understanding the catalyst behind Ethereum's surge requires examining multiple market dynamics that converged simultaneously. The initial spark came from an extraordinary derivatives liquidation event that caught short sellers off-guard. Within a single 24-hour period, short positions across the crypto market experienced nearly $2.7 billion in losses, with total liquidations approaching $3 billion. 💥 Ethereum accounted for approximately $1.1 billion of these forced closures, creating a cascade of short covering that accelerated the initial advance.
While short squeezes typically provide temporary momentum, ETH's ability to retain most of these gains indicates that fundamental demand factors supported the move. This distinction matters significantly—it suggests the rally has legs beyond mere technical positioning.
Macroeconomic developments also played a supporting role. The US Treasury's August 19th announcement regarding bond buyback expansion—increasing operations on 10-to-30-year securities from $2 billion to at least $4 billion starting September 9th—created a favorable backdrop for risk assets. Long-term yields contracted following the news, with the 30-year yield moving from above 5.30% to approximately 5.19%, easing financial conditions that typically benefit growth-oriented assets like Ethereum.
Institutional Demand Validates the Rally
Perhaps most compelling for the bull case, US spot Ethereum ETFs recorded $697.2 million in net inflows during the five trading sessions through August 21st—their strongest weekly performance of 2026 and best result since early October 2025. 💼 This institutional capital injection extends well beyond the leveraged derivatives market, suggesting genuine conviction among traditional finance participants.
The parallel strength in Bitcoin ETFs, which attracted $1.918 billion over the same period, indicates that the rally reflected broad-based cryptocurrency demand rather than isolated Ethereum strength. Combined inflows across both asset classes totaled approximately $2.6 billion, demonstrating that institutional interest in digital assets remains robust despite regulatory uncertainties.
Additionally, the Securities and Exchange Commission's proposed exemptions for certain crypto-related investment contracts—including a startup exemption covering up to $5 million over four years and a fundraising route permitting up to $75 million annually—supplied positive regulatory sentiment. While incremental, these exemptions signal that regulatory agencies are exploring frameworks to accommodate crypto innovation.
Technical Conditions Suggest Caution ⚠️
Despite the bullish price action, Ethereum's technical setup displays warning signs that savvy traders cannot ignore. The daily relative strength index (RSI) has climbed to 79.12—substantially above the conventional overbought threshold of 70. This extreme reading indicates that momentum has become stretched, even if it doesn't guarantee an immediate reversal.
The signal average for the RSI has reached 67.06, demonstrating that momentum remains potent but showing early signs of deceleration. Historically, when RSI reaches these extremes during sharp trend reversals, continued upside typically requires fresh demand waves. Without new buying pressure, profit-taking becomes increasingly probable.
On the positive side, Ethereum has successfully cleared all four major moving averages—trading above the 20-day simple moving average at $2,079, the 200-day average at $2,013, the 50-day average at $1,950, and the 100-day average near $1,877. Breaking above the 200-day moving average removed one of the market's most significant technical barriers, a development that typically supports further appreciation.
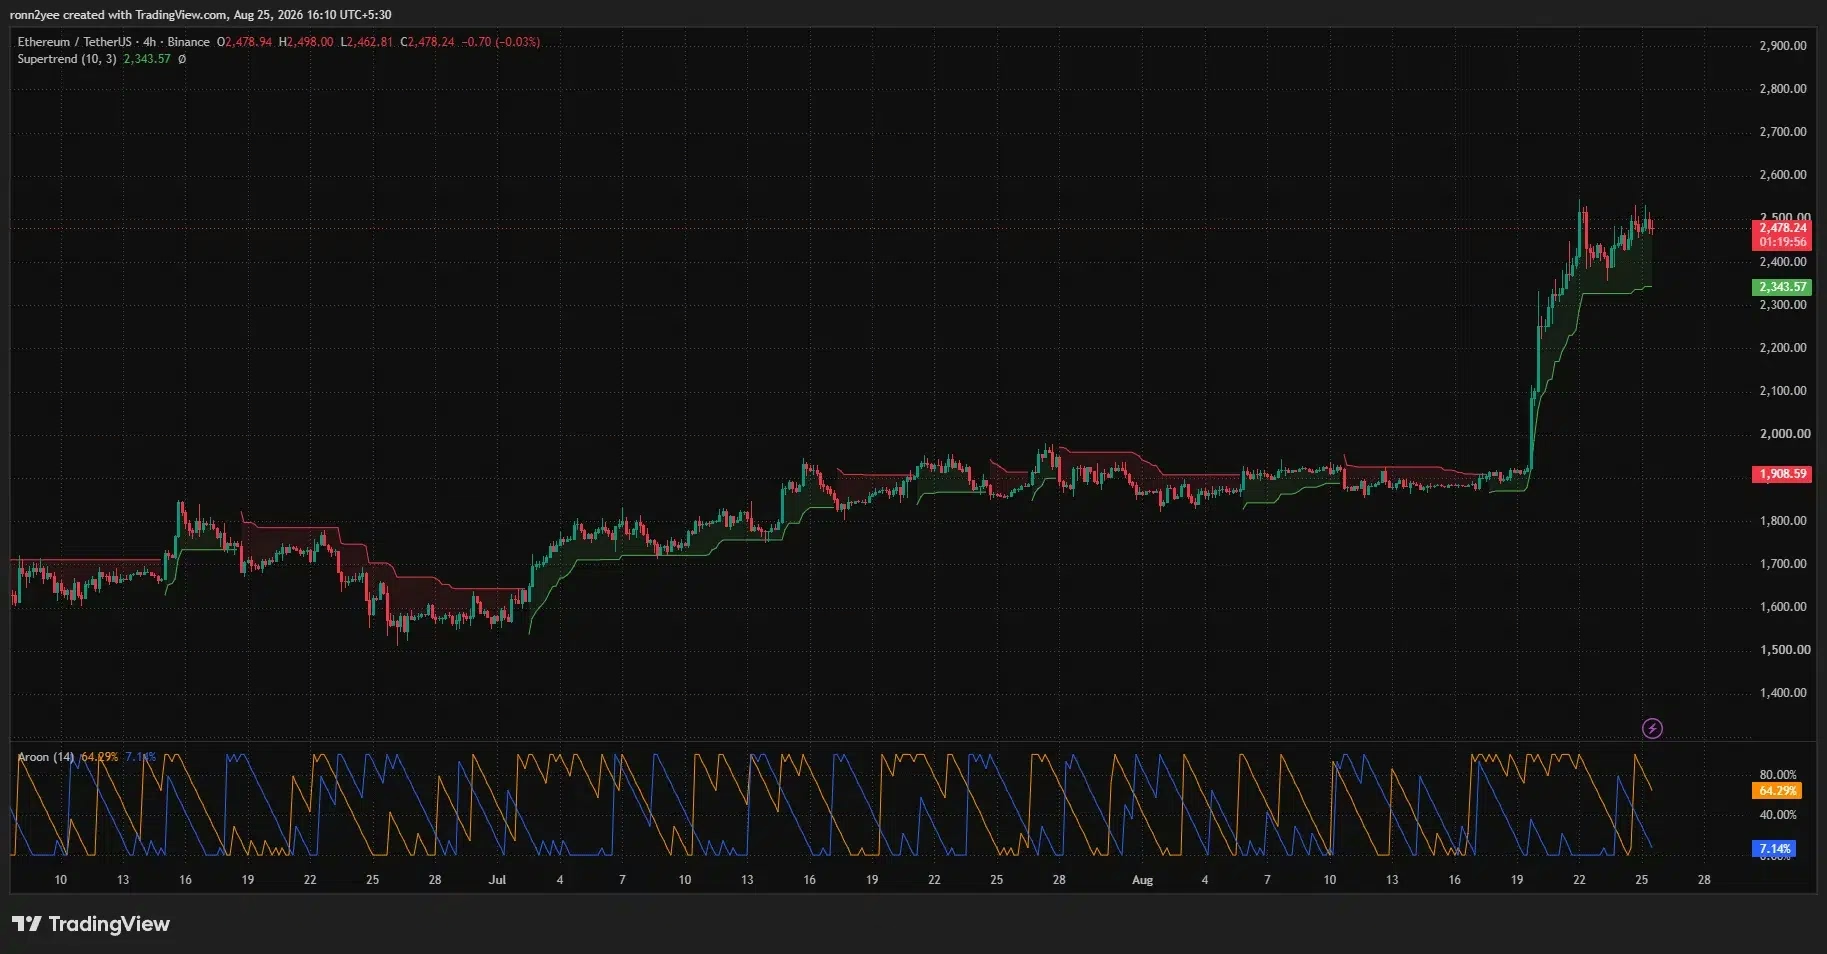
The 4-hour chart remains constructive, with Ethereum holding above its Supertrend support at approximately $2,344. The Aroon Up indicator stands at 64.29%, well above the Aroon Down value of 7.14%, confirming that recent highs retain more influence than recent lows. However, declining Aroon Up momentum points to some technical cooling—a subtle warning that the rally may be losing steam.
The Critical $2,550 Resistance Zone
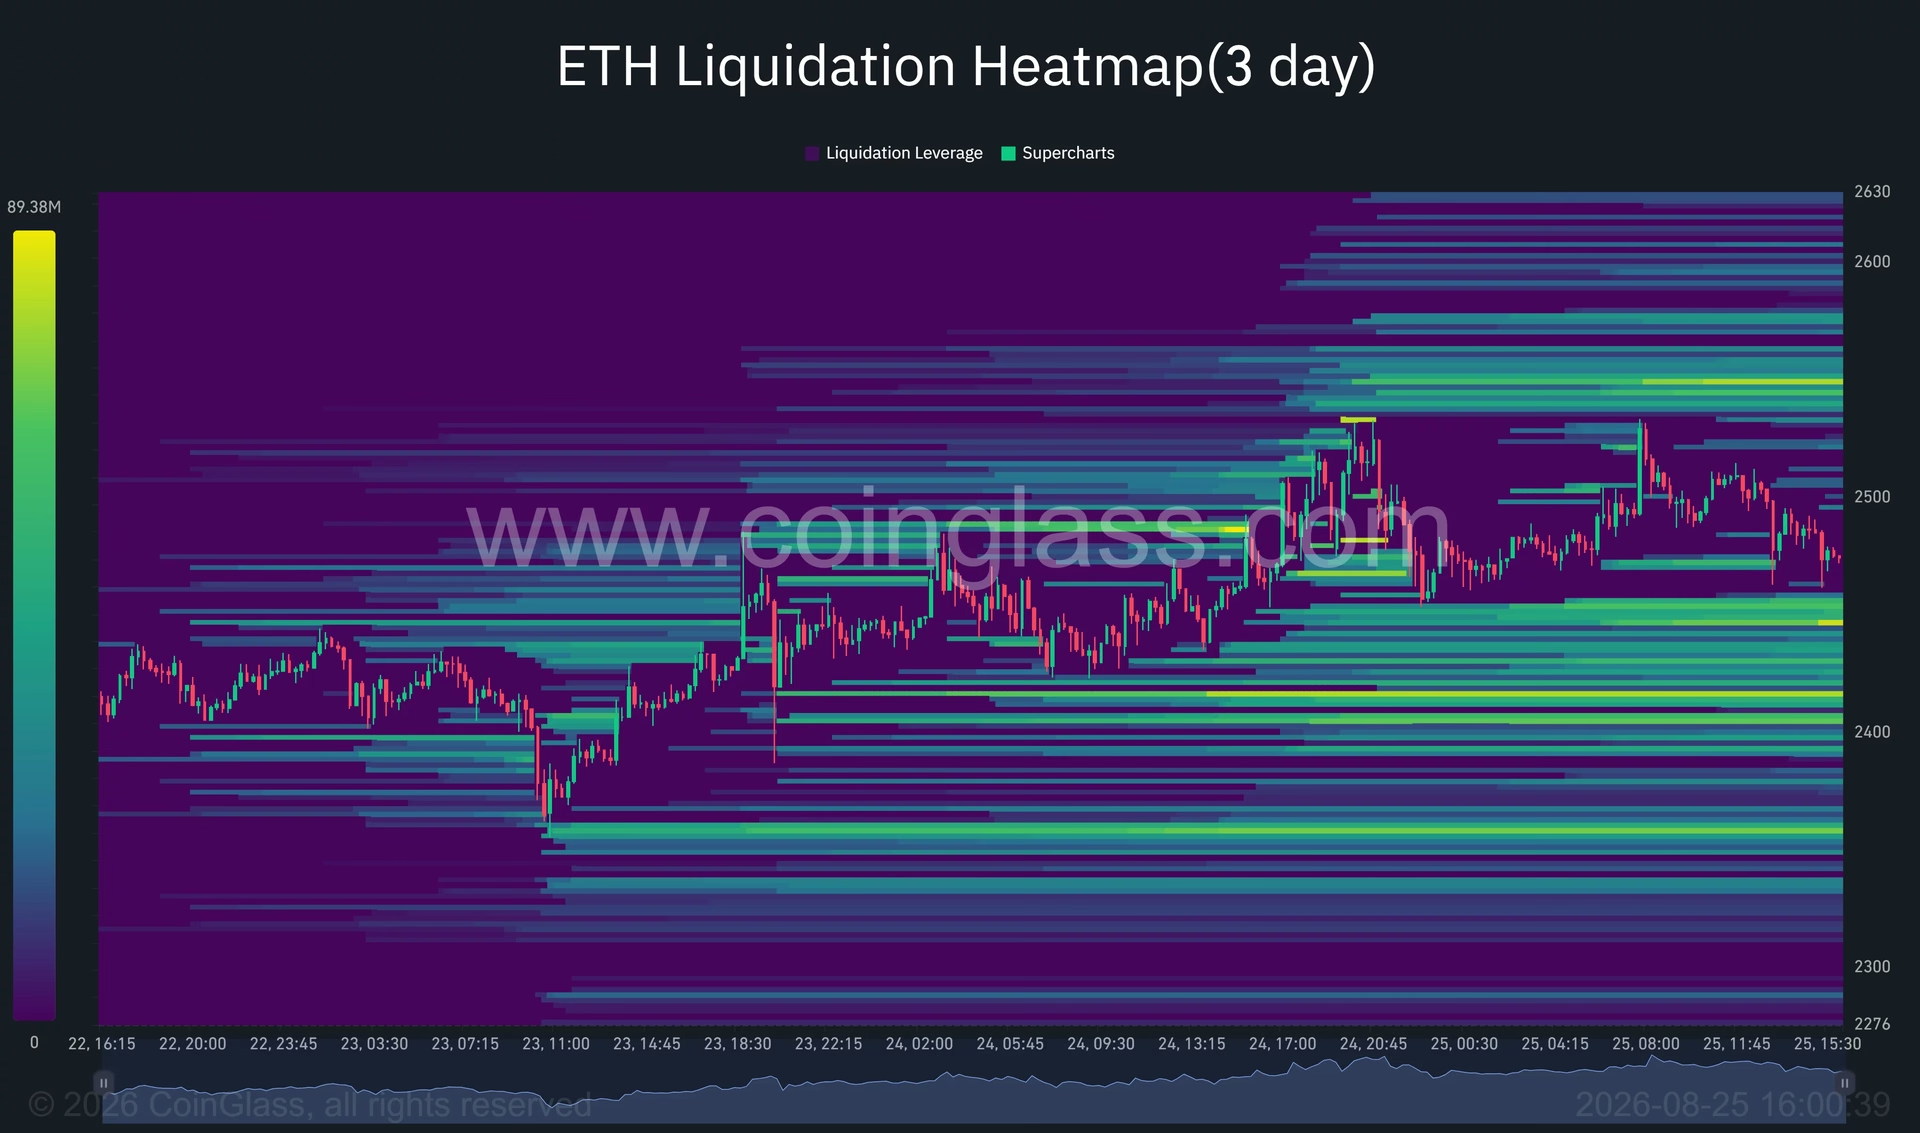
The path forward hinges on Ethereum's ability to overcome concentrated resistance between $2,500 and $2,550. CoinGlass's three-day liquidation heatmap reveals substantial leveraged positions stacked immediately above current prices, with the densest cluster positioned between $2,540 and $2,570. This concentration matters because it represents a critical decision point for the market.
Breaking through $2,550 would likely trigger additional short position closures, potentially propelling Ethereum toward $2,600 and beyond. Above that range, the daily chart shows limited recent price structure until approximately $2,700, followed by the psychologically significant $3,000 level. Many analysts view a weekly close above $2,550 as the condition necessary to support a direct move toward $3,000.
Conversely, rejection from the $2,500-$2,550 zone would likely draw price toward substantial downside liquidity concentrated between $2,410 and $2,450. Should Ethereum fail to defend these levels, the 4-hour Supertrend support at $2,344 would represent the next critical holding area. Losing $2,344 would weaken the immediate bullish structure and expose the daily moving average cluster around $2,000-$2,080.
What Traders Should Monitor
The coming days will prove decisive for Ethereum's intermediate-term trajectory. Here are the key levels and factors worth tracking:
- Immediate Resistance: $2,500-$2,550 zone with concentrated liquidations
- Extended Target: $2,700-$3,000 if resistance breaks
- Support Levels: $2,410-$2,450 (downside liquidity), $2,344 (4-hour Supertrend), $2,000-$2,080 (moving average cluster)
- Technical Indicator: Daily RSI at 79.12 warns of overbought conditions
- Macro Context: Watch for Bitcoin consolidation, which could provide breathing room for altcoins
The Bigger Picture 🔍
Ethereum's current price action reflects broader cryptocurrency market dynamics. The rally demonstrates that institutional interest remains strong despite regulatory headwinds, while the overbought technical conditions suggest that profit-taking may be imminent. The concentration of liquidations at $2,550 creates a natural flashpoint where the market will determine whether higher prices are justified.
For longer-term investors, Ethereum's ability to hold above the 200-day moving average and establish support around $2,000-$2,080 matters more than short-term price gyrations. For traders focused on the next few weeks, the $2,550 resistance and $2,344 support define the range within which meaningful decisions will be made.
Key Takeaways 💡
Ethereum's 30% weekly rally represents genuine strength, validated by institutional ETF inflows and a breakout above critical technical barriers. However, overbought daily conditions and concentrated liquidations at $2,550 suggest the rally may need consolidation before extending toward $3,000. The coming days will reveal whether buyers can overcome resistance or whether profit-taking pulls the price back toward support levels. Regardless of the immediate outcome, Ethereum's ability to attract institutional capital and break above major moving averages establishes a more constructive longer-term setup than existed during the subdued trading of early August.
You May Also Like

Market Analysis
XRP Price Falls 5% as Leverage Hits Seven-Month High
August 26, 2026

Market Analysis
Crypto Market Hits Extreme Greed: What This Means for Bitcoin
August 26, 2026

Market Analysis
Hyperliquid Price Rally: HYPE Targets $97 Amid $80 Support
August 25, 2026

Market Analysis
Bitcoin Price Dips Below $80K: RSI Signals Overbought Territory 📉
August 25, 2026