Category:
AltcoinsChainlink Price Surges on Standard Chartered's Bullish $200 Target

Chainlink Experiences Significant Rally Amid Institutional Optimism 🚀
Chainlink (LINK) has captured significant market attention following a substantial price rally driven by institutional confidence and positive technical developments. The leading oracle network token demonstrated renewed strength, breaking through critical resistance levels that had constrained its recovery throughout the summer months.
The momentum behind this altcoin surge reflects growing recognition of Chainlink's fundamental role in the broader blockchain ecosystem, particularly as the industry transitions toward greater adoption of tokenized assets and decentralized infrastructure.
Standard Chartered's Game-Changing Price Forecast 📊
A major catalyst for the recent Chainlink price movement emerged from Standard Chartered's comprehensive research initiative, which introduced the cryptocurrency to the bank's institutional investment framework. The banking giant's digital assets research division initiated coverage with an extraordinarily ambitious long-term projection, establishing a $200 price target for the end of 2030.
This forecast represents an approximately 2,200% appreciation from current trading levels, signaling the bank's conviction regarding Chainlink's value proposition over the coming years. More importantly, the research team provided a detailed roadmap of interim milestones:
- End of 2026: $13 per token
- End of 2027: $41 per token
- End of 2028: $82 per token
- End of 2029: $133 per token
- End of 2030: $200 per token
Geoff Kendrick, Standard Chartered's global head of digital assets research, grounded these projections in fundamental market developments rather than speculative sentiment. The analysis suggests that tokenized assets currently valued at approximately $340 billion could expand to $4 trillion by the end of 2028, creating exponentially greater demand for Chainlink's core services.
The Tokenization Thesis Behind Chainlink's Growth Potential 🔗
Standard Chartered's bullish outlook rests on a compelling thesis regarding the future of financial infrastructure. As traditional financial institutions increasingly embrace blockchain technology and digital asset tokenization, the demand for reliable oracle services—the critical infrastructure that connects blockchain networks with real-world data—will expand dramatically.
Chainlink currently secures more than $110 billion in oracle-dependent value, representing approximately 70% of the global market share for oracle services. This dominance extends to Ethereum specifically, where Chainlink commands over 80% of the value secured by oracle infrastructure. This commanding position provides a substantial moat against competitors and positions the network to capture a disproportionate share of future growth.
The Standard Chartered analysis projects that Chainlink's fee revenue could expand approximately 25-fold by 2030. This expansion would be driven by:
- Cross-chain asset transfers between traditional finance and decentralized networks
- Compliance infrastructure requirements for institutional participants
- Oracle data demand from tokenized real-world assets
- Expanded validator networks supporting multiple blockchain ecosystems
Price Action and Technical Breakout 📈
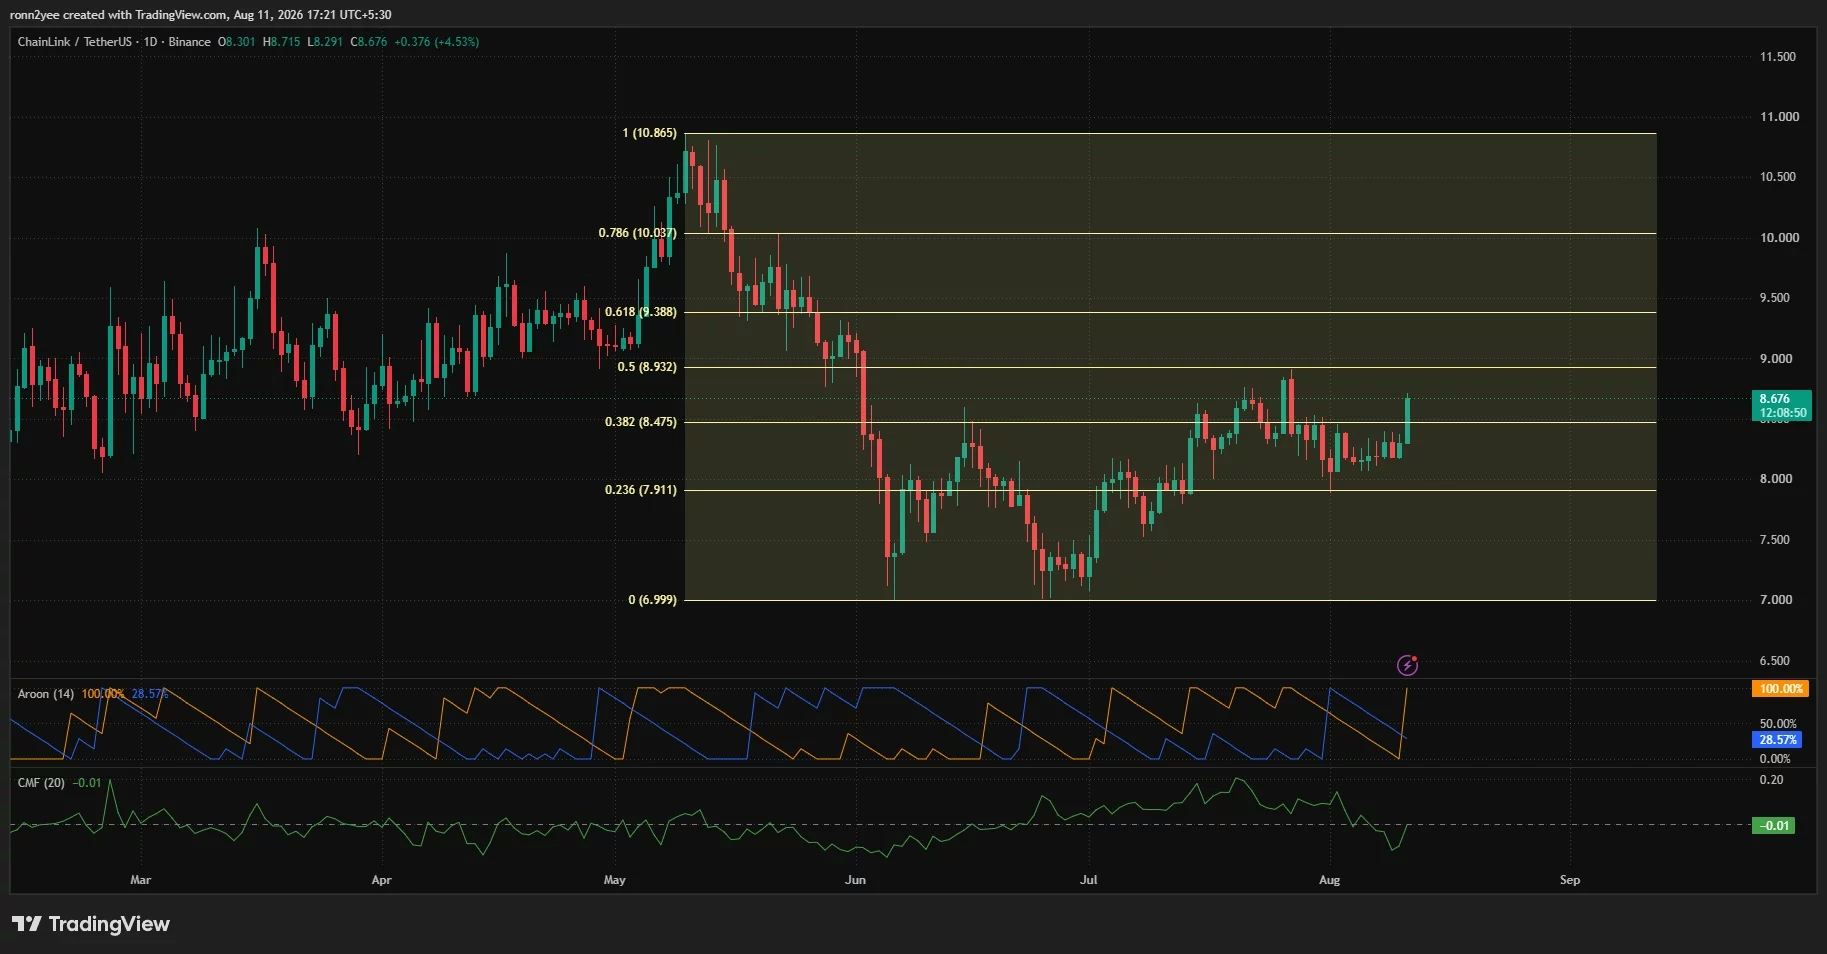
Chainlink price demonstrated immediate positive response to the institutional endorsement, rallying 4.5% to reach $8.67 within 24 hours of the announcement. This movement proved particularly significant because it pushed the token above the 38.2% Fibonacci retracement level at $8.48—a technical barrier that had consistently rejected recovery attempts since late July.
The breakout through $8.48 represents more than a simple price movement; it signals potential confirmation of a broader trend reversal on the daily timeframe. From its June lows near $7.00 to the current price levels, Chainlink has recovered approximately 24% of its losses, demonstrating genuine buying interest from market participants.
Daily technical indicators reinforce the bullish narrative. The Aroon indicator showed sharp improvement in bullish momentum, with Aroon Up reaching 100% while Aroon Down declined to 28.57%. This configuration indicates that Chainlink recently achieved a new local high while downside momentum substantially weakened—a classic sign of shifting market sentiment.
4-Hour Timeframe Confirms Near-Term Strength 💪
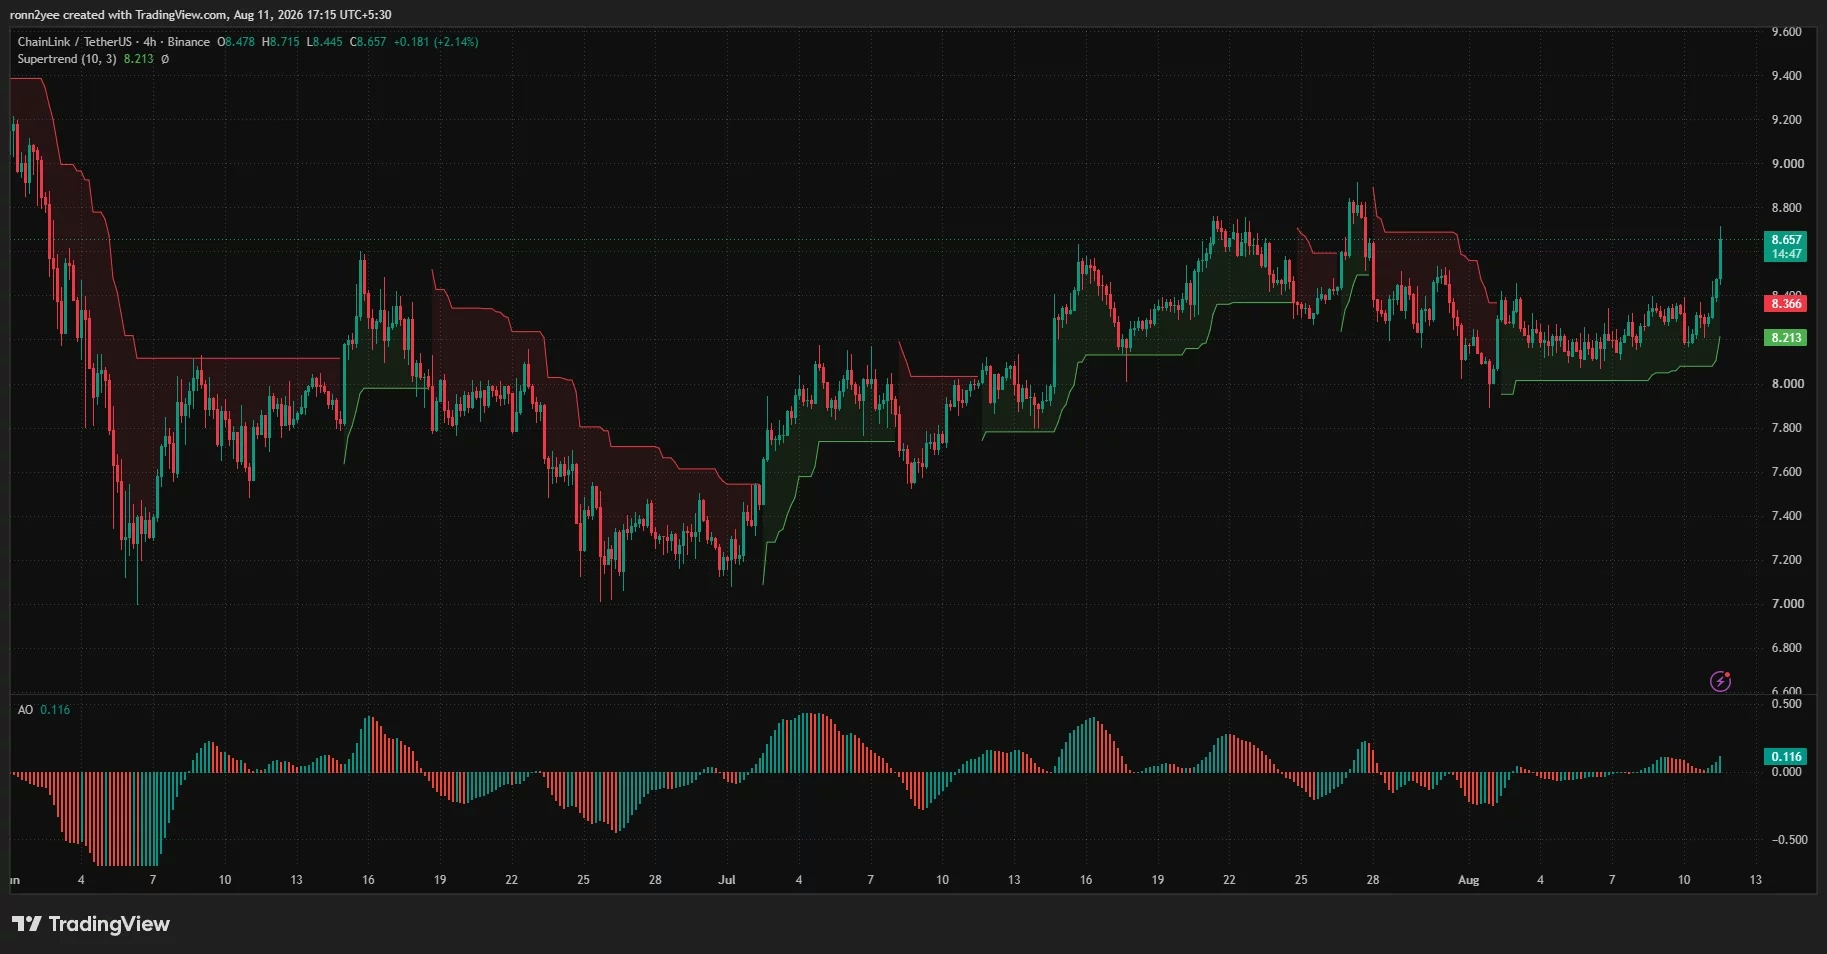
The shorter-term technical picture supports the bullish case even more convincingly. On the 4-hour chart, Chainlink successfully broke above the Supertrend resistance near $8.37, causing the indicator to flip positive and establish trailing support at $8.21. This development is significant because it creates a clearly defined support zone for traders while establishing the framework for continued upside exploration.
Price action also cleared a narrow consolidation range between $8.10 and $8.40 that had constrained trading activity since early August. Breaking above consolidation patterns often leads to accelerated moves as traders who were waiting for confirmation enter positions and stop-loss orders above the range are triggered.
The Awesome Oscillator reinforced short-term momentum expansion, rising to 0.116 and printing an expanding green bar above the zero line. This technical development demonstrates that short-term momentum is accelerating relative to the longer-term average—a powerful signal for continuation traders.
Resistance Targets and Path Forward 🎯
With the immediate breakout confirmed, traders are now focused on the next resistance zones. The most critical resistance area sits at $8.90–$8.93, which aligns with both the 50% Fibonacci retracement level and a local high identified by prominent technical analysts. Breaking above this zone would represent confirmation of a genuine trend reversal and could attract additional institutional buying.
Beyond $8.93, the daily Fibonacci chart identifies resistance at $9.39, followed by $10.04—the previous local high from earlier in the year. These levels represent meaningful psychological and technical barriers that would require sustained buying pressure to overcome.
Immediate resistance sits near $8.72, corresponding with Tuesday's intraday high. A close above this level would confirm momentum continuation and leave the $8.90–$8.93 zone as the natural next target.
Liquidation Dynamics and Volatility Considerations ⚡
Understanding the liquidation landscape proves essential for comprehending potential price movements and volatility patterns. The one-week Chainlink liquidation heatmap reveals critical information about leveraged positions in the market—positions that can trigger cascade liquidations when price moves decisively through concentration zones.
Chainlink has already moved through a dense concentration of leveraged positions around $8.45–$8.55, suggesting that short-squeeze momentum may have already partially played out. However, another significant set of liquidation bands exists above $8.70, with further short-liquidation liquidity concentrated between approximately $8.80 and $8.90.
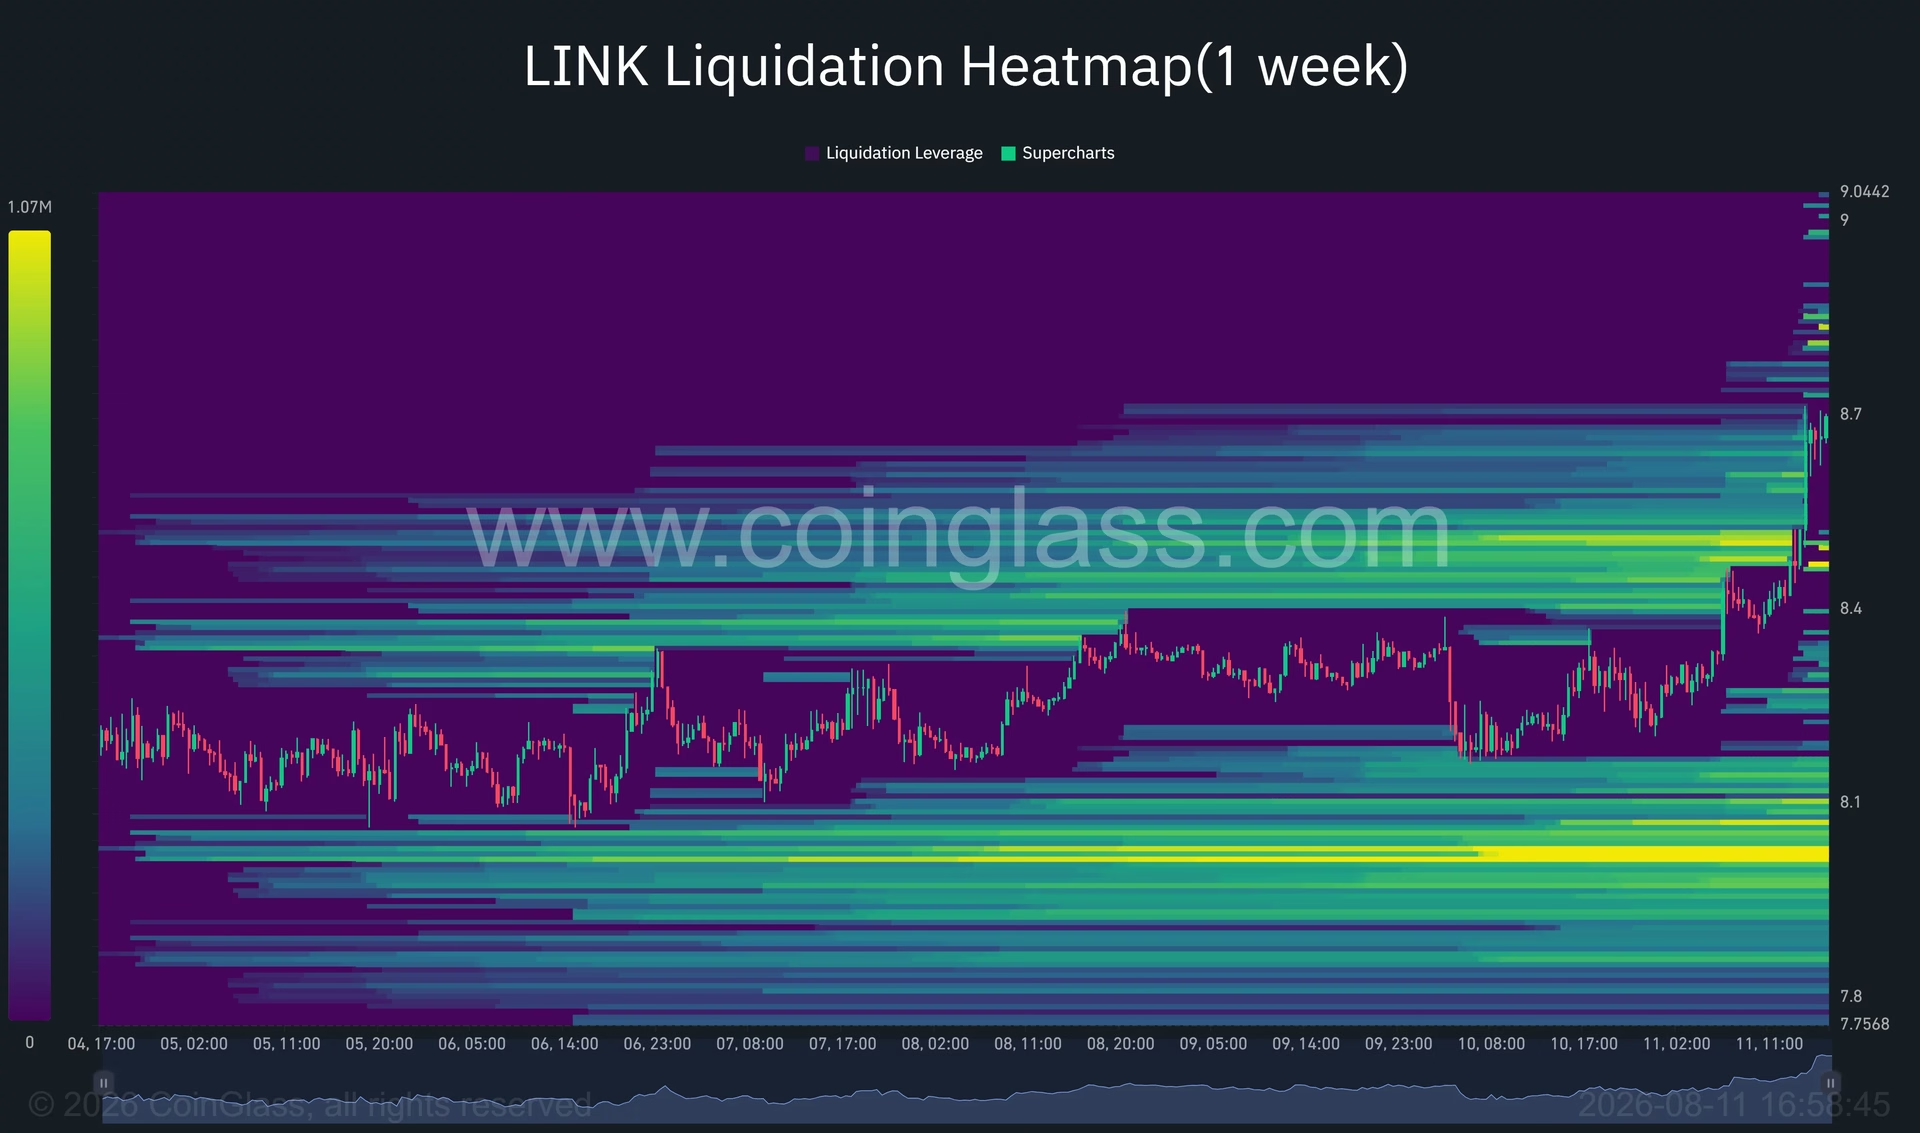
If Chainlink maintains support above $8.60, the liquidation positions above $8.70 could provide substantial fuel for another short squeeze toward the $8.93 technical target. Conversely, the largest visible liquidation cluster on the downside sits near $8.00–$8.05, meaning a failed breakout and decline below $8.21 could accelerate sharply as leveraged long positions are forcibly closed.
This dynamic creates a scenario where volatility expands as price approaches these liquidation zones, particularly if trading volume remains elevated. Institutional traders and algorithms actively monitor these levels, positioning accordingly to capitalize on predictable cascade liquidation patterns.
Whale Accumulation and Exchange Outflows 🐋
Beyond technical factors, on-chain metrics provide additional evidence of institutional interest in Chainlink. Exchange outflows have accelerated notably, with more than 15.7 million tokens reportedly leaving centralized exchanges over a recent one-month period. This reduction of approximately 12% in exchange-held supply carries significant implications for price stability and future upside potential.
When tokens leave exchanges, the immediately available selling supply decreases, reducing the liquidity available for rapid price declines. While exchange outflows don't necessarily confirm accumulation intentions—holders may be transferring tokens to self-custody for security purposes—they do suggest confidence in the asset's future direction.
During early August, approximately 1.26 million LINK tokens (valued at over $10 million) left centralized platforms in a single day, further demonstrating the intensity of this accumulation pattern. Large holders and institutional participants increasingly prefer self-custody arrangements, a behavioral shift that typically precedes significant price appreciation.
Support Levels and Downside Risk Management 🛡️
While the near-term technical picture appears constructive, prudent traders maintain awareness of critical support levels that would invalidate the bullish setup if broken. The Supertrend support at $8.21 represents the first line of defense, having been freshly established by the 4-hour breakout.
If Chainlink declines below $8.21, the former Supertrend resistance at $8.36 and the $8.48 Fibonacci level would come back into focus as buyers attempt to defend the breakout. A more substantial decline below $8.48 would threaten the entire technical structure, potentially exposing the token to $7.91 (the daily chart's 23.6% Fibonacci level).
The $8.00 psychological level represents another important support zone, particularly if broader cryptocurrency market conditions deteriorate. This round number often attracts technical traders' attention and could serve as a final accumulation zone before any deeper corrections.
Implications for the Broader Oracle Infrastructure Market 🌐
Chainlink's recent strength carries implications that extend beyond the individual token to the entire oracle infrastructure sector. As blockchain adoption accelerates and institutional participation increases, the criticality of reliable oracle services becomes increasingly apparent. Chainlink's market dominance positions the network to capture the majority of this growing demand.
Competing oracle solutions continue to develop, but Chainlink's first-mover advantage, established security track record, and deep integration with major blockchain ecosystems create substantial barriers to displacement. The network's ability to facilitate cross-chain communication and provide tamper-proof data feeds has become essential infrastructure for the evolving blockchain economy.
Standard Chartered's institutional endorsement validates what many industry participants have long recognized: oracle infrastructure represents one of the most critical and undervalued components of blockchain infrastructure. As tokenized assets proliferate across traditional finance and decentralized networks, this infrastructure becomes increasingly essential.
What Investors Should Monitor Going Forward 👀
Market participants tracking Chainlink's development should focus on several key metrics and developments:
Technical Levels: Monitor the $8.90–$8.93 resistance zone closely. A decisive close above this area would confirm trend reversal and could trigger accelerated upside movement.
On-Chain Metrics: Continue tracking exchange inflows and outflows, as well as large holder accumulation patterns. Sustained outflows combined with rising prices suggest institutional confidence.
Tokenization Adoption: Watch for announcements regarding major institutions tokenizing real-world assets on public blockchains. Each significant adoption represents validation of Standard Chartered's thesis.
Competitive Developments: Monitor competing oracle solutions and cross-chain protocols that might challenge Chainlink's market dominance.
Regulatory Environment: Track regulatory developments regarding oracle infrastructure and blockchain technology, as favorable regulation could accelerate institutional adoption.
Conclusion: A Pivotal Moment for Chainlink 🎬
Chainlink stands at a potentially pivotal moment in its development trajectory. The combination of institutional endorsement from Standard Chartered, constructive technical developments, accumulating whale activity, and the fundamental thesis regarding tokenized assets creates a compelling case for continued appreciation.
The $8.90–$8.93 resistance zone represents the immediate battleground where bulls must prove their conviction. A successful breakout through this area would confirm the technical reversal and potentially attract additional institutional capital seeking exposure to oracle infrastructure.
While the $200 price target for 2030 remains a long-term forecast rather than a guaranteed outcome, the underlying thesis regarding blockchain infrastructure's criticality appears increasingly sound. As traditional finance continues its inevitable migration toward blockchain-based systems, Chainlink's role as the primary oracle solution positions the network to capture substantial value creation.
For investors and traders, the current environment presents both opportunity and risk. The technical setup appears constructive, but maintaining disciplined risk management around clearly defined support levels remains essential. The cryptocurrency market's volatility demands that participants maintain realistic expectations while remaining alert to both bullish and bearish scenarios.
The coming weeks will prove critical in determining whether this rally represents the beginning of a sustained uptrend or a temporary relief bounce within a larger consolidation pattern. Monitoring the key technical levels, on-chain metrics, and broader market developments will provide essential context for understanding Chainlink's path forward.
You May Also Like

Altcoins
NCT Price Surge 200% on Upbit KRW Listing
August 26, 2026

Altcoins
WBT Reaches New All-Time High as Crypto Infrastructure Turns Institutional
August 26, 2026

Altcoins
Pi Network's August 24 Pricing Shakeup: End of Subsidized App Building
August 25, 2026

Altcoins
XRP Undervalued? Seven Spot ETFs & $1.4B Flows Tell
August 25, 2026