Category:
EthereumEthereum Nears $1,600 Breakout Point
Ethereum's market dynamics have always been a subject of intense scrutiny. As the price of Ethereum (ETH) edges closer to the $1,600 resistance level, traders and investors are on high alert, anticipating potential market movements.
The Current Market Situation ⚖️
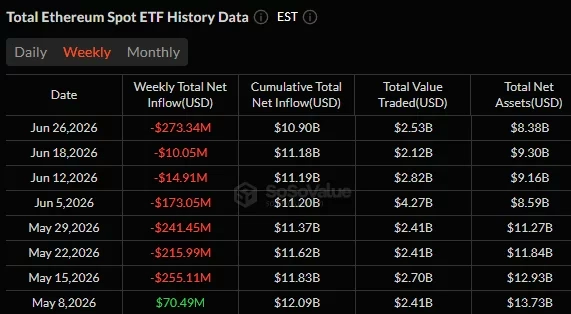
Ethereum has been fluctuating between $1,550 and $1,600, a range it has maintained for several days. This sideways movement comes amid significant selling pressure, particularly from spot Ethereum exchange-traded funds (ETFs). The market witnessed a net outflow of $273 million from these funds for the week ending June 26, with BlackRock’s ETHA fund contributing significantly to this trend.
Technical Analysis: Resistance and Support Levels 📊
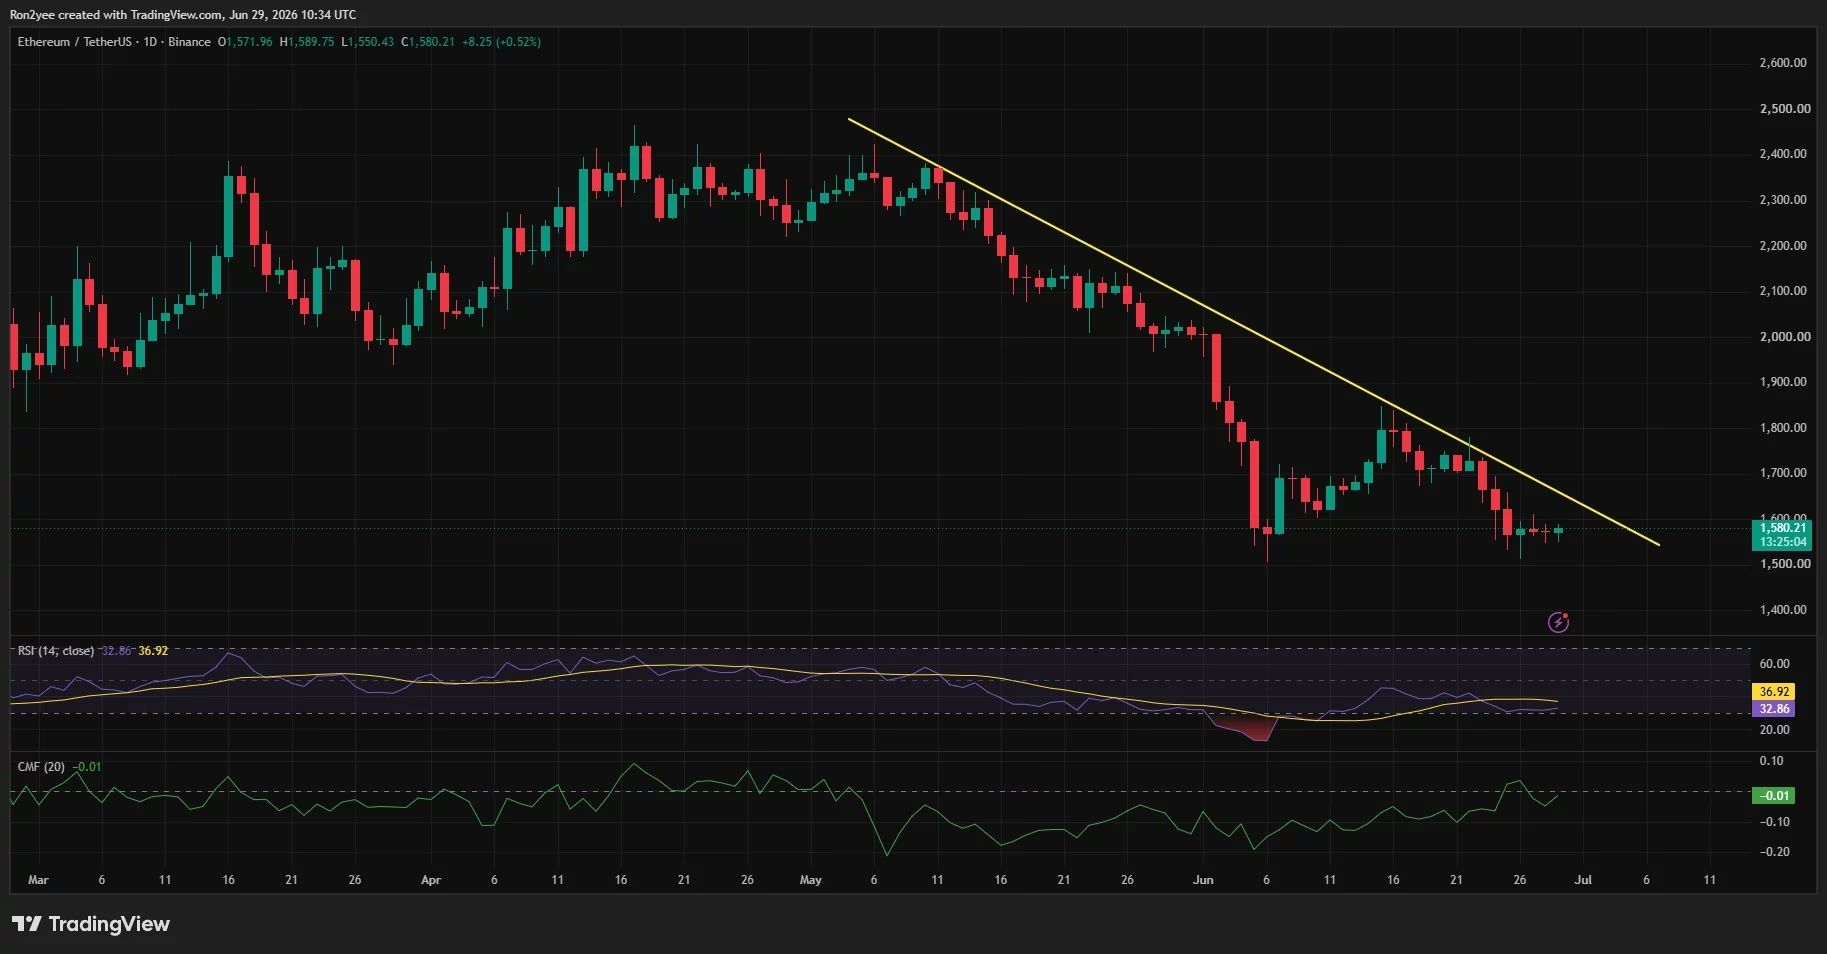
Ethereum faces a critical resistance zone between $1,600 and $1,750, while $1,500 serves as a crucial support level. The daily charts highlight a descending trendline that has been a significant barrier since mid-May. Technical indicators, such as the Supertrend and Fibonacci retracement levels, further emphasize the challenge of breaking past these levels.
Institutional Moves and Market Sentiment 💼
Despite these challenges, there are bullish signals on the horizon. Notably, SharpLink Gaming has made a significant move by purchasing nearly 40,000 ETH, worth approximately $62.4 million. This suggests growing institutional interest, which could provide a floor under current price levels.
However, macroeconomic factors remain a concern. Persistent U.S. inflation and a cautious Federal Reserve have kept treasury yields high, limiting liquidity available for higher-risk assets like Ethereum. Moreover, Bitcoin’s performance and dominance in the crypto market have diverted some capital flows away from Ethereum.
Derivatives Market and Liquidation Zones ⚡
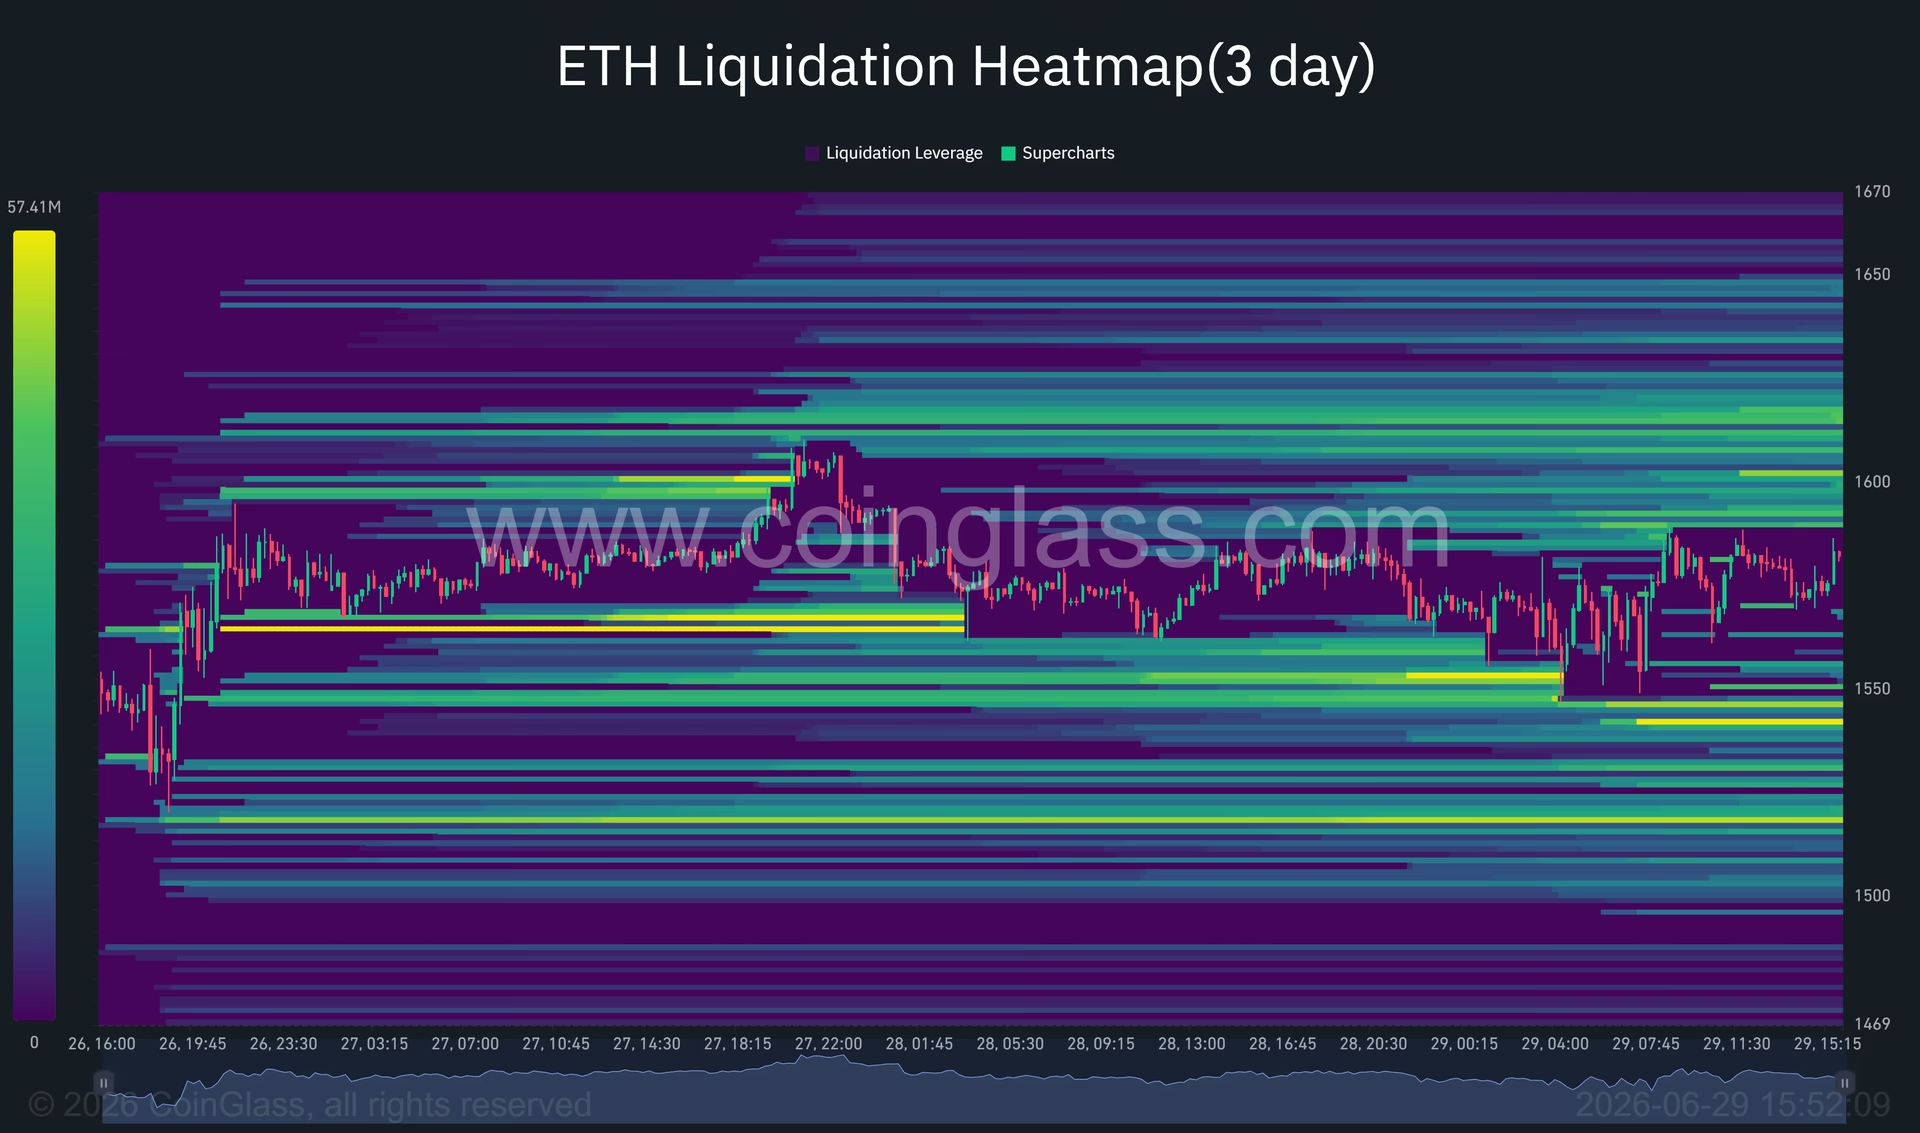
The derivatives market presents its own set of challenges and opportunities. CoinGlass liquidation heatmaps indicate dense leveraged positions around $1,610 to $1,630. A breakout above this range could trigger short liquidations, potentially accelerating Ethereum's momentum towards the $1,700 to $1,750 region.
Looking Ahead: Potential Scenarios 🔭
For Ethereum to sustain a bullish trajectory, it must overcome several technical barriers sequentially. A breakthrough above the descending trendline would expose further resistance levels, notably around $1,644 and the psychological $1,750. Conversely, failing to hold the $1,500 support could lead to increased selling pressure and a potential decline in Ethereum's valuation.
Given the current market conditions and technical indicators, Ethereum’s price movement in the near term will likely hinge on external economic factors and internal market developments, including any shifts in ETF flows and institutional buying patterns.
Conclusion: Navigating the Crypto Waters 🌊
As Ethereum nears a pivotal breakout point, traders and investors must stay vigilant. The interplay between technical resistance levels and institutional activities will be crucial in determining Ethereum's next move. The crypto market, with its inherent volatility, presents both risks and opportunities, requiring a balanced approach to investment strategies.
In conclusion, while the path ahead for Ethereum is fraught with challenges, it also holds the potential for substantial gains if the market conditions align favorably. As always, informed decision-making based on thorough analysis remains key in navigating these turbulent crypto waters.