Category:
AltcoinsHYPE Price Targets $57.30 Amid Q2 Buyback Rally
The cryptocurrency market has witnessed a compelling recovery narrative unfold as Hyperliquid's native token demonstrates resilience following strategic capital allocation decisions. Understanding the mechanics behind this rebound offers valuable insights into how protocol revenue and token buyback programs can influence digital asset valuations in the increasingly competitive decentralized finance landscape.
🚀 HYPE's Remarkable Recovery From Support Levels
Hyperliquid (HYPE) has captured market attention with a notable ascent from its early-August lows, trading near $56.80 and establishing momentum that suggests institutional and retail participants are reassessing the token's value proposition. The token achieved a 2.5% gain within a single 24-hour period, while maintaining approximately 3.7% weekly appreciation—metrics that indicate sustained buying interest rather than speculative volatility.
The journey from the $51.20 support zone to current levels represents an 11% recovery within just days, demonstrating how quickly sentiment can shift when fundamental catalysts align with technical confirmation. This rebound holds particular significance because it occurred against a backdrop of broader market uncertainty, suggesting that HYPE-specific developments are driving independent price action.
💰 Q2 Buybacks: The Engine Behind the Rally
The catalyst propelling HYPE's recovery becomes immediately apparent when examining Hyperliquid's second-quarter financial performance. The protocol generated an impressive $169 million in quarterly revenue, with an extraordinary $141 million allocated directly toward HYPE token buybacks—representing an 83.4% allocation rate that underscores management's commitment to shareholder value.
This aggressive buyback strategy operates on a fundamental principle: by systematically reducing circulating token supply through protocol revenue deployment, Hyperliquid creates recurring demand pressure that supports price floors. However, the sustainability of this approach hinges critically on whether the platform can maintain robust trading volumes and fee generation sufficient to offset natural token sales and future supply expansion.
Notably, Hyperliquid surpassed a remarkable milestone by accumulating $1 billion in cumulative protocol revenue during Q2—a testament to the platform's growing market relevance and user adoption trajectory. This achievement places Hyperliquid among the most revenue-generative blockchain protocols, rivaling established platforms in terms of economic output.
🌍 Real-World Assets Reshape Trading Dynamics
A particularly intriguing development supporting HYPE's bullish narrative involves the explosive growth in real-world asset (RWA) perpetual contracts. During Q2, HIP-3 RWA perpetual contracts generated a staggering $213 billion in trading volume, accounting for 32.2% of total platform activity—a remarkable achievement considering this product category remains nascent within the broader cryptocurrency ecosystem.
RWA trading contributed 6.6% of total quarterly revenue, demonstrating that tokenized commodities, equities, and traditional-market products are transitioning from theoretical concepts to genuine revenue drivers. This diversification beyond pure cryptocurrency perpetual futures positions Hyperliquid as a bridge between traditional finance and decentralized markets—a strategic positioning that could unlock entirely new user cohorts and institutional capital flows.
The significance of this pivot cannot be overstated: platforms that successfully tokenize traditional assets stand to capture market share from conventional derivatives venues, creating exponential growth potential that transcends crypto-native trading communities.
📊 Technical Setup Points Toward $57.30 Resistance
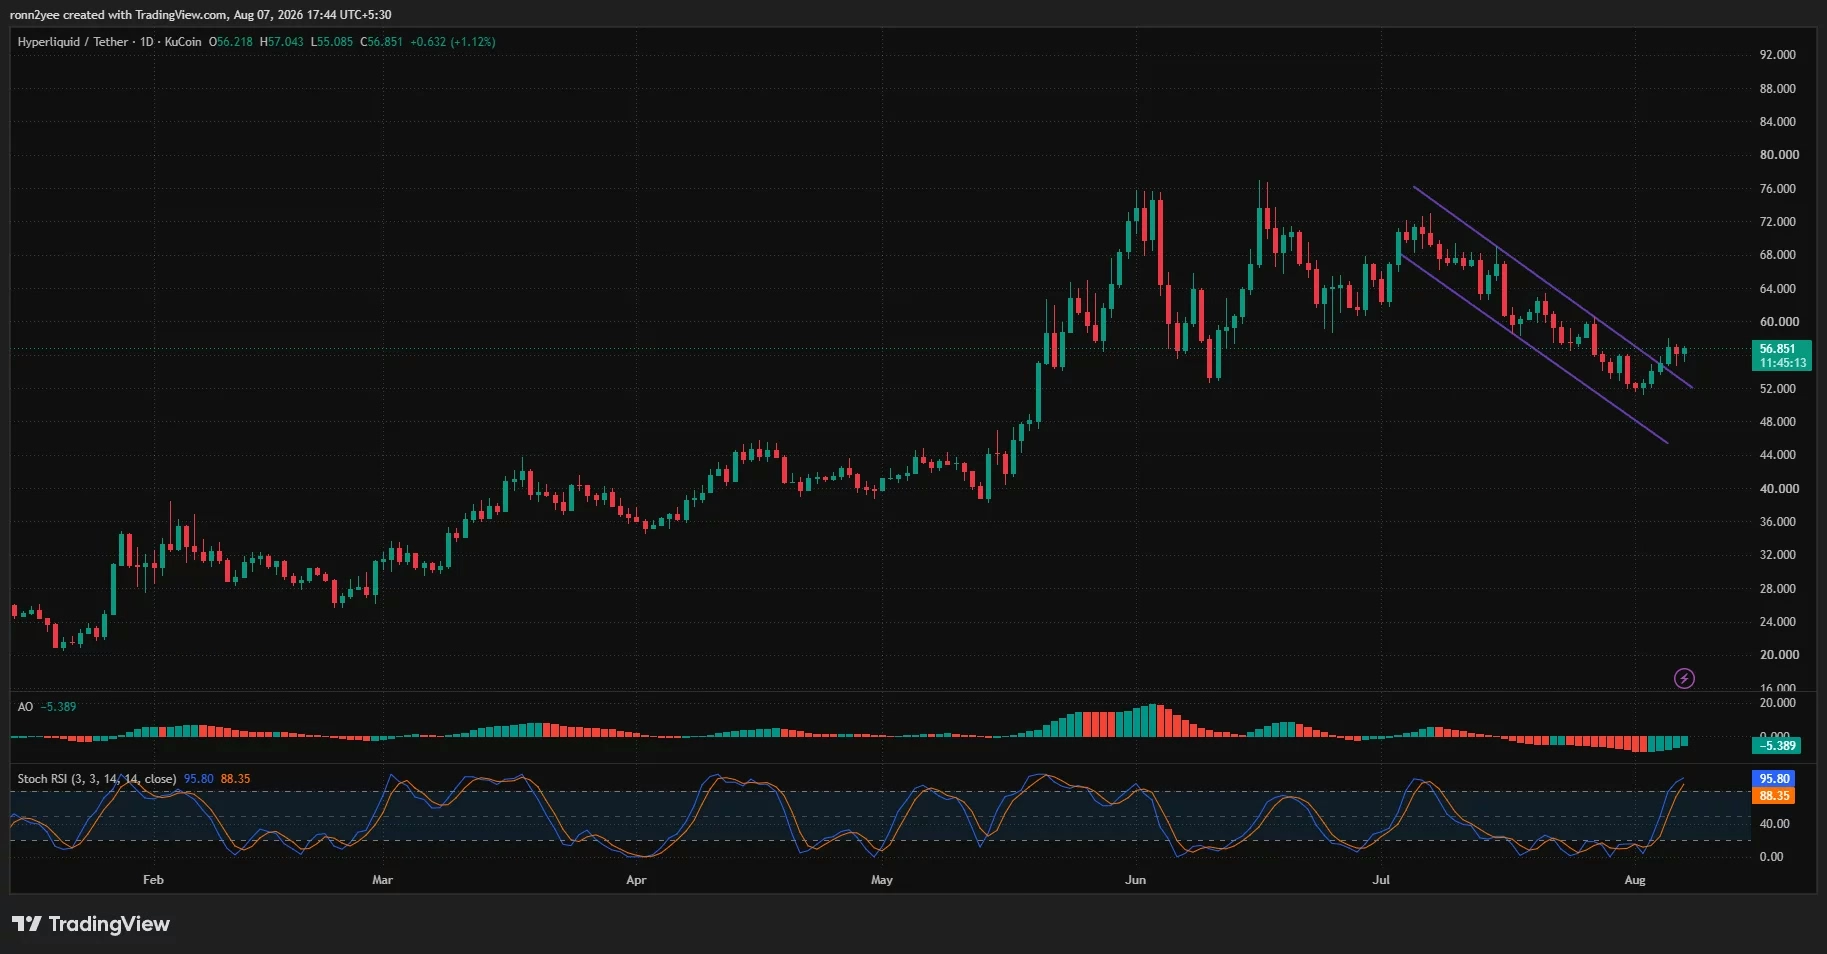
From a technical perspective, HYPE's price action reveals a compelling setup that suggests the $57.30 level represents a critical inflection point. The daily chart exhibits HYPE attempting to break above a descending channel that has constrained price movement since early July—a pattern that, if successfully penetrated, would signal a transition from correction to recovery.
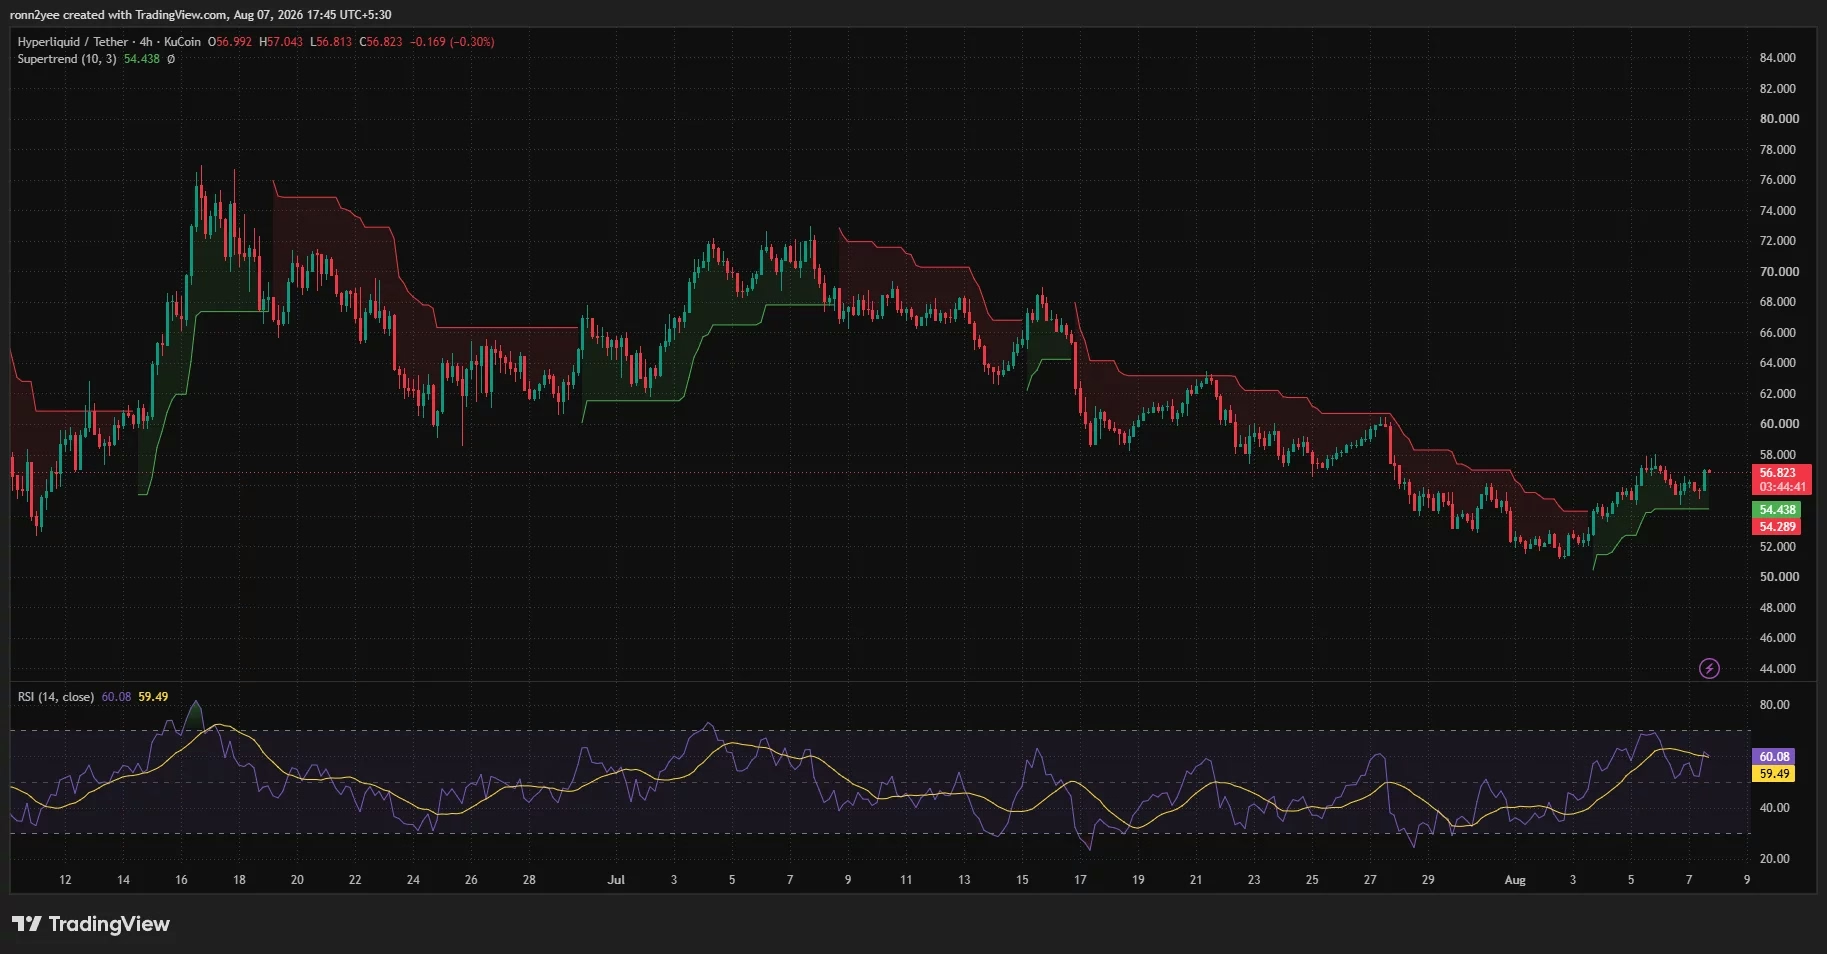
A sustained daily close above $57 would meaningfully strengthen the bullish breakout thesis, potentially catalyzing accelerated buying through technical fund algorithms and algorithmic trading systems. The 4-hour timeframe demonstrates HYPE establishing higher lows after successfully defending the $51–$52 support zone, while price has moved above the Supertrend indicator, which currently provides dynamic support near $54.44.
The 4-hour relative strength index stands at 60.08, marginally above its signal average of 59.49—indicating improving buying pressure without entering overbought territory on shorter timeframes. This balanced reading suggests room for additional upside before momentum exhaustion becomes a concern.
⚠️ Liquidation Clusters Define Near-Term Boundaries
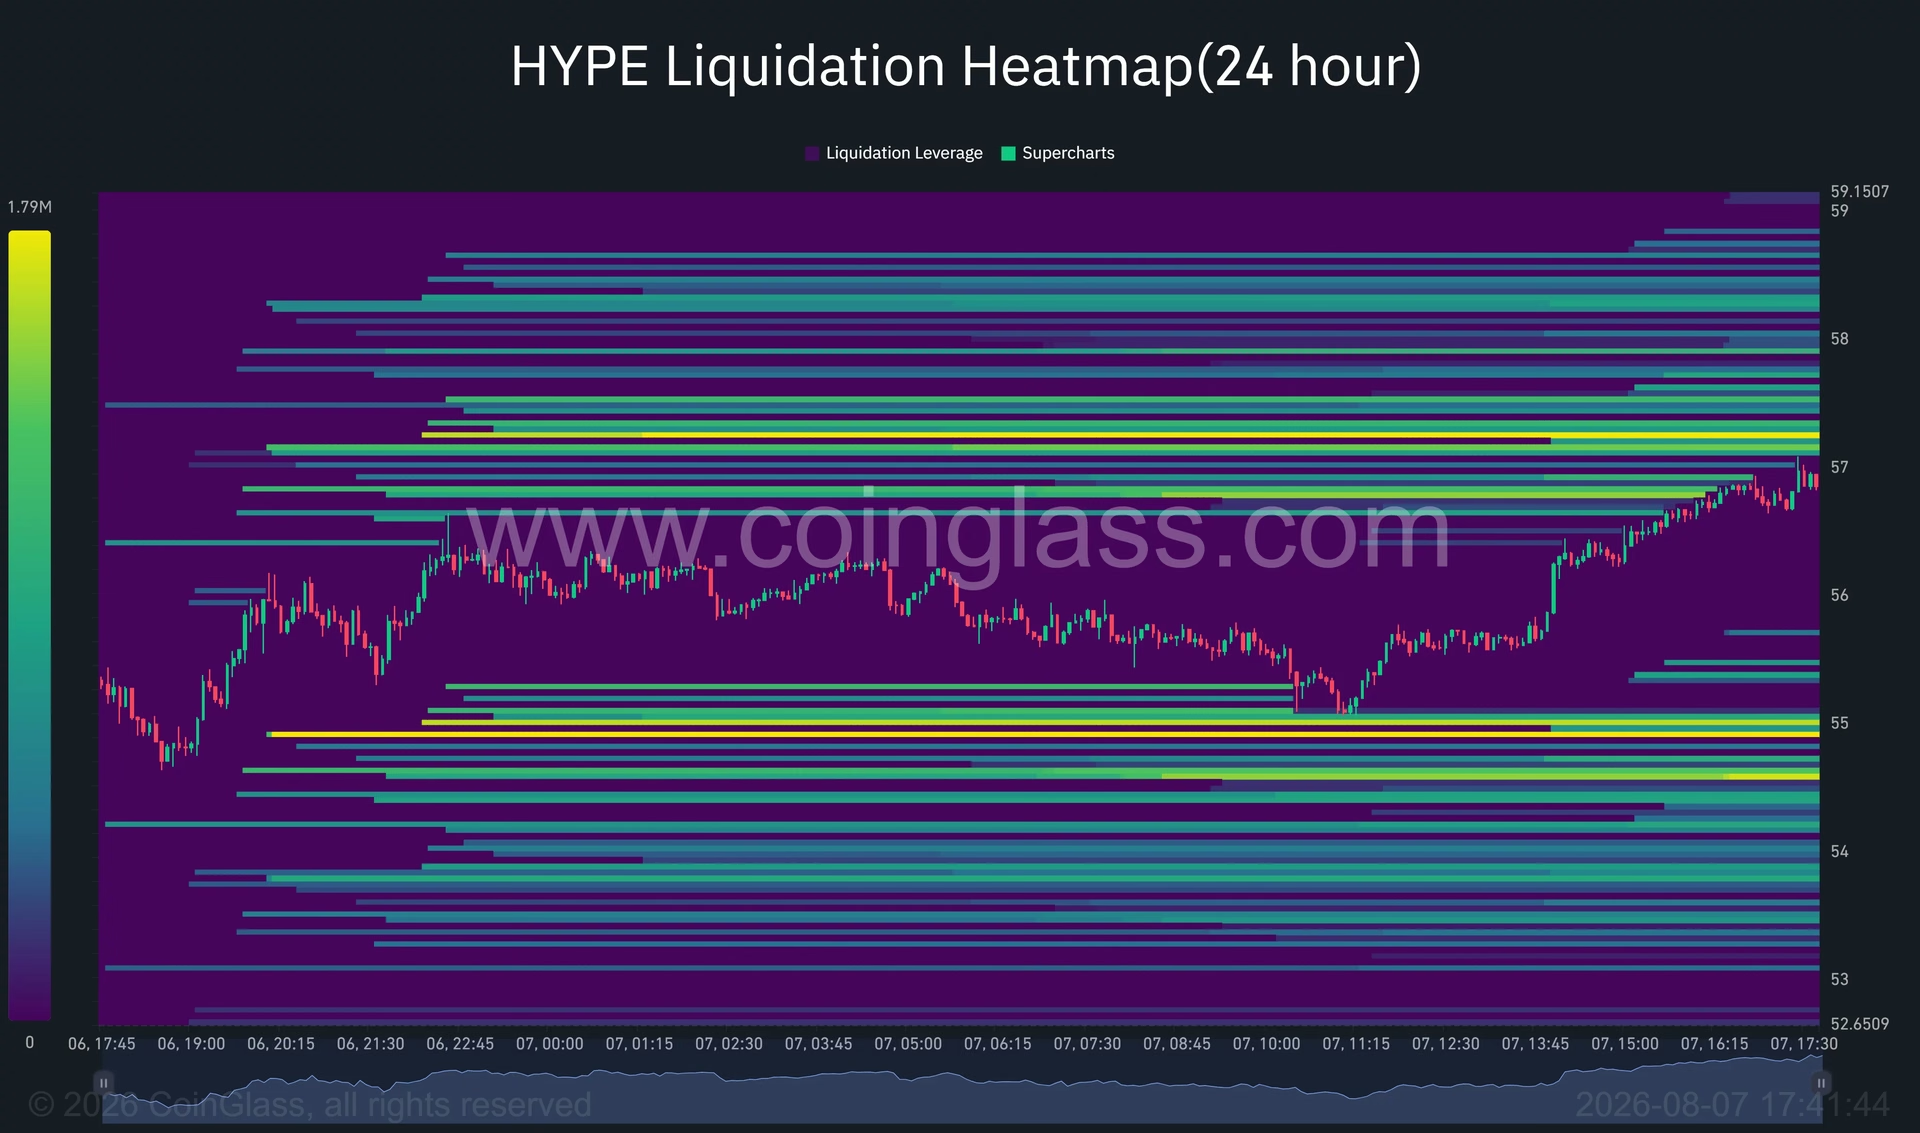
Critical liquidation analysis reveals that the $57.20–$57.35 zone contains the largest nearby liquidity concentration above current market prices. These clustered liquidations represent a double-edged sword: successfully penetrating this zone could trigger leveraged short position closures, potentially propelling HYPE toward $58 and $60 through cascading buybacks.
Conversely, rejection at this resistance would likely result in consolidation or pullback toward the $54.90–$55 support cluster. Breaking below that secondary zone could accelerate declines toward the 4-hour Supertrend support at $54.44, with subsequent targets at $52 and the recent low near $51.
🔄 Momentum Indicators Flash Mixed Signals
The Awesome Oscillator remains negative at -5.39, indicating that broader momentum structure has not fully transitioned to bullish positioning. However, histogram bars have shifted higher, signaling that bearish momentum is progressively weakening—a nuanced reading suggesting accumulation phase dynamics rather than distribution.
The Stochastic RSI presents a more immediate warning signal, with its two lines positioned at 95.80 and 88.35—deep within overbought territory. While overbought conditions don't guarantee immediate declines, they meaningfully increase the probability of consolidation or tactical pullbacks before additional advances materialize.
📈 Analyst Perspectives Reveal Divergent Scenarios
Crypto market participants maintain notably different outlooks regarding HYPE's trajectory. Respected trader Altcoin Sherpa suggests the token may be constructing a bottom within its current range, though outcomes remain contingent upon broader market conditions. His analysis identifies $50 as the critical level to monitor, with potential capitulation toward the low-to-mid-$40 range if that floor breaks.
Despite near-term caution, Sherpa maintains longer-term constructive positioning on HYPE, indicating confidence in the protocol's fundamental value proposition beyond current price cycles.
Conversely, HypeDojo offers a significantly more bullish scenario, comparing the recent $51.50 bottom with HYPE's earlier rebound from $52.50 that ultimately reached the June record near $76.70. This analyst projects potential movement toward $80 by August's conclusion—a target requiring HYPE to navigate multiple resistance zones at $60, $64, $68, and the previous record around $76.70.
Achieving such ambitious targets would likely require price advancement in non-linear fashion, given overbought daily Stochastic RSI readings that suggest consolidation periods between breakout attempts.
🏦 Institutional Headwinds and Regulatory Competition
JPMorgan's recent analysis identifies emerging risks to HYPE's investment product momentum, noting that inflows into HYPE-linked products weakened after robust participation during May and June. A reported 12-session outflow streak accumulated approximately $29.8 million through early August—a modest absolute figure but potentially significant as a sentiment indicator.
The bank also highlights competition from regulated derivatives and prediction-market platforms, with particular relevance in the United States where regulatory approval for perpetual-style contracts continues expanding. Established financial institutions are increasingly offering similar products through compliant frameworks, potentially fragmenting HYPE's addressable market.
💡 Key Considerations for Market Participants
Investors evaluating HYPE exposure should consider several structural factors:
Valuation Dynamics: HYPE's fully diluted valuation near $54 billion substantially exceeds its circulating market capitalization of approximately $12.6 billion—a significant gap representing longer-term dilution risk as additional tokens enter circulation.
Revenue Sustainability: While $169 million in quarterly revenue demonstrates impressive scale, the protocol must maintain this trajectory to justify aggressive buyback allocations. Declining trading volumes would necessitate reduced buyback programs, potentially removing a key price support mechanism.
Market Expansion: RWA trading's rapid growth suggests Hyperliquid is successfully penetrating traditional asset tokenization markets, creating growth vectors beyond cryptocurrency perpetual futures—a strategically important development.
Competitive Positioning: Increasing regulatory approval for perpetual contracts within traditional finance venues may compress Hyperliquid's competitive advantages, requiring continued innovation to maintain market leadership.
🎯 The Path Forward for HYPE Price Action
The immediate HYPE price outlook depends fundamentally on whether current buying pressure can sustain a confirmed daily channel breakout above $57.30. Successfully penetrating this level would establish psychological momentum and potentially trigger algorithmic buying, opening pathways toward $60 and higher resistance zones.
Conversely, rejection at $57.30 coupled with breakdown below $54.40 would refocus attention on $52 and $50 support levels, potentially validating more bearish intermediate-term scenarios.
Hyperliquid's strategic positioning as a bridge between traditional finance and decentralized derivatives markets, combined with demonstrated revenue generation and shareholder-friendly capital allocation, suggests the protocol possesses fundamental strengths supporting longer-term value creation. However, near-term price action will likely remain contested between technical resistance zones and overbought momentum indicators.
Market participants should monitor three critical indicators: sustained trading volume above $250 million daily, maintenance of buyback allocations at current levels, and RWA trading volume trends. These metrics will ultimately determine whether HYPE's recovery represents the beginning of sustained appreciation or a temporary relief rally within a broader correction cycle.
You May Also Like

Altcoins
NCT Price Surge 200% on Upbit KRW Listing
August 26, 2026

Altcoins
WBT Reaches New All-Time High as Crypto Infrastructure Turns Institutional
August 26, 2026

Altcoins
Pi Network's August 24 Pricing Shakeup: End of Subsidized App Building
August 25, 2026

Altcoins
XRP Undervalued? Seven Spot ETFs & $1.4B Flows Tell
August 25, 2026