Category:
Market AnalysisJupiter Rallies on Revenue Surge: Price Predictions

In the ever-evolving world of cryptocurrencies, Jupiter (JUP) has emerged as a standout performer, capturing the attention of investors and analysts alike. This article delves into the recent price movements of JUP, exploring the factors driving its surge and what the future might hold for this intriguing altcoin.
Jupiter's Meteoric Rise 🚀
Jupiter has seen a remarkable increase, rising more than 15% following a sharp rebound in June protocol revenue. This surge comes as a breath of fresh air in an otherwise cautious market, where many digital assets have struggled to gain traction.
Revenue-Driven Momentum
The catalyst for Jupiter's rally was a significant boost in protocol activity. According to data from DeFiLlama, Jupiter generated an impressive 261,909 SOL in user fees and 76,257 SOL in protocol revenue during June. This marked a reversal of a three-month trend of declining network activity.
Such an increase in revenue is pivotal as it feeds into Jupiter's staking and governance model, creating renewed demand for the token. This financial inflow has been a key driver of the recent price surge, underscoring the importance of protocol performance in influencing market sentiment.
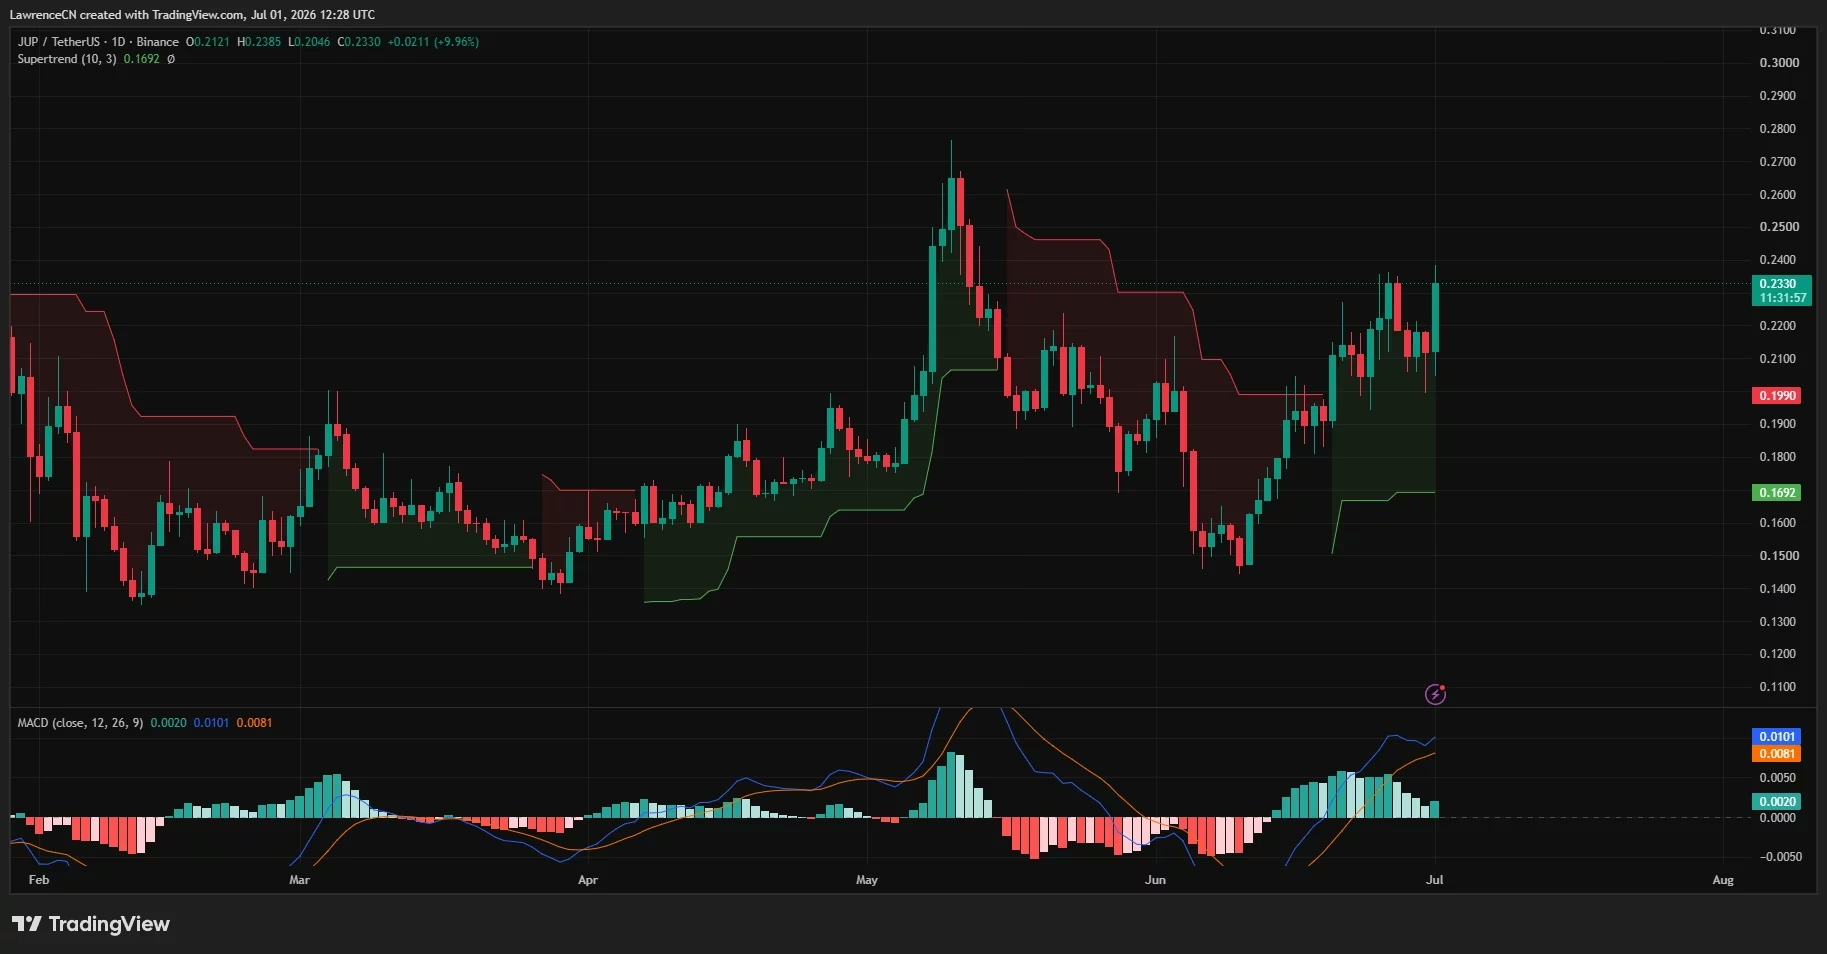
Technical Analysis: Clearing the 200-Day EMA 📈
Jupiter's technical indicators present a bullish outlook. The token has successfully reclaimed its 200-day Exponential Moving Average (EMA), a significant milestone that had previously acted as a strong resistance point.
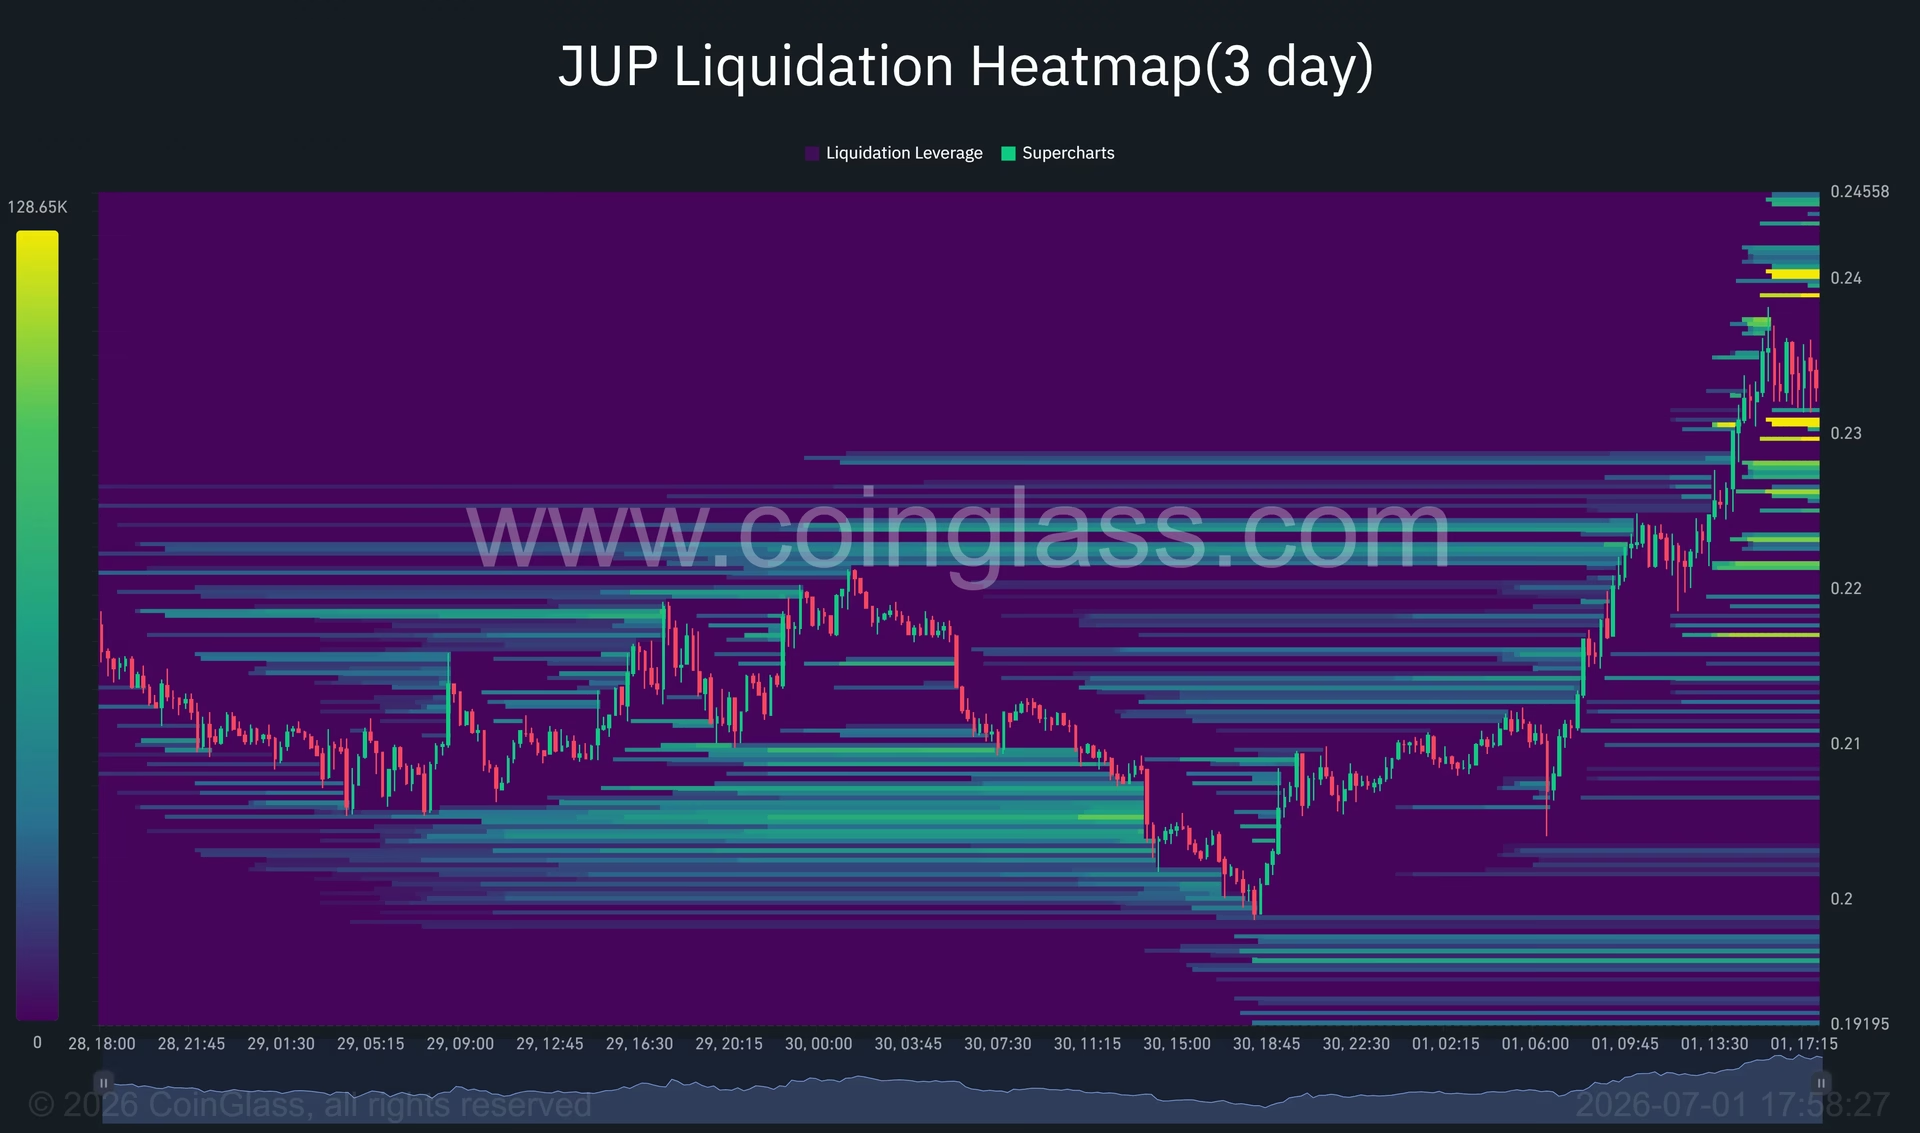
Open Interest and Funding Rates
Further supporting the bullish trend, open interest has climbed approximately 11% to $58.7 million, while funding rates have remained positive around 0.0021%. This indicates that leveraged traders are maintaining their long positions, suggesting confidence in the continued upward momentum.
Market Sentiment and Potential Resistance Levels
Despite the broader crypto market's risk-averse environment, Jupiter has outperformed larger-cap tokens. The Crypto Fear & Greed Index, which remains in the 'Extreme Fear' zone at around 11, highlights the cautious sentiment prevailing among investors.
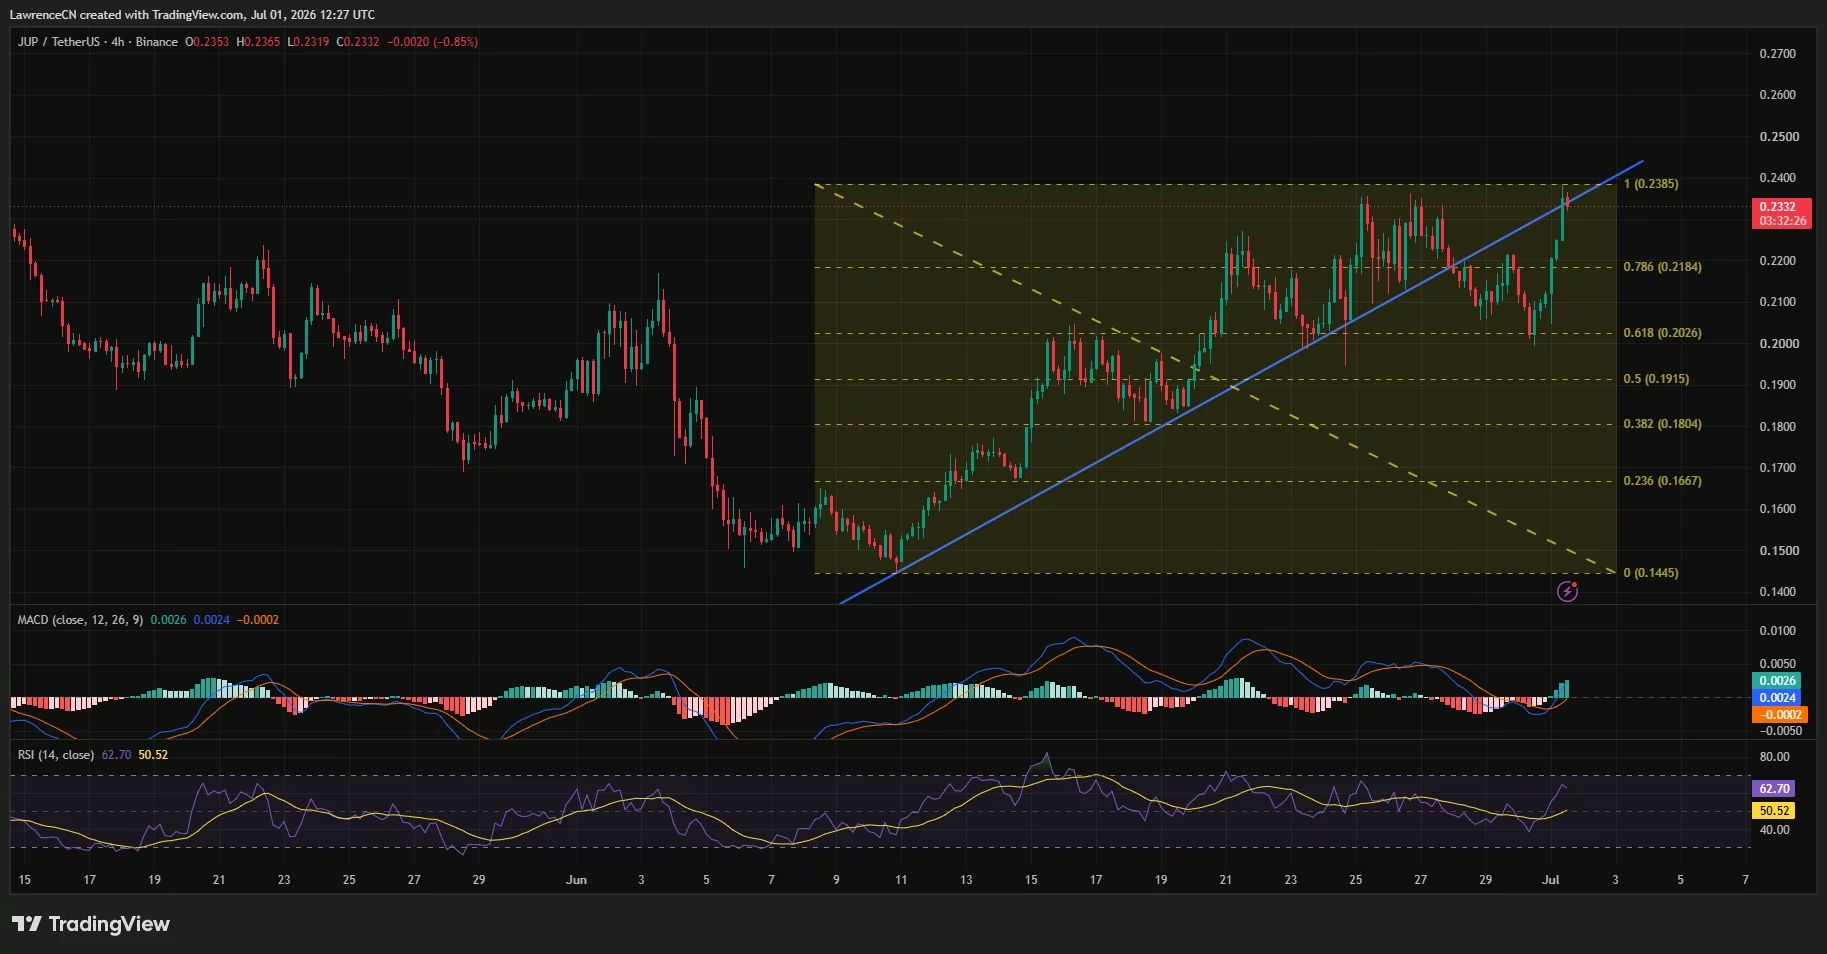
Key Resistance and Support Zones
Currently, bulls are eyeing the $0.24-$0.26 range as the next target. However, should the price drop below the $0.218 support level, we could see a resurgence of selling pressure. Fibonacci retracement levels point to immediate resistance near $0.238, with significant support at the 0.786 Fibonacci level near $0.218.
Broader Industry Trends 🌐
The rise of Jupiter coincides with broader trends in the cryptocurrency market. Altcoins, in particular, are gaining traction as investors look beyond Bitcoin and Ethereum for diversified opportunities. The focus on protocol-specific fundamentals over macroeconomic factors is becoming a notable trend, as seen with Jupiter.
Conclusion: The Road Ahead for Jupiter 🌟
As Jupiter continues its upward trajectory, investors and traders alike will be watching closely to see if it can maintain this momentum. The key to sustaining its rally will be ongoing growth in protocol revenue and robust participation in derivatives markets.
While the current technical indicators are promising, the macroeconomic environment poses potential risks. Persistent bearish sentiment and liquidity challenges could dampen further gains. However, if Jupiter continues to outperform, it may solidify its position as a leader in the altcoin space.
Key Takeaways:
- Jupiter has seen a 15% surge, driven by increased protocol revenue.
- The token has reclaimed its 200-day EMA, signaling a bullish trend.
- Key resistance levels are at $0.24-$0.26, with support at $0.218.
- Broader market trends show a focus on altcoin performance.
As always, investors should conduct their own research and consider market conditions before making any investment decisions. The crypto market is known for its volatility, and while opportunities abound, so do risks.
You May Also Like

Market Analysis
Bitcoin and XRP Face Resistance Amid Geopolitical Tensions
July 21, 2026

Market Analysis
Cathie Wood's $20M SpaceX Bet Soars 7%
July 21, 2026

Market Analysis
Will Protocol v25 Boost Pi Network Price Over $0.10?
July 21, 2026

Market Analysis
Can Cardano Hit $0.20 Amid Chart Patterns?
July 21, 2026