Category:
Market AnalysisEthereum Price Holds $1,900: Can ETH Reach $2,000?

Ethereum's Critical Juncture: Understanding the $1,900 Support Level 🔍
Ethereum is standing at a pivotal moment in its recent price trajectory. Currently trading around $1,917, ETH has successfully consolidated above the psychologically important $1,900 threshold after recovering from lows near $1,800 earlier in August. This consolidation pattern represents more than just price stability—it signals a critical battle between bulls and bears that will determine whether the world's leading smart contract platform can breach the coveted $2,000 barrier.
The recent recovery has been fueled by a confluence of macroeconomic factors and on-chain dynamics. Weaker-than-expected U.S. employment data in July, which showed nonfarm payrolls falling by 23,000 against forecasts for 80,000 jobs added, significantly reduced expectations for aggressive Federal Reserve rate hikes. This shift in monetary policy sentiment has created a favorable environment for risk assets, including cryptocurrencies. Ethereum benefited from this broader market rotation, alongside traditional equities like the S&P 500, which closed at record highs on August 7.
Technical Analysis: Reading the Charts 📊
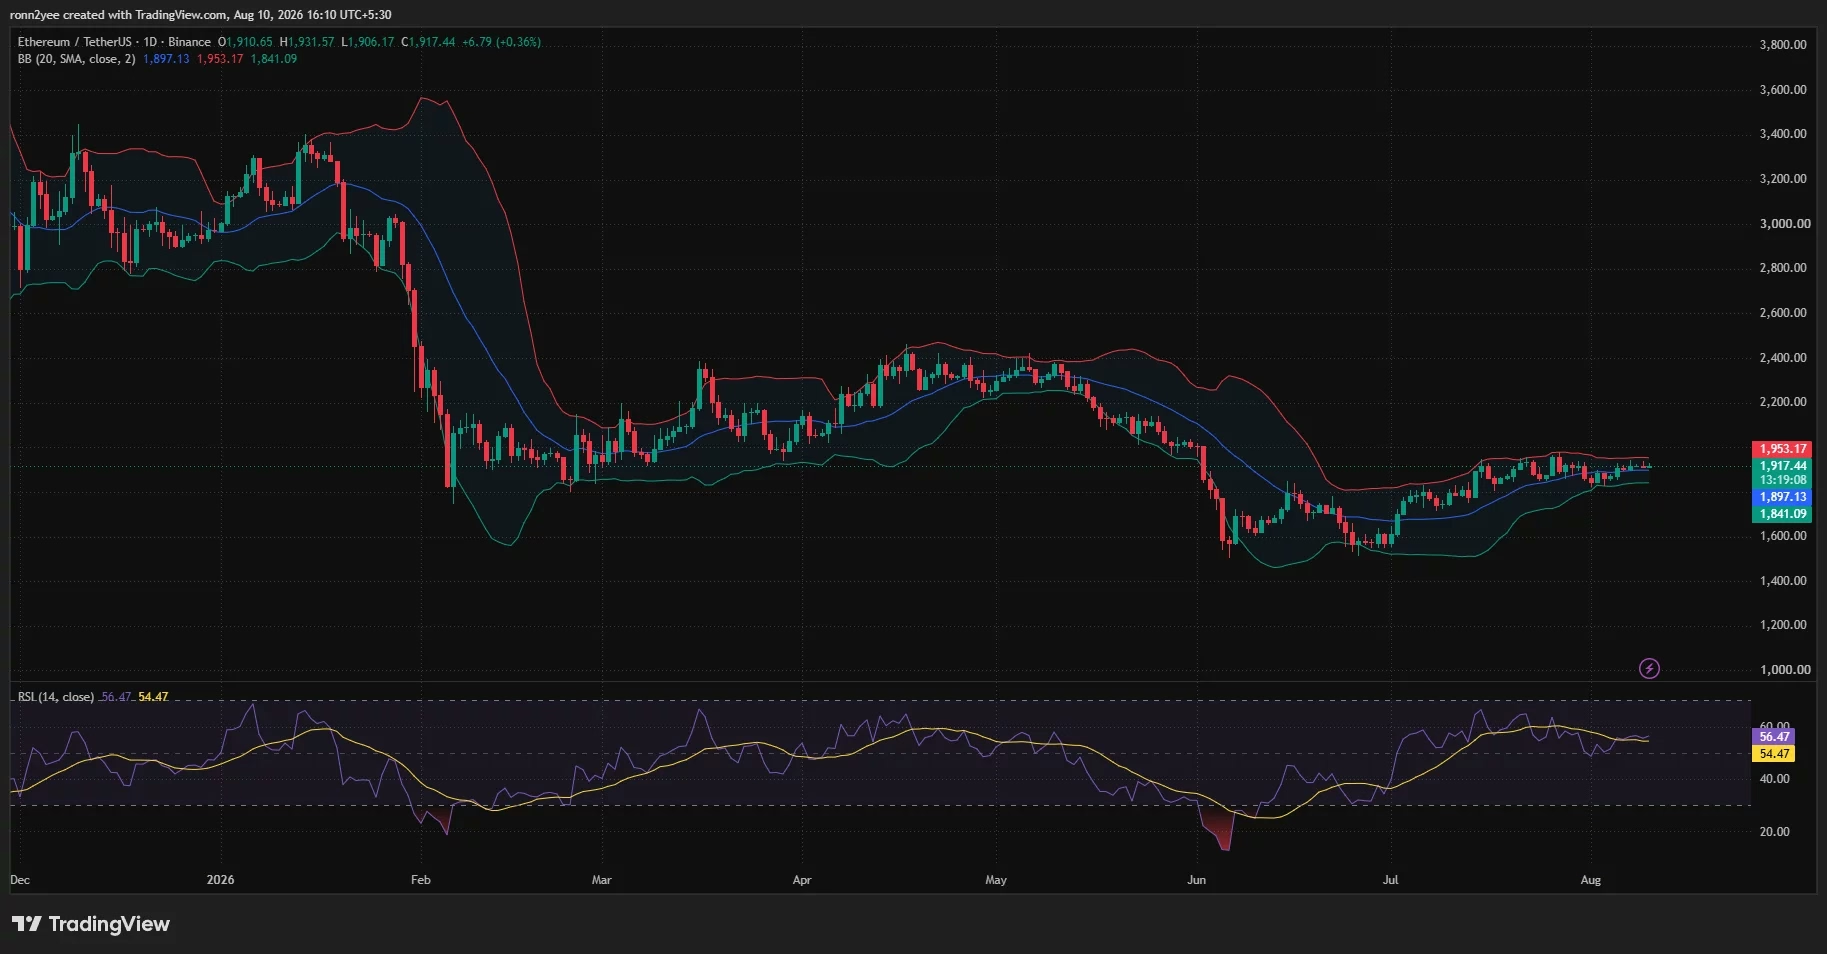
The daily chart reveals a nuanced technical picture. Ethereum is trading in the upper half of its Bollinger Bands, with the middle band positioned at $1,897 and the upper boundary at $1,953. This positioning keeps the short-term structure tilted toward buyers, as long as ETH maintains levels above the midpoint.
However, the momentum indicators tell a more cautious story. The daily relative strength index (RSI) stands at 56.47, slightly above its signal average of 54.47, indicating moderate bullish momentum without overbought conditions. More concerning is the flattening of this indicator after its recent rise, which mirrors the sideways price action we're currently observing.
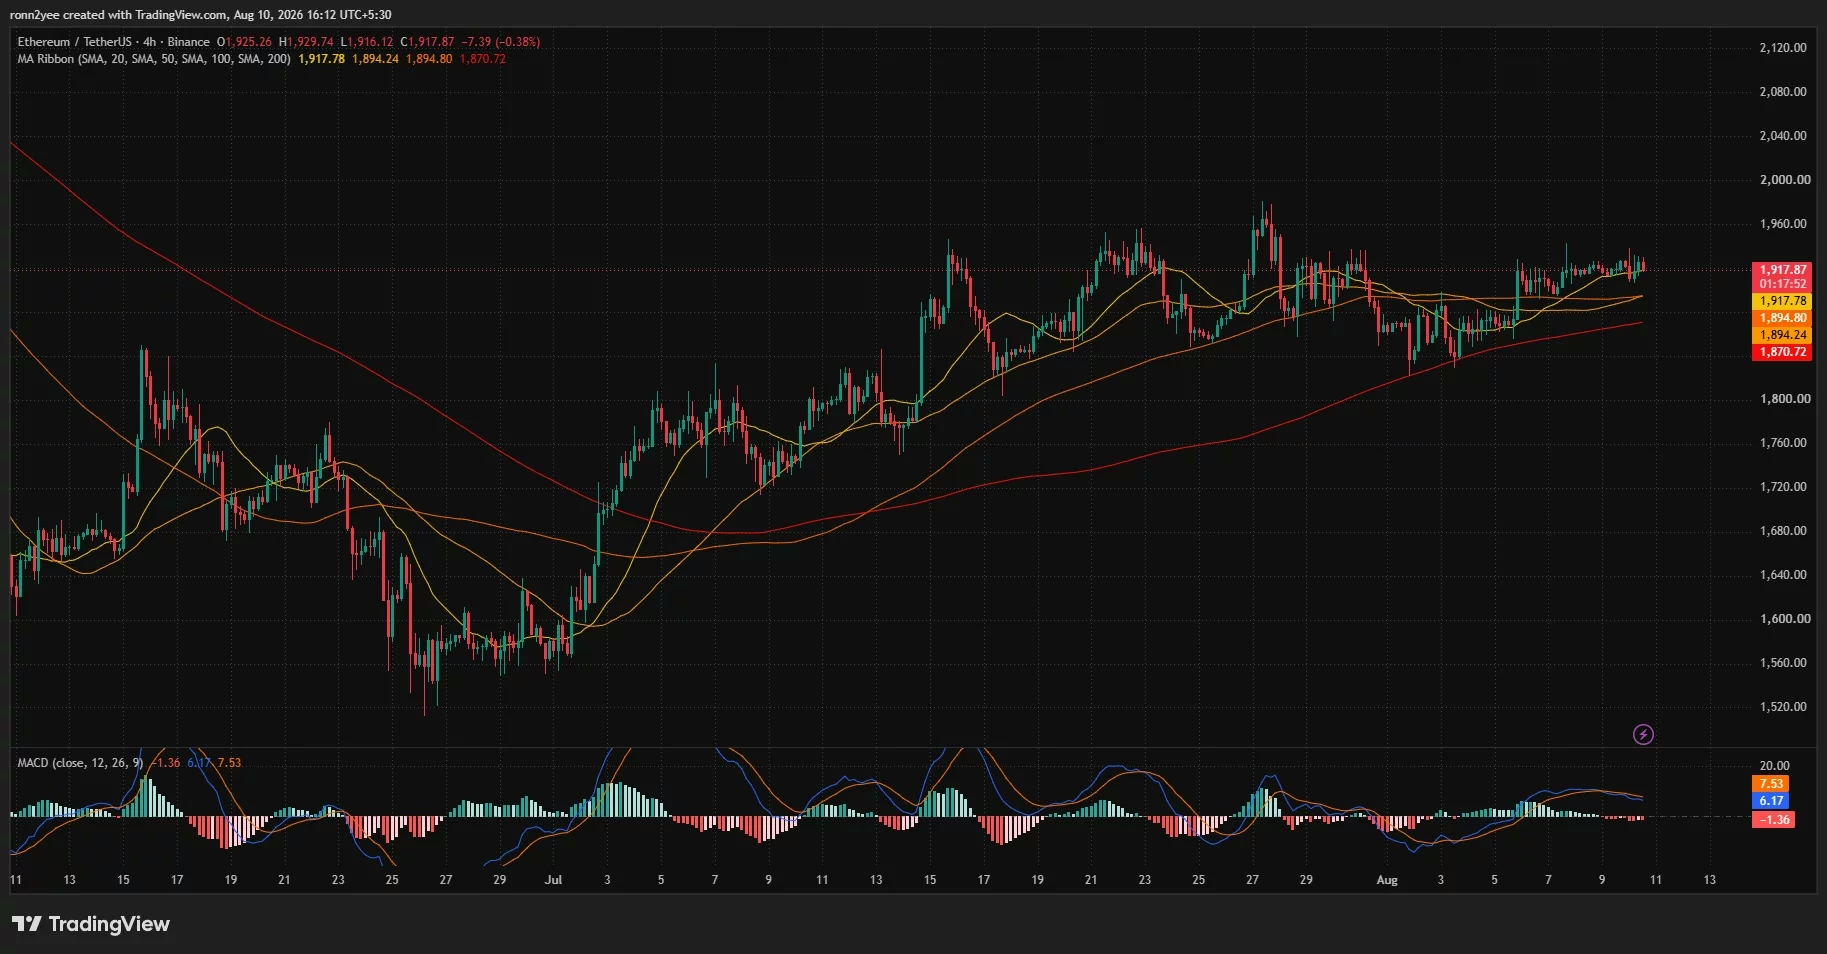
On shorter timeframes, the 4-hour chart shows ETH positioned almost exactly on its 20-period simple moving average at $1,917.78. The 50- and 100-period averages are tightly clustered around $1,894, creating a concentrated support zone directly beneath current price levels. This technical arrangement suggests that support is well-defined but also vulnerable if selling pressure intensifies.
The moving average convergence divergence (MACD) indicator on the 4-hour timeframe has weakened noticeably. The MACD line at 6.17 has dipped below the signal line at 7.53, with the histogram turning slightly negative at -1.36. This crossover suggests that buying momentum is losing steam, though a confirmed trend reversal has not yet materialized.
The Liquidation Landscape: Where the Real Battles Occur 🎯
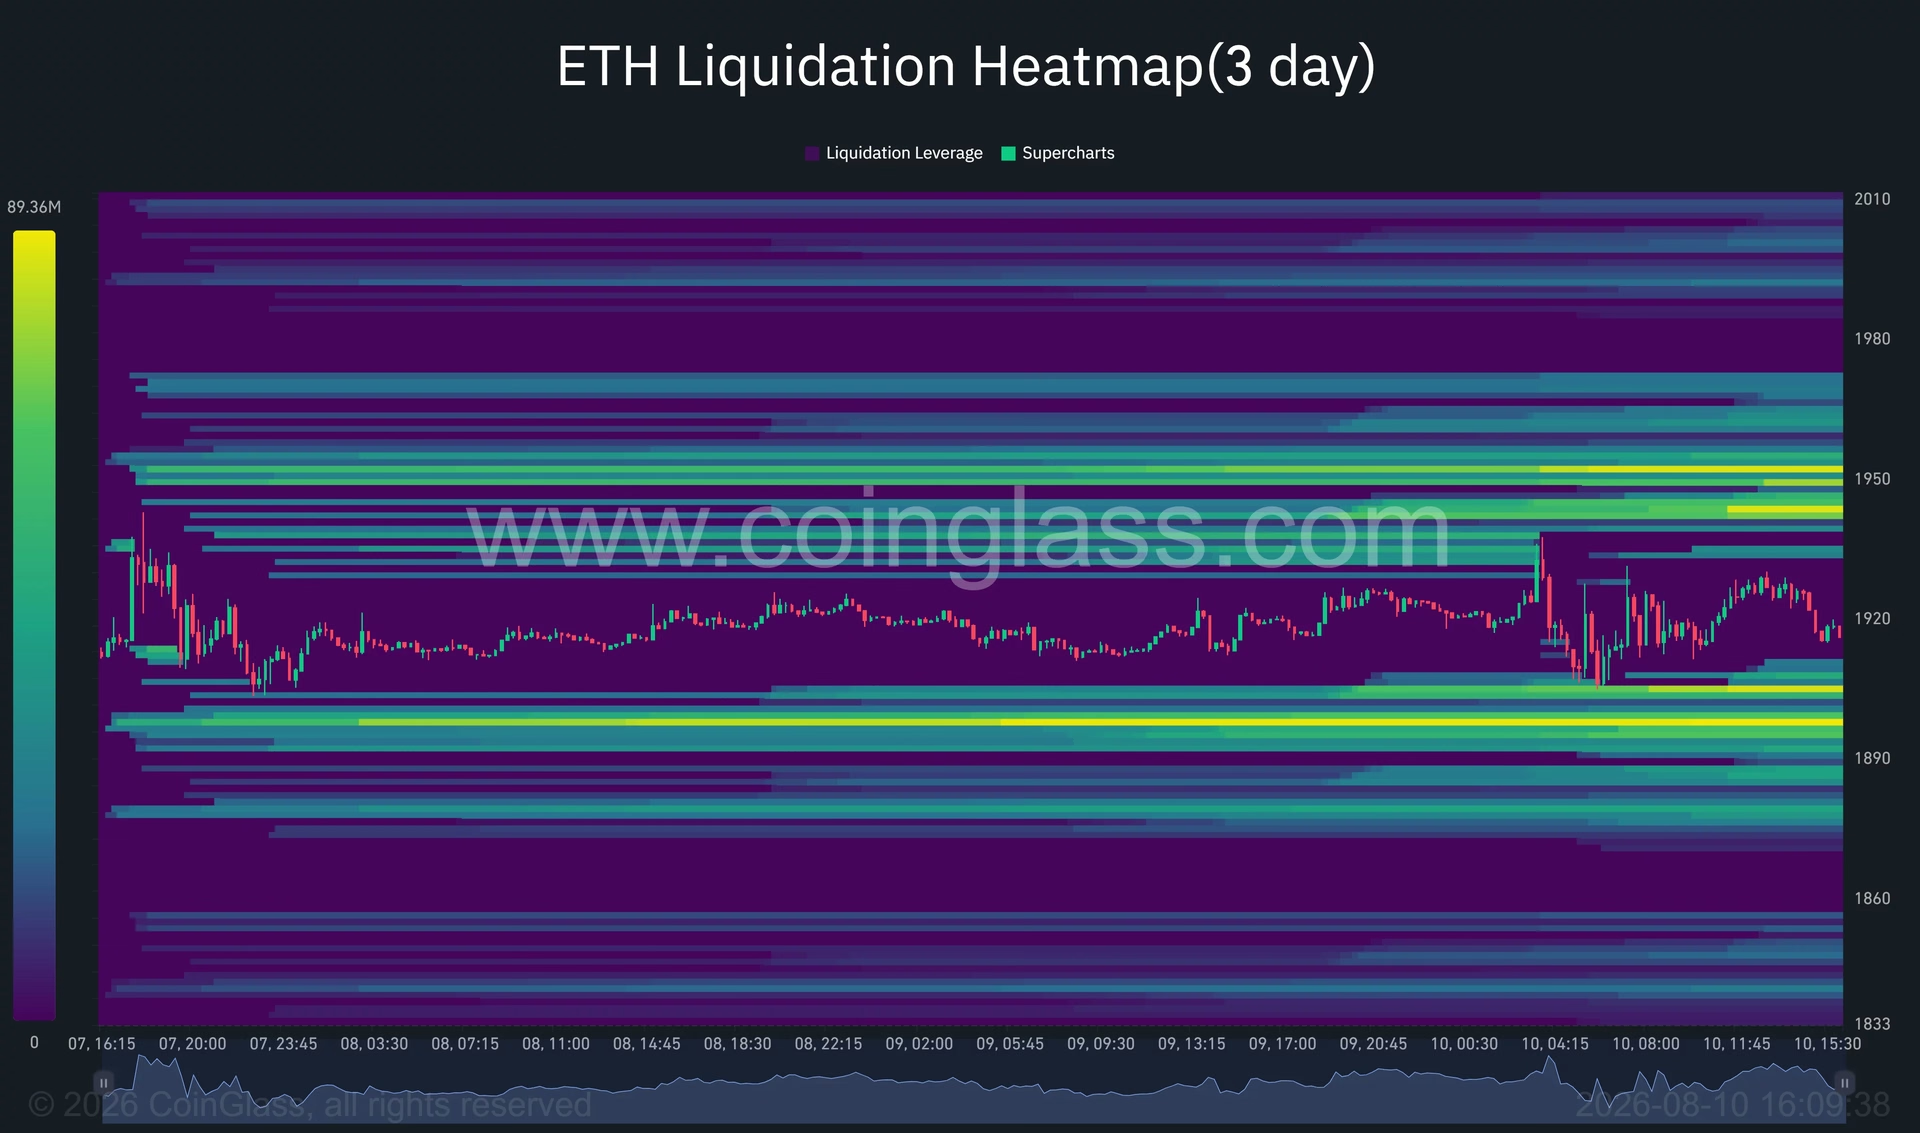
Liquidation data provides crucial insights into where leverage is concentrated and where price is likely to face friction. The 3-day liquidation heatmap reveals two major leverage clusters that frame Ethereum's near-term trading range.
On the upside, the nearest significant liquidation cluster extends from approximately $1,942 to $1,953, with particularly dense concentration around the $1,950 level. This area acts as a price magnet—if Ethereum can overcome recent intraday highs near $1,930, liquidations in this zone could accelerate price movement higher. A decisive break above $1,953 would simultaneously breach the daily upper Bollinger Band, potentially opening the path toward the psychological $2,000 target.
The downside picture is equally important. The strongest nearby liquidation band sits between $1,895 and $1,902, which conveniently overlaps with both the 4-hour moving average cluster and the daily Bollinger midpoint at $1,897. A sweep through this area could trigger cascading long liquidations, potentially giving sellers temporary control. If this support fails, Ethereum could retreat toward the 4-hour 200-period average at $1,871, with the daily lower Bollinger Band at $1,841 providing the next major safety net.
The Path to $2,000: Multiple Hurdles Ahead 🚀
Reaching $2,000 from current levels requires Ethereum to navigate several technical barriers. Market analysts have identified a clear roadmap:
Immediate Resistance Levels:
- $1,950: Dense liquidation cluster that could trigger volatility
- $1,953: Daily upper Bollinger Band and major technical barrier
- $1,965: Previously identified resistance from earlier recovery attempts
- $2,000: Psychological target and key milestone
For bulls to successfully push through these levels, ETH must first maintain its position above $1,900 while building momentum through the $1,925 area. The next critical test involves breaking through the $1,953 barrier, which would signal genuine strength and potentially unlock a move toward $1,965 and beyond.
Some analysts remain optimistic about $2,000 prospects, suggesting that a confirmed close above $1,953 could trigger rapid movement toward the target. More aggressive scenarios even point to potential moves toward $2,030 and $2,100 if momentum accelerates significantly.
Risk Factors: The Bearish Scenario 📉
While upside potential exists, downside risks deserve equal consideration. A breakdown below the $1,900 support level would represent a critical failure of the current recovery structure. Such a move could expose traders to deeper losses, with potential targets near $1,700 and $1,500 if the broader recovery framework breaks down entirely.
Analysts have noted that Ethereum is currently testing a descending resistance line for the third time. Previous encounters with this level resulted in sharp rejections, suggesting that breaking through definitively could be challenging. Some market observers maintain that another broad correction could drive Ethereum toward the $1,400–$1,600 demand zone, though such a scenario would require significant negative catalysts.
Macroeconomic Tailwinds and Regulatory Progress 🌍
Beyond technical factors, Ethereum's price action has been supported by improving macroeconomic conditions and regulatory clarity. The softer employment data mentioned earlier has shifted expectations around Federal Reserve policy, reducing the likelihood of aggressive rate hikes that typically pressure growth assets.
Additionally, U.S. legislative efforts to provide clearer regulatory frameworks for digital assets have provided sentiment support. Senate Majority Leader John Thune filed a motion advancing the Digital Asset Market Clarity Act toward a procedural vote after the August recess. While this filing does not represent final passage, it signals ongoing momentum toward establishing clearer regulatory standards for cryptocurrency markets. Lawmakers continue working through disputes involving government ethics, stablecoin rewards, and enforcement provisions, but the general trajectory appears constructive for the industry.
What Traders Should Watch 👀
The immediate trading range appears to be bounded by $1,894 on the downside and $1,953 on the upside. A sustained close above $1,953 would likely favor a test of $1,965 and $2,000. Conversely, a breakdown below $1,894 would expose the $1,871 and $1,841 support levels, potentially placing the entire recovery at risk.
Key price action to monitor includes:
- Liquidation activity around $1,950: Heavy liquidations here could accelerate upside moves
- Volume confirmation: Breakouts require strong volume to be considered valid
- Moving average alignment: The tight clustering of 50- and 100-period averages provides a clear support zone
- MACD divergence: Any reversal in the MACD histogram could signal renewed momentum
The Bottom Line: $2,000 Remains Within Reach 🎯
Ethereum's ability to hold above $1,900 demonstrates underlying buyer interest, even as short-term momentum has weakened. The technical setup presents a clear roadmap to $2,000, with defined resistance levels that, if cleared, could unlock rapid price appreciation.
However, success is not guaranteed. The consolidation pattern currently in place suggests that buyers and sellers are assessing their positions carefully. Breaking through the $1,953 barrier would represent a significant psychological victory for bulls and could trigger the momentum needed to reach $2,000.
For traders and investors, the key is understanding the risk-reward dynamics at play. The support levels are well-defined, offering clear exit points if the recovery fails. Conversely, a confirmed breakout above $1,953 could present attractive risk-reward opportunities for those positioned for the $2,000 target.
Ethereum's price action over the coming days will likely prove decisive. Whether ETH successfully navigates the $1,950–$1,953 resistance zone or retreats to test lower support levels will determine the trajectory for this critical digital asset in the near term. ✨
You May Also Like

Market Analysis
XRP Price Falls 5% as Leverage Hits Seven-Month High
August 26, 2026

Market Analysis
Crypto Market Hits Extreme Greed: What This Means for Bitcoin
August 26, 2026

Market Analysis
Ethereum Price Rally Overheats Below $2,550 Resistance
August 26, 2026

Market Analysis
Hyperliquid Price Rally: HYPE Targets $97 Amid $80 Support
August 25, 2026