Category:
AltcoinsMantle Price Surges 6% as MNT Targets Major Breakout

The altcoin market continues to demonstrate resilience and opportunity, with Mantle (MNT) emerging as a compelling case study in technical recovery and fundamental strength. 📈 On August 19, the token rebounded sharply with a 6.6% price increase, trading near the $0.455 level and positioning itself at a critical juncture that could determine its near-term trajectory.
This recovery marks a significant milestone for MNT holders and traders who have weathered volatility throughout the summer months. The token's ability to reclaim key technical levels while its underlying network experiences explosive growth suggests that Mantle's ecosystem development is translating into tangible market support.
The Technical Setup: MNT Eyes Critical Resistance ✨
Mantle's price action tells a compelling story when examined through the lens of technical analysis. The token initiated its August recovery from approximately $0.39, establishing a series of higher lows that demonstrate accumulation by smart money. This pattern reflects the textbook behavior of an asset building a foundation before a larger move.
The immediate resistance level commanding attention sits at $0.4575, which corresponds to the 78.6% Fibonacci retracement of MNT's decline from its previous peak of $0.7149 down to the lows near $0.3874. In technical analysis, this Fibonacci level carries significant weight because it represents the final barrier before price would need to recapture the broader breakdown zone.
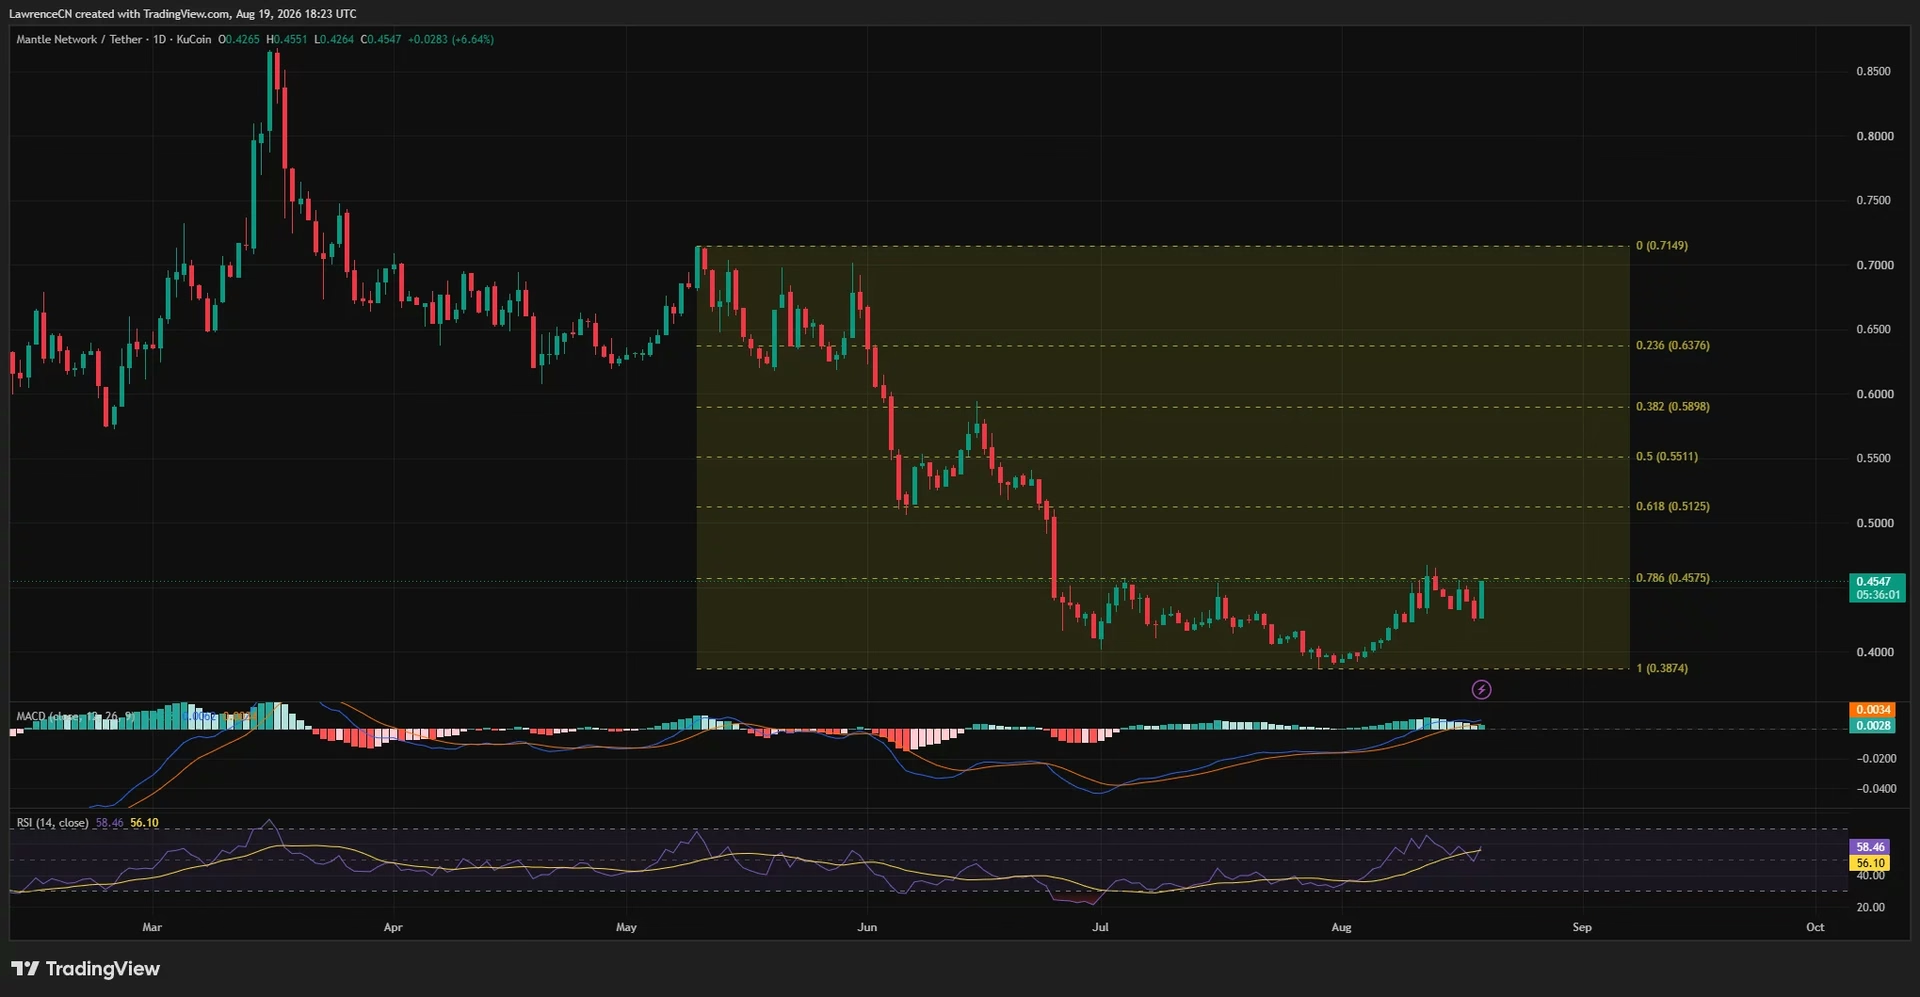
MNT briefly tested the $0.467 level on August 13, a move that demonstrated buyer interest but also revealed seller conviction at that price point. The fact that the token retreated but maintained support above $0.42 indicates that the selling pressure wasn't overwhelming—a bullish sign for those anticipating a breakout.
The relative strength index (RSI) currently trades at 58.46, positioned above its signal average of 56.10 but comfortably below the 70 overbought threshold. This reading is particularly important because it shows that buyers have momentum without the token being stretched to unsustainable extremes. Meanwhile, the moving average convergence divergence (MACD) indicator remains positive, though the tight spacing between its signal lines suggests that MNT requires additional momentum confirmation to sustain a meaningful breakout.
Liquidation Dynamics: The Short-Squeeze Potential 🔥
One of the most fascinating aspects of MNT's current price setup involves the distribution of leveraged positions in the market. Liquidation data provides crucial insights into where forced buying or selling could occur, potentially accelerating price moves in either direction.
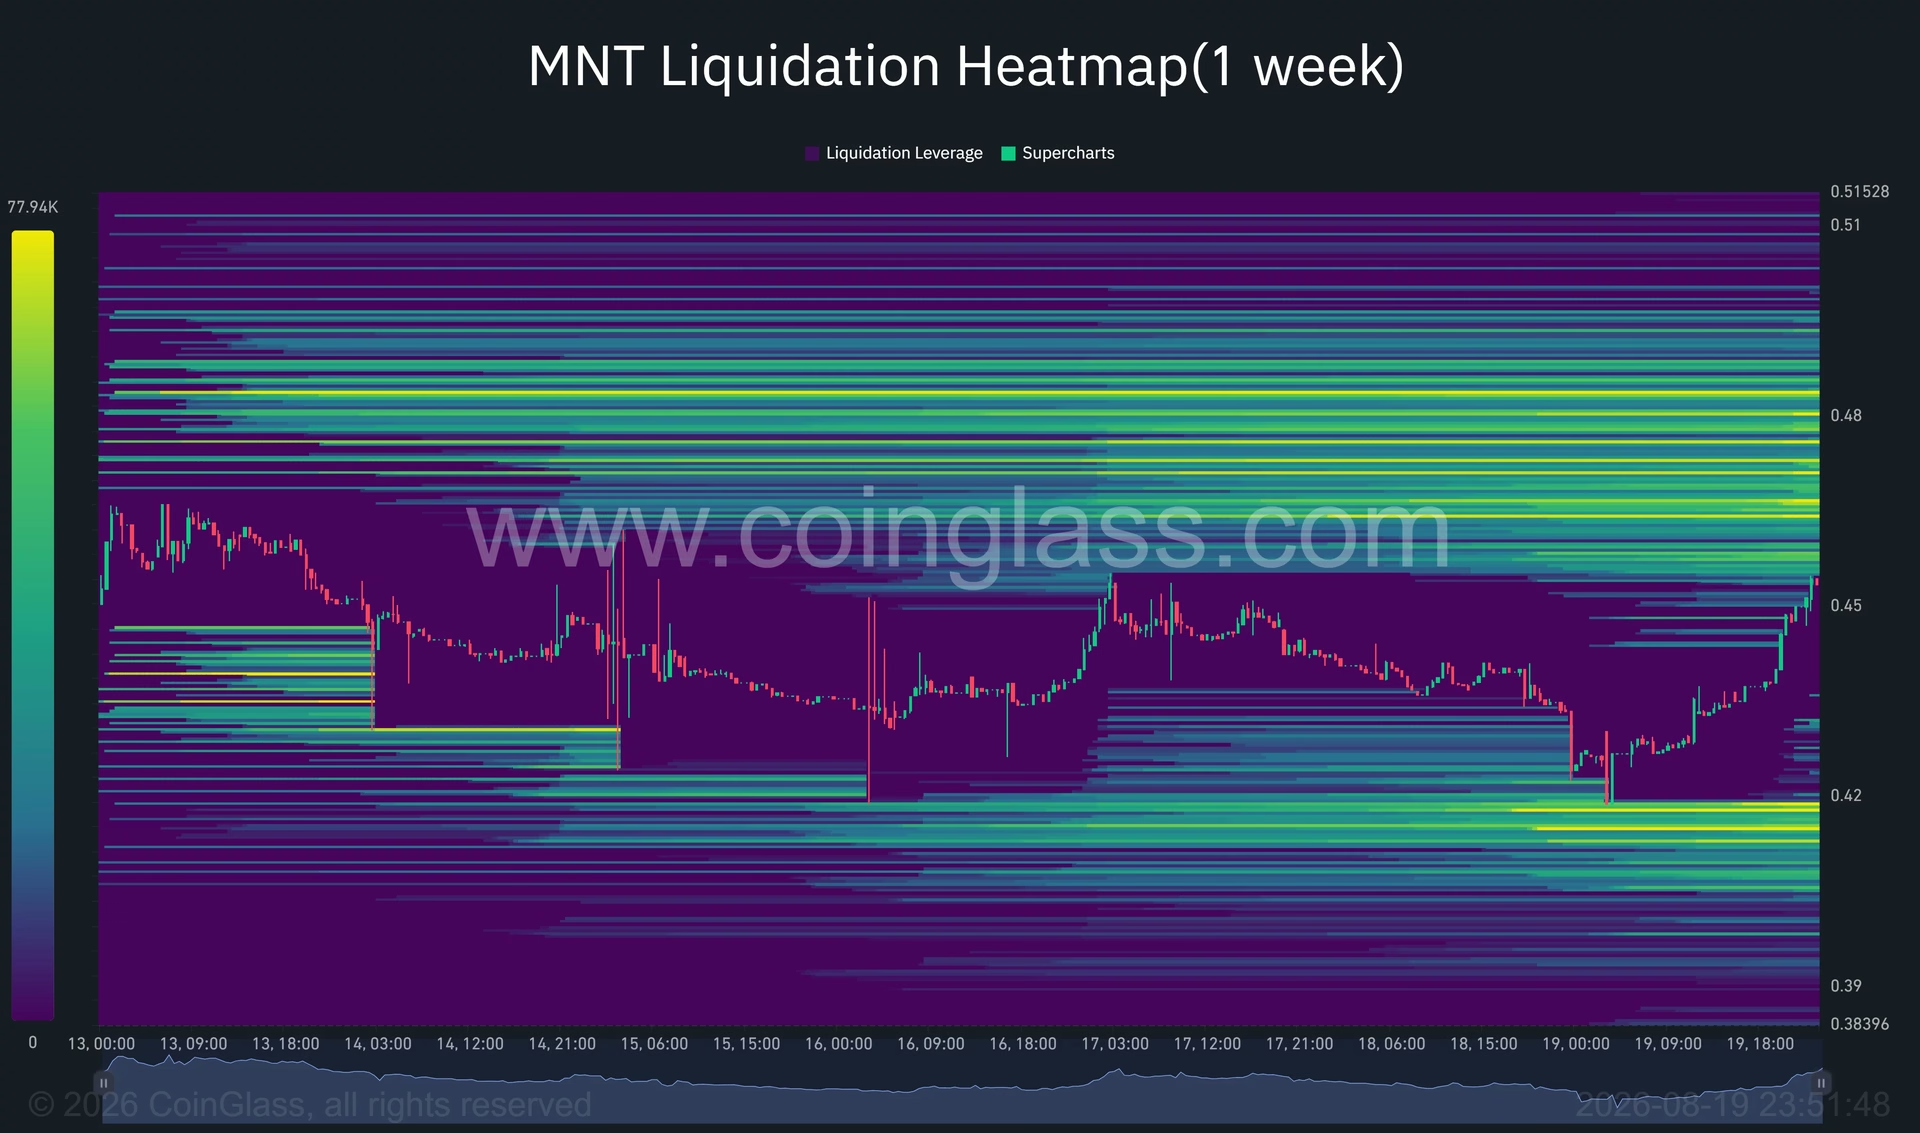
The one-week liquidation heatmap reveals a particularly intriguing setup: significant concentrations of leveraged positions exist immediately above MNT's current market price. The densest clusters appear between $0.46 and $0.47, with even brighter bands extending from $0.475 to $0.49. This configuration creates what traders commonly refer to as a short-squeeze zone—an area where accumulated short positions could trigger a cascade of forced buying if price reaches those levels.
Here's why this matters: If MNT successfully breaks above the $0.4575 resistance level, it would likely encounter the first liquidation cluster near $0.47. Traders holding short positions at these levels would face margin calls, forcing them to purchase MNT to close their positions. This forced buying pressure could propel the token toward the stronger liquidation band at $0.48–$0.49, potentially delivering the 10% breakout that traders are anticipating.
However, it's crucial to understand that liquidation clusters don't guarantee price movement. They represent potential trigger points where market dynamics could shift, but they're not destiny. Market structure, broader sentiment, and macroeconomic factors all play equally important roles.
The Downside Scenario: Where Support Lies 📊
While the upside potential captures attention, prudent analysis requires understanding the downside risks. The nearest significant liquidation pool on the downside sits between $0.412 and $0.418. If MNT loses momentum and dips below this level, a cascade of long position liquidations could accelerate selling pressure.
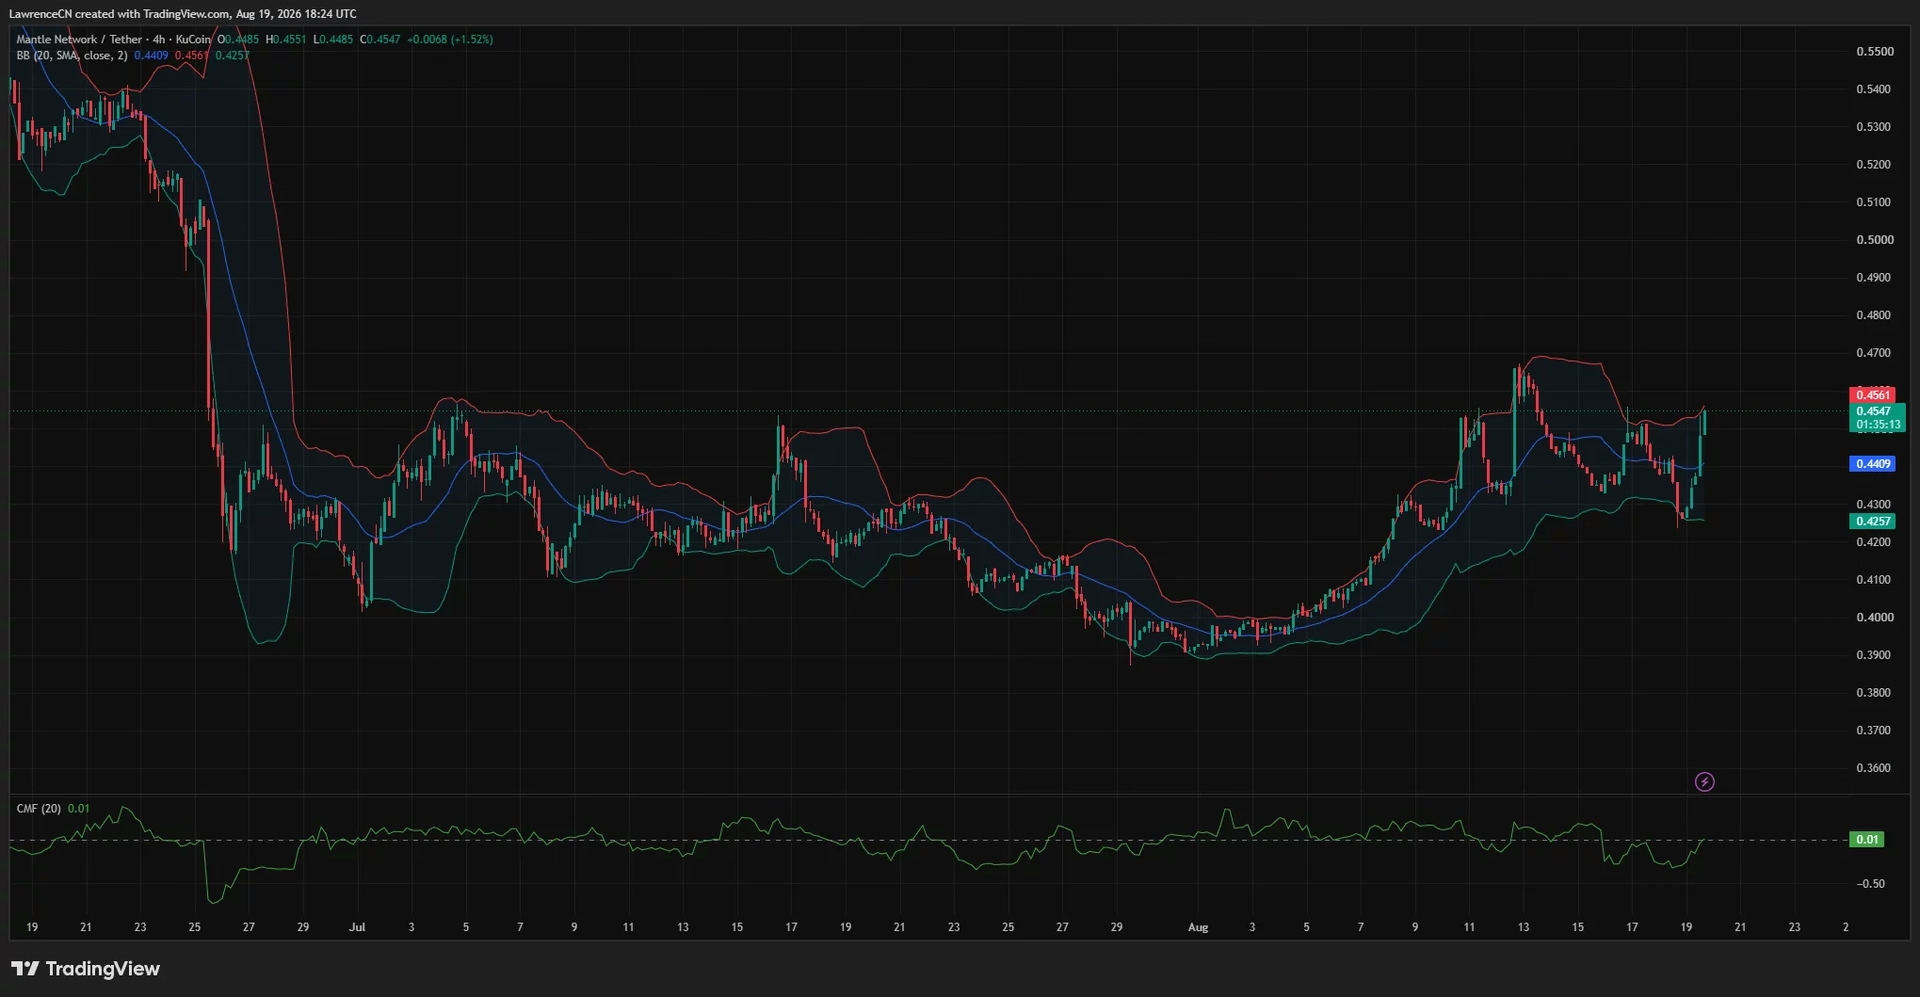
On the 4-hour timeframe, the Bollinger Band midpoint at $0.4409 serves as the first critical support level. Holding above this point would preserve the short-term upward structure and allow for another attempt at the $0.4575 and $0.467 resistance levels. A close below this midpoint would weaken the setup and expose the lower Bollinger Band near $0.4257.
The $0.44 level emerges as particularly important for maintaining momentum. MNT must defend this price to keep the rebound intact. Failure to hold here would put the August 19 intraday low around $0.42 back into play, with the broader daily support at $0.3874 representing the ultimate backstop.
Fundamental Catalysts: DeFi Growth Accelerating 🚀
Beyond technical analysis, Mantle's price recovery gains credibility from impressive fundamental developments within its ecosystem. The network has undergone remarkable expansion in both traditional finance integration and decentralized finance adoption.
According to recent data from the second quarter of 2026, Mantle's total value locked (TVL) exceeded $1 billion, representing a staggering 230% growth during the first half of the year. This isn't merely a statistical achievement—it reflects genuine user adoption and capital deployment on the network.
The breakdown reveals several growth engines:
- RWA-focused DeFi TVL surpassed $90 million, demonstrating institutional appetite for real-world asset tokenization
- Mantle Vault assets under management exceeded $200 million
- Stablecoin market capitalization reached $955 million, up 120% year-over-year
- Tokenized equities expanded from just 10 in April to 155 by June
This tokenized equity expansion deserves particular attention. Mantle's network now hosts products linked to major companies and funds, including exposure to SpaceX and Franklin Templeton's U.S. Equity Index ETF. While these tokenized assets don't provide direct ownership unless explicitly stated, they represent a bridge between traditional finance and blockchain infrastructure—a narrative that attracts institutional capital.
The Aave deployment on Mantle provides another growth marker. The protocol reached $1 billion in total borrowed assets within just 19 days of launch, with deposits subsequently exceeding $1.45 billion by April. This adoption velocity indicates that Mantle has successfully attracted both retail and institutional users seeking DeFi exposure.
Capital Flow Analysis: The Missing Confirmation 💡
While momentum indicators show promise, one important metric deserves scrutiny: the Chaikin Money Flow (CMF) indicator currently stands at 0.01, indicating that buying pressure has only marginally moved above neutral territory. This reading suggests that while price is rising, the volume of capital flowing into the asset isn't overwhelming.
For MNT to achieve a convincing breakout above $0.4575, confirmation through elevated trading volume becomes essential. The current price action could represent buyers testing resistance, but without substantial volume participation, the breakout might lack the conviction needed to push toward $0.48–$0.49.
This dynamic underscores a critical principle in technical analysis: price moves driven by volume are more likely to be sustainable than those occurring on light trading activity. Traders watching MNT's breakout attempt should monitor volume expansion as a key confirmation signal.
Fibonacci Resistance Ahead 📐
If MNT successfully clears the immediate $0.4575 resistance and sustains momentum through the liquidation clusters at $0.48–$0.49, additional Fibonacci levels would come into focus. The $0.5125 level represents broader Fibonacci resistance, followed by $0.5511.
Reaching these levels would represent a meaningful recovery from the August lows, though traders should recognize that each resistance level becomes progressively harder to overcome as price climbs.
What Traders Should Monitor 👀
The coming days will prove decisive for MNT's near-term trajectory. Several key factors deserve attention:
Breakout Confirmation: A daily close above $0.4575 would signal that buyers have reclaimed a critical technical level and could trigger the short-squeeze dynamic.
Volume Expansion: Watch for trading volume to increase during any breakout attempt. Light volume breakouts often reverse.
Support Maintenance: If MNT pulls back, the $0.44 level becomes crucial. Failure to hold here would suggest the rebound may be losing steam.
Liquidation Cascade: Once price approaches the $0.46–$0.47 liquidation clusters, watch for acceleration that might indicate forced buying from short position closures.
Macro Context: Broader cryptocurrency market sentiment and Bitcoin's price action will influence MNT's ability to sustain any breakout.
The Bigger Picture: Altcoin Seasonality 🌟
Mantle's technical setup arrives during a period when altcoins are receiving renewed attention in the broader cryptocurrency market. The token's combination of technical readiness, liquidation dynamics, and fundamental ecosystem growth creates a compelling setup that extends beyond simple speculation.
The network's push into real-world asset tokenization and institutional-grade DeFi represents a longer-term narrative that could support sustained price appreciation if execution continues. However, near-term traders should focus on the technical levels and volume confirmation that will determine whether MNT achieves the anticipated 10% breakout.
Key Takeaways 🎯
Mantle's 6% rebound positions MNT at a critical inflection point where technical, sentiment, and fundamental factors align. The $0.4575 resistance level represents the gateway to higher prices, with potential targets at $0.48–$0.49 if liquidation dynamics activate.
However, the modest Chaikin Money Flow reading reminds us that volume confirmation remains essential for a sustainable breakout. The network's impressive DeFi growth and tokenized asset expansion provide fundamental support for longer-term appreciation, but near-term price action will depend on whether buyers can clear technical resistance with conviction.
Traders watching MNT should approach any breakout with disciplined risk management, recognizing that while the setup appears favorable, confirmation through volume and support maintenance remains paramount. The next few trading sessions will likely prove decisive in determining whether MNT achieves its breakout objective or retreats to test lower support levels.
You May Also Like

Altcoins
NCT Price Surge 200% on Upbit KRW Listing
August 26, 2026

Altcoins
WBT Reaches New All-Time High as Crypto Infrastructure Turns Institutional
August 26, 2026

Altcoins
Pi Network's August 24 Pricing Shakeup: End of Subsidized App Building
August 25, 2026

Altcoins
XRP Undervalued? Seven Spot ETFs & $1.4B Flows Tell
August 25, 2026