Category:
AltcoinsUniswap Price Crashes 20% as Breakdown Targets $3

Uniswap (UNI) has experienced a significant pullback, with the decentralized exchange token plummeting nearly 20% over the past week to trade around $3.23. 📉 This sharp decline marks a critical juncture for the altcoin, as technical indicators suggest further downside pressure could push the token toward the psychologically important $3.00 level. The selling pressure has intensified due to a combination of factors including a bearish head-and-shoulders pattern breakdown, weak capital inflows, and cascading liquidations that have created a challenging environment for bulls.
The UNI token reached a peak near $4.59 in early August before reversing course dramatically. This reversal has erased most of the gains accumulated since the June 11 low of $2.32, leaving investors who purchased during the recovery disappointed. Understanding the technical setup and market dynamics behind this crash is essential for traders and investors monitoring this crucial altcoin.
📊 Technical Breakdown: The Head-and-Shoulders Pattern
Crypto analysts have identified a compelling head-and-shoulders formation on UNI's 4-hour chart, a pattern historically associated with significant trend reversals. The formation developed with a left shoulder below $4.00, followed by a head near $4.60, and a right shoulder that failed around $4.20. This bearish pattern has now completed its breakdown below the neckline near $3.90, triggering the sell-off that brought UNI to current levels.
The projected downside target for this head-and-shoulders pattern sits near $3.00, placing the current price just 7% above the anticipated support level. This proximity to the target suggests that the breakdown remains in its early stages, with the potential for accelerated selling if key technical levels fail to hold. The 4-hour chart has painted a clear picture of deteriorating momentum, with UNI forming a sequence of lower highs since the August 1 peak.
🔍 Fibonacci Retracement Levels Under Pressure
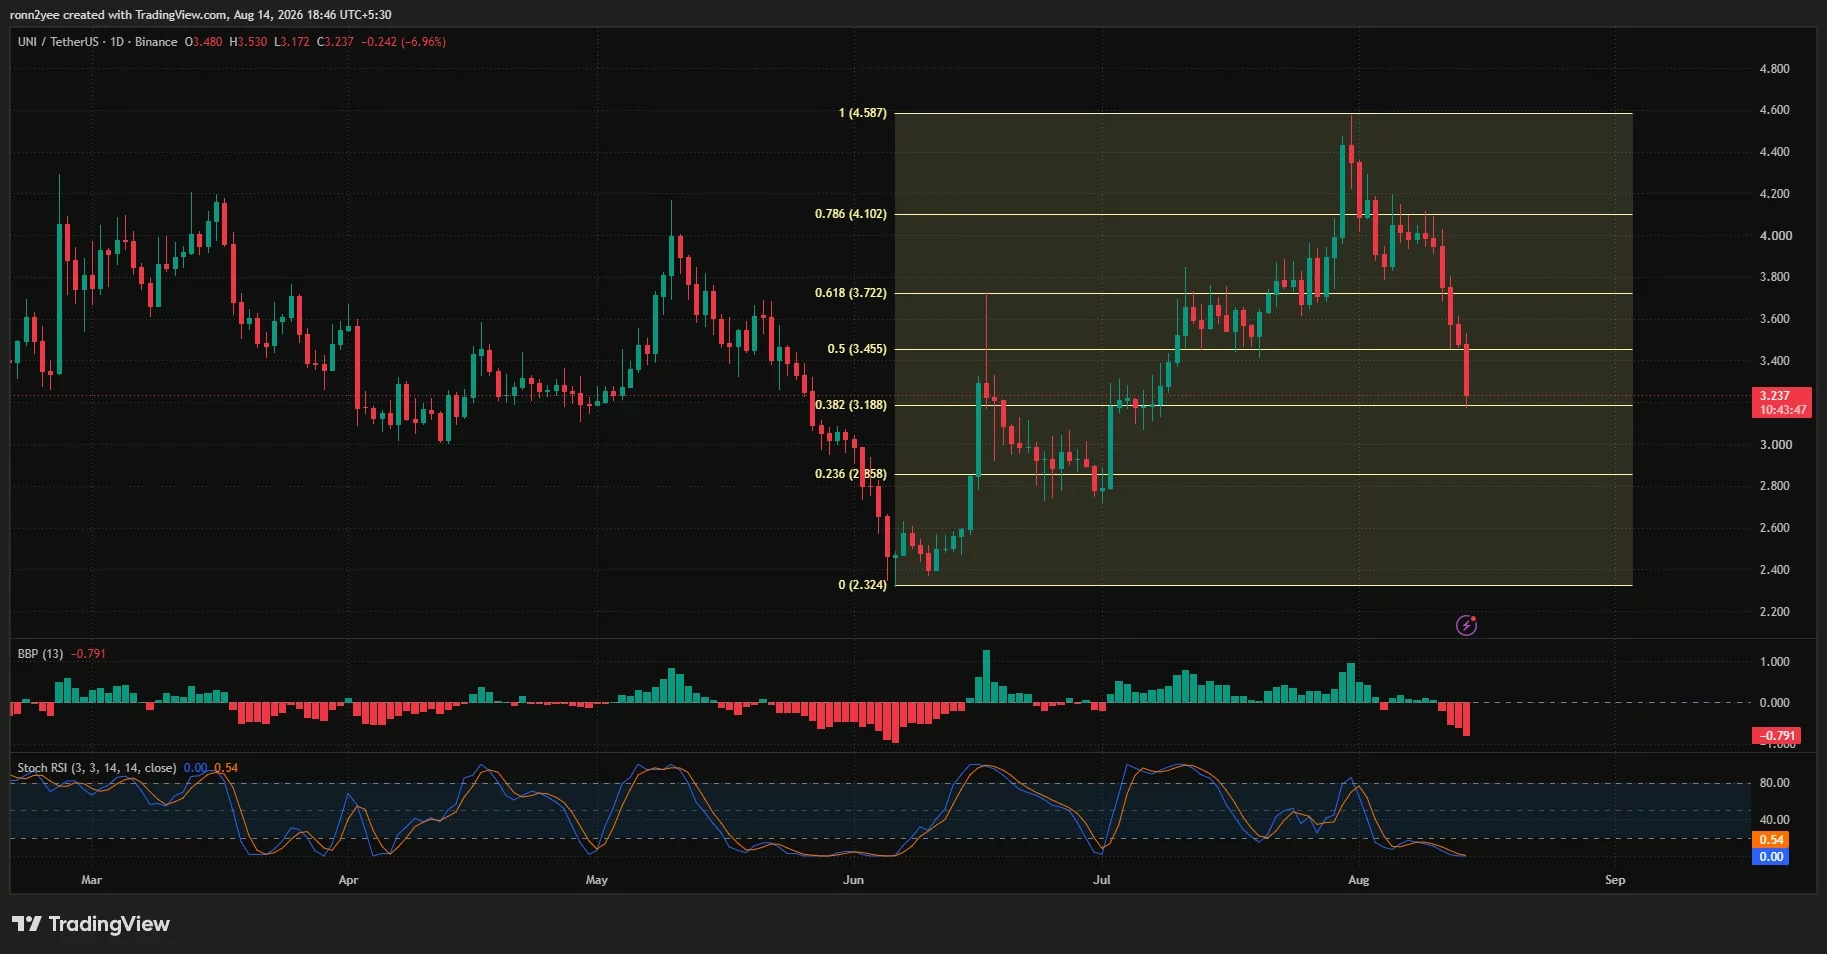
UNI has systematically broken through multiple Fibonacci retracement levels during its decline from the $4.59 high. The token has already surrendered the 78.6% ($4.10), 61.8% ($3.72), and 50% ($3.46) retracement levels, with current price action testing the critical 38.2% Fibonacci support at $3.19. This level carries particular significance because it aligns with the lower boundary of UNI's March-to-May trading range, where historical buying pressure previously emerged around $3.10–$3.20.
A daily close below $3.19 would represent a breach of this historically important support zone, potentially exposing the 23.6% retracement at $2.86 and ultimately the psychological $3.00 barrier. The June swing low at $2.32 represents the ultimate downside target should selling continue unabated. The token's inability to hold above these levels would signal that the entire rally from June has been invalidated.
💧 Capital Outflows and Weak Money Flow Indicators
The decline in UNI price has been accompanied by concerning indicators regarding capital movement and market structure. The Chaikin Money Flow (CMF) indicator has turned sharply negative at -0.28, revealing that trading volume has concentrated during periods when UNI closed near the lower end of daily candles. This distribution of volume is a red flag, indicating that capital is actively leaving the market rather than accumulating at lower prices.
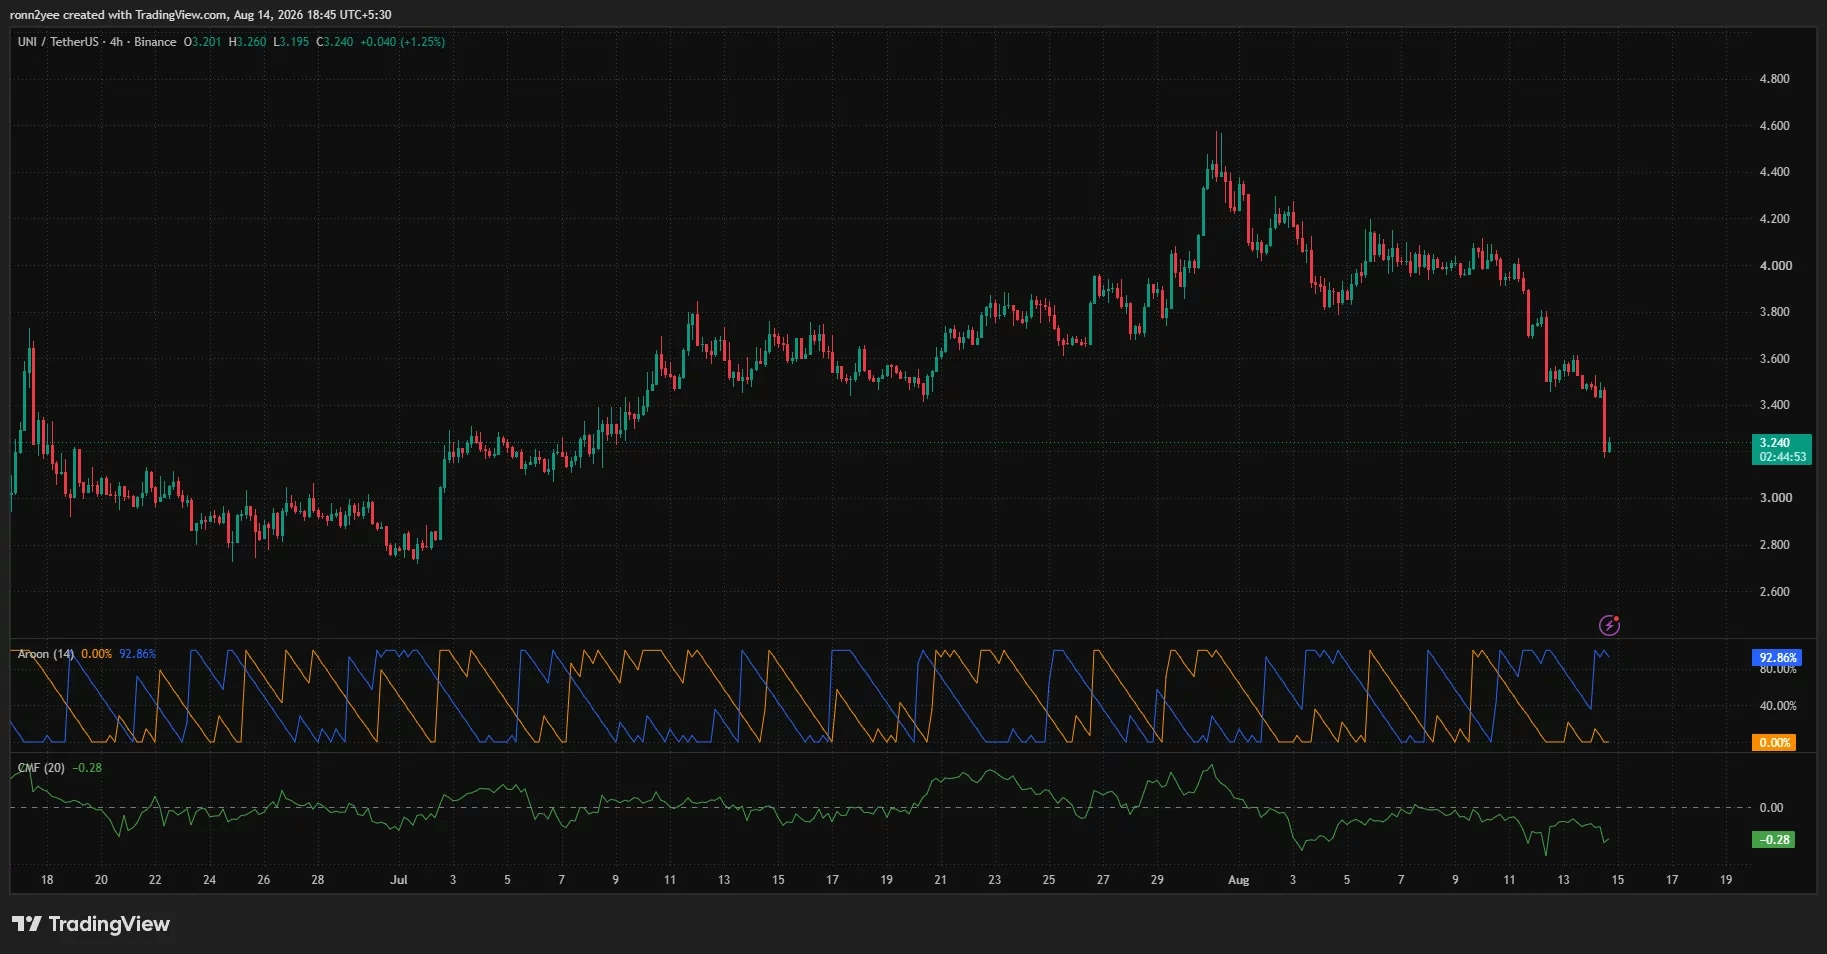
On the 4-hour timeframe, the Aroon indicators paint an equally bearish picture. Aroon Down has reached 92.86%, while Aroon Up sits at 0%, creating a massive separation that indicates recent lows are forming with far greater frequency than recent highs. This configuration keeps the short-term trend firmly pointed downward. Additionally, the Bear-Bull Power indicator registered -0.791 on the daily chart—its weakest reading across the displayed period—suggesting that sellers are forcing prices substantially below the short-term moving average rather than merely responding to temporary pullbacks.
⚡ Liquidation Cascades Amplifying the Decline
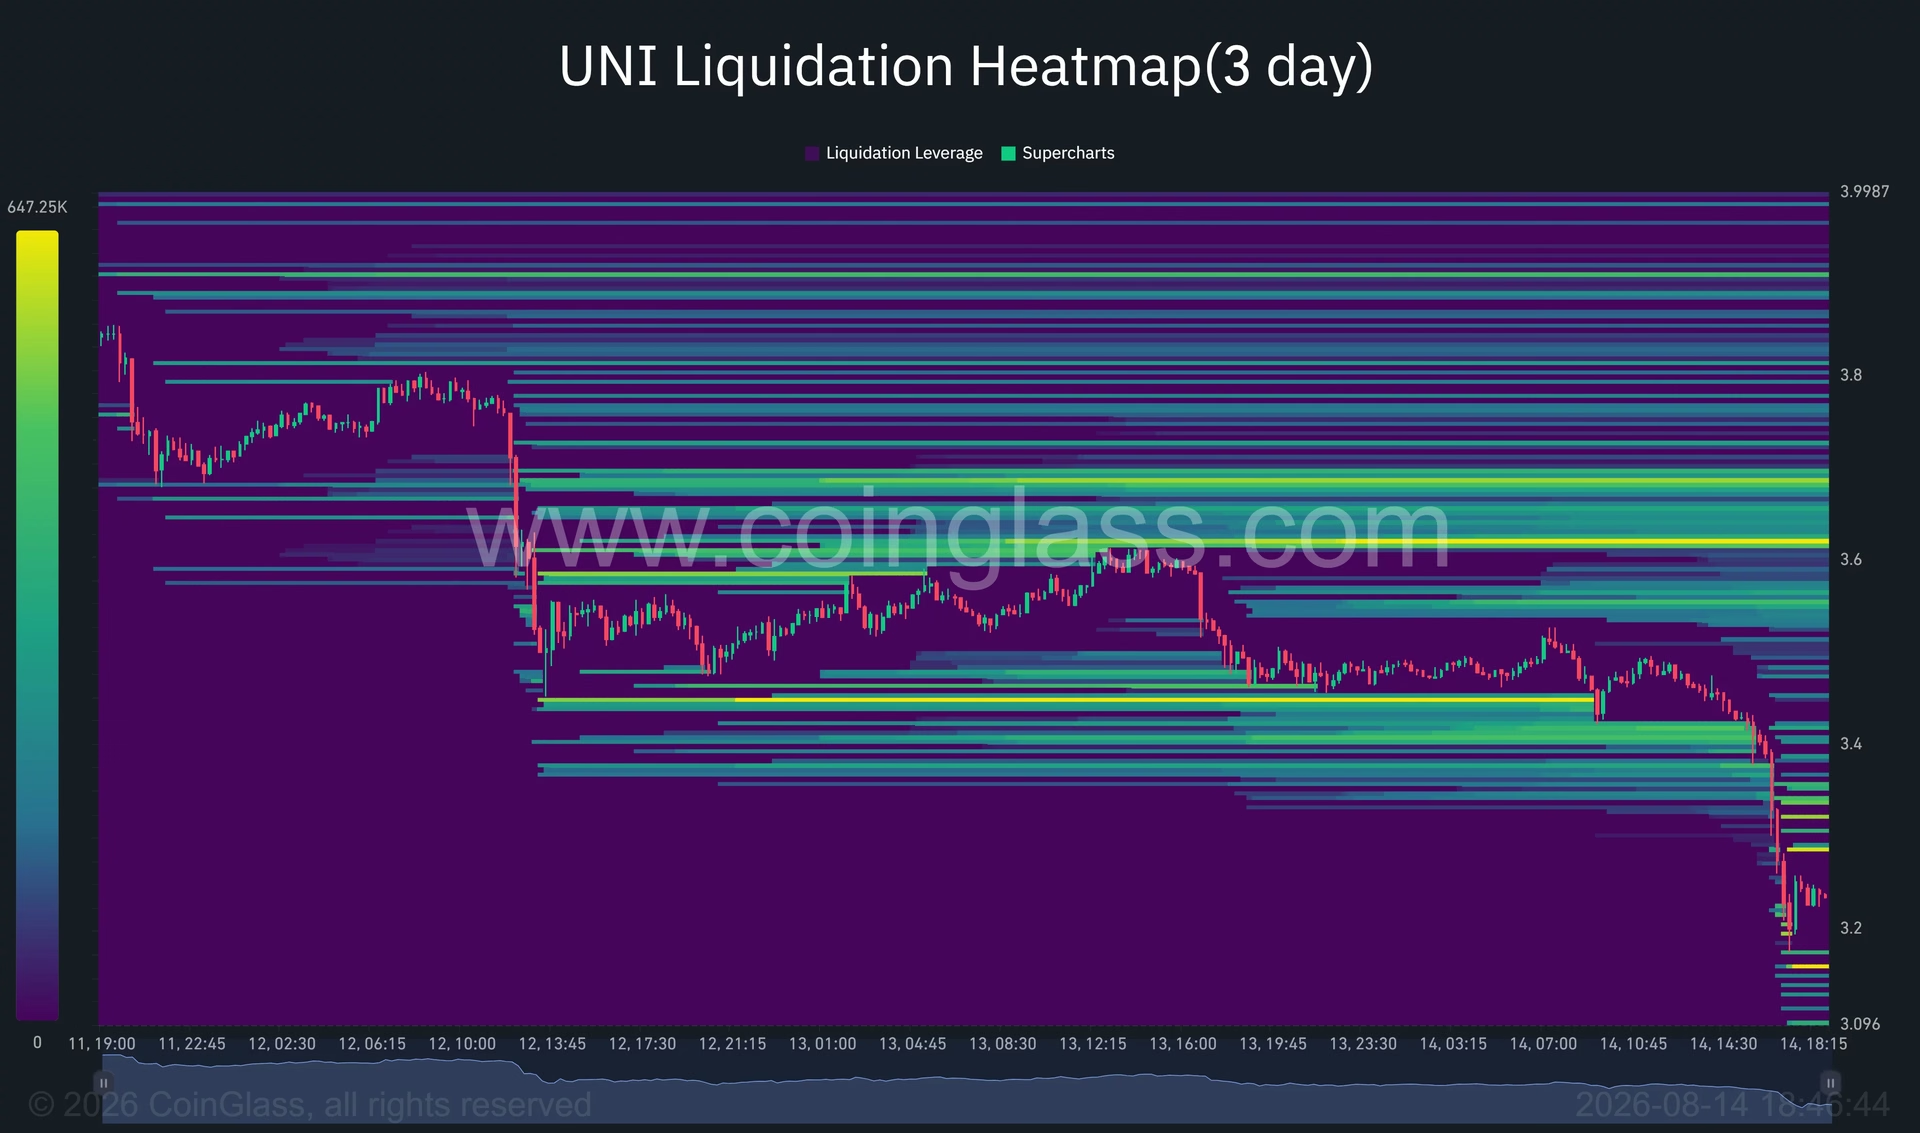
One of the most significant factors exacerbating UNI's decline has been the liquidation of leveraged long positions. As the token fell from above $3.80 on August 11 to nearly $3.20 by August 14, it passed through multiple zones containing concentrated leveraged positions. Sharp drops occurred around $3.60, $3.45, and $3.35 as these liquidation clusters were triggered.
The three-day liquidation heatmap reveals that substantial liquidity that had previously accumulated near $3.45 was cleared during the latest sell-off. UNI briefly dipped below $3.20 before stabilizing around $3.23, where nearby liquidation bands appear noticeably smaller than the dense clusters positioned above the current market price. This structural imbalance creates an asymmetric risk profile for traders considering counter-trend positions.
🎯 Key Price Levels and Recovery Scenarios
The immediate support range for UNI sits between the daily low of $3.17 and the 38.2% Fibonacci level at $3.19. Should the token hold this area, traders might anticipate an oversold bounce toward $3.40–$3.45, where the first notable liquidation cluster and former support converge. However, this bounce would face significant headwinds from the liquidation bands positioned above.
A move above $3.45 would bring $3.60–$3.65 into focus, though reclaiming this range would require clearing a dense group of liquidation levels. The 61.8% Fibonacci retracement at $3.72 represents the stronger technical barrier that bulls must overcome to begin repairing the damage visible on the daily chart. Additional liquidation liquidity clusters near $3.68 and extending toward $3.80 would further complicate any recovery attempt.
For the bullish case to gain credibility, UNI would need to close above $3.72 and recover the broken neckline near $3.90. This would represent a significant accomplishment, requiring the token to overcome multiple resistance zones and reverse the current negative momentum indicators. Below the current price, liquidation liquidity is considerably thinner, although smaller bands appear between $3.10 and $3.20. A clean breakthrough through that area could allow the price to accelerate toward the $3.00 target identified in the head-and-shoulders pattern analysis.
📈 Market Context and Altcoin Trends
UNI's current struggles reflect broader challenges facing decentralized finance (DeFi) tokens in the current market environment. While Uniswap remains the leading decentralized exchange by volume and liquidity, governance tokens like UNI have faced selling pressure as traders rotate capital toward higher-conviction narratives. The token's performance also highlights the ongoing debate about DeFi protocol tokenomics and the sustainability of governance token valuations.
Historically, UNI has demonstrated resilience during previous downturns, often finding support at round numbers and previous trading ranges. The $3.00 level carries psychological significance as a round number where institutional buyers have previously shown interest. However, the current technical setup suggests that reaching this level might be inevitable unless a substantial reversal occurs in the near term.
🔮 What's Next for Uniswap Price Action?
The next 48 to 72 hours will be critical in determining whether UNI can stabilize or if further downside awaits. The Stochastic RSI readings of 0.00 and 0.54 place the token deep in oversold territory, which historically can precede relief rebounds. However, oversold conditions alone do not confirm that the decline has ended, particularly when price continues recording lower highs and lower lows—the hallmark of an intact downtrend.
Traders should monitor the daily close relative to the $3.19 Fibonacci level closely. A hold above this level combined with positive money flow indicators could signal the beginning of a stabilization phase. Conversely, a breakdown below $3.17 would likely accelerate selling toward the $3.00 target. The liquidation heatmap suggests that any recovery attempt would face substantial resistance, making this a challenging environment for long positions without clear support confirmation.
💡 Key Takeaways
- UNI has declined 20% in seven days to $3.23, with a head-and-shoulders breakdown targeting $3.00
- Multiple technical indicators confirm bearish momentum, including negative Chaikin Money Flow and dominant Aroon Down readings
- Capital is actively leaving the market, as evidenced by volume concentration at lower price levels
- Liquidation clusters between $3.45–$3.65 could limit recovery, but also present potential short-squeeze opportunities
- Critical support sits at $3.19, with a breakdown potentially exposing $2.86 and $2.32
- Oversold conditions could precede a bounce, but trend confirmation would be required before considering meaningful reversals
The Uniswap price crash represents a significant technical breakdown that has triggered cascading liquidations and capital outflows. While oversold conditions might eventually produce a relief bounce, the overall technical structure remains bearish. Traders should exercise caution and wait for clear confirmation of a trend reversal before initiating new long positions. The $3.00 level remains the critical target for bears, while the $3.72 Fibonacci level represents the key barrier for bulls attempting to restore confidence in the token's near-term prospects. 🎬✨
You May Also Like

Altcoins
NCT Price Surge 200% on Upbit KRW Listing
August 26, 2026

Altcoins
WBT Reaches New All-Time High as Crypto Infrastructure Turns Institutional
August 26, 2026

Altcoins
Pi Network's August 24 Pricing Shakeup: End of Subsidized App Building
August 25, 2026

Altcoins
XRP Undervalued? Seven Spot ETFs & $1.4B Flows Tell
August 25, 2026