Category:
AltcoinsXRP Price Holds $1 as Whale Inflows Hit 2021 Lows

The Ripple-backed XRP token continues to hover near the critical $1 psychological barrier as major market participants pull back from exchange deposits at levels not seen since 2021. 🔍 This shift in whale behavior presents both challenges and opportunities for traders and investors monitoring the altcoin's next move.
Understanding the Whale Inflow Decline 📊
Recent on-chain analysis reveals a dramatic pullback in large XRP transfers to Binance, the world's largest cryptocurrency exchange. Three-month average whale inflows have plummeted to approximately $61 million—a staggering decline from the $456 million recorded in January 2025 and the $355 million observed in October 2025. This represents a six to eight-fold decrease from recent peaks, marking the lowest activity levels since 2021.
What does this mean for XRP price dynamics? Reduced whale deposits typically signal fewer tokens available for immediate sale, which could theoretically reduce selling pressure. However, analysts emphasize that this metric alone cannot confirm a bullish reversal without accompanying demand increases. The net flow remains positive at $18.8 million, indicating that large withdrawals still exceed deposits—a nuanced signal requiring deeper market context.
Current Market Conditions: Holding at a Crucial Level 💰
XRP has stabilized around the $1.00 mark after experiencing a 3.2% decline over the past seven days. The token's market capitalization stands at approximately $62.8 billion with nearly $900 million in daily trading volume. Since August 11, the price has repeatedly tested both sides of the $1 level, dipping to approximately $0.988 before bouncing back to $1.01.
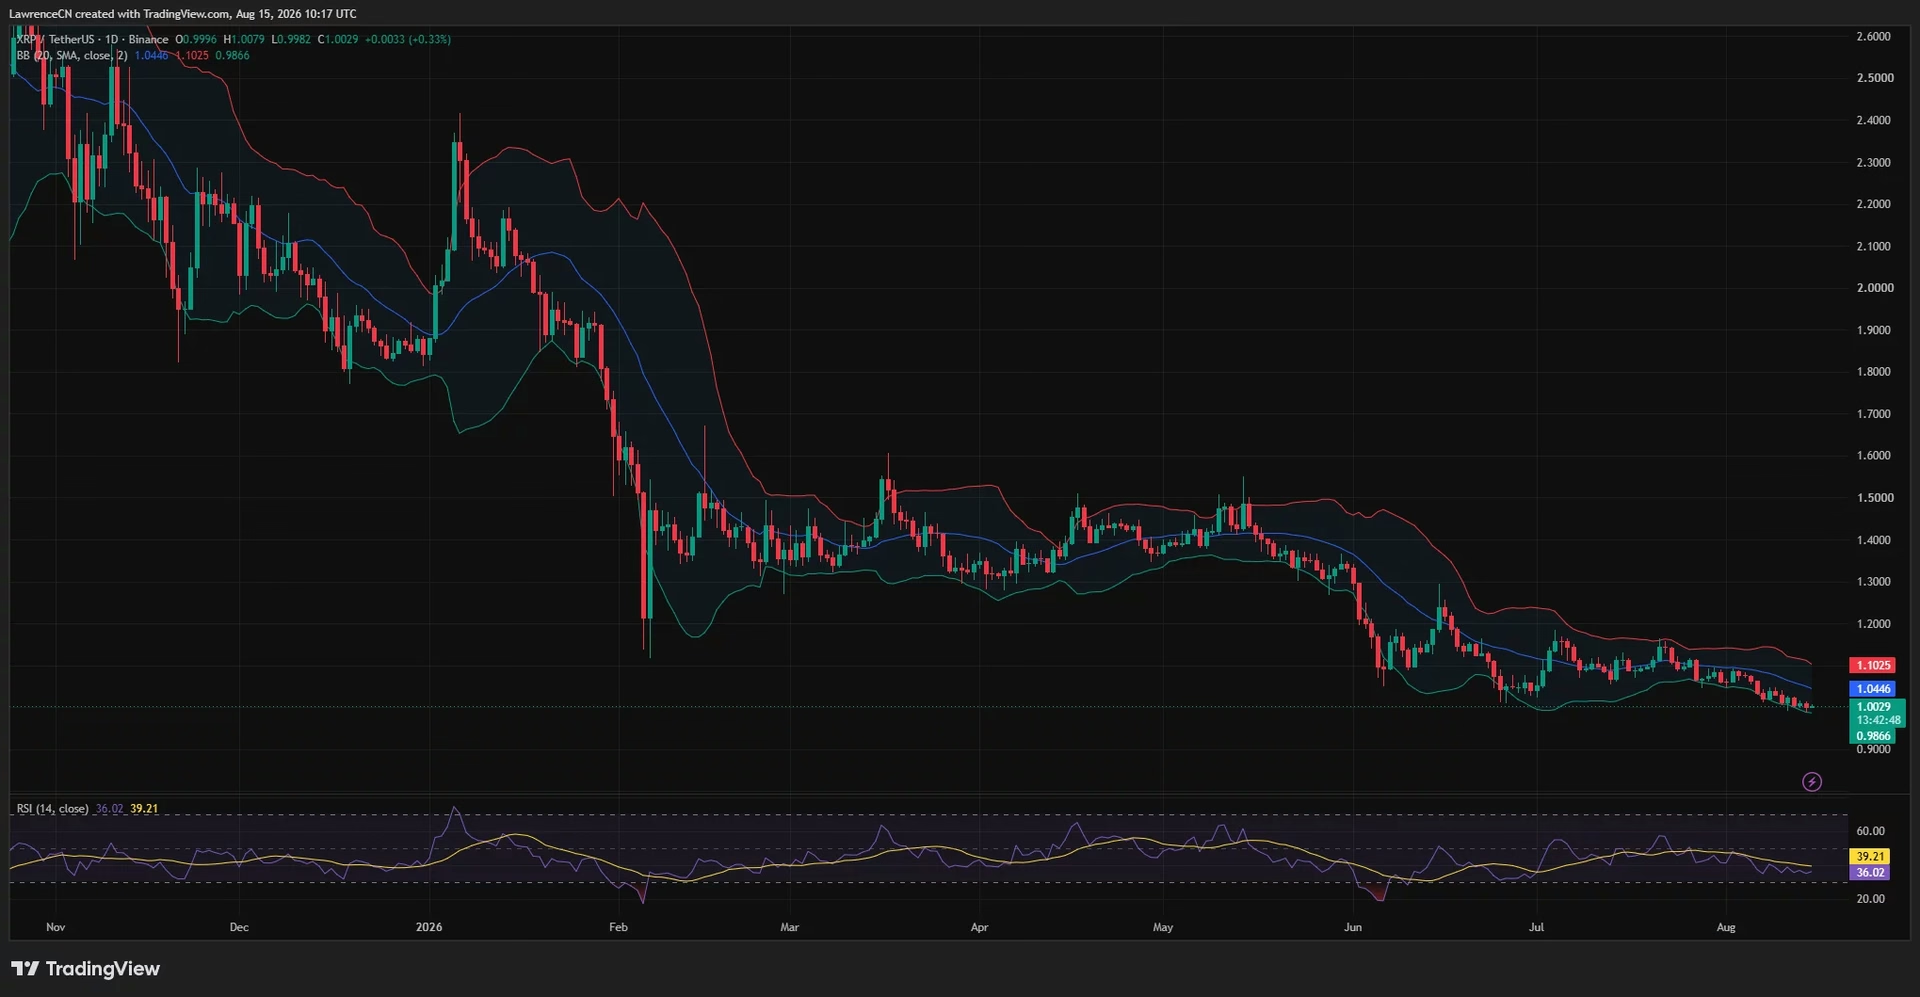
This narrow trading range reflects broader market indecision. While the whale inflow decline suggests reduced immediate selling pressure, the technical indicators paint a more cautious picture. The daily relative strength index (RSI) remains weak at 36.02, hovering below the signal average of 39.21. Though this reading stays above the conventional oversold threshold of 30, it demonstrates that momentum remains subdued without extreme positioning yet.
Technical Analysis: The Daily Chart Tells a Cautious Story 📈
XRP's daily chart structure continues to favor sellers despite the reduced whale activity. The token trades below the Bollinger Bands' 20-day middle line at $1.0446, with the lower band positioned at $0.9866. This positioning keeps the short-term technical structure tilted toward the downside.
A critical break would occur if XRP closes below the $0.9866 lower Bollinger Band, which would weaken the $1 support case and potentially expose the area around $0.95. The chart has not yet established a clear daily reversal pattern, with lower highs and lower lows continuing from XRP's May peak—a bearish structure that suggests caution remains warranted.
For a meaningful recovery, buyers must first reclaim the Bollinger middle line near $1.045. If price closes above this level with increased trading activity, the upper band at $1.1025 becomes the next technical target. The narrow distance between the current price and the lower band also creates possibilities for a short-term corrective bounce, though such moves would require breaking above the declining daily average to signal genuine reversal.
The 4-Hour Chart: A Falling Wedge Setup Emerges 🎯
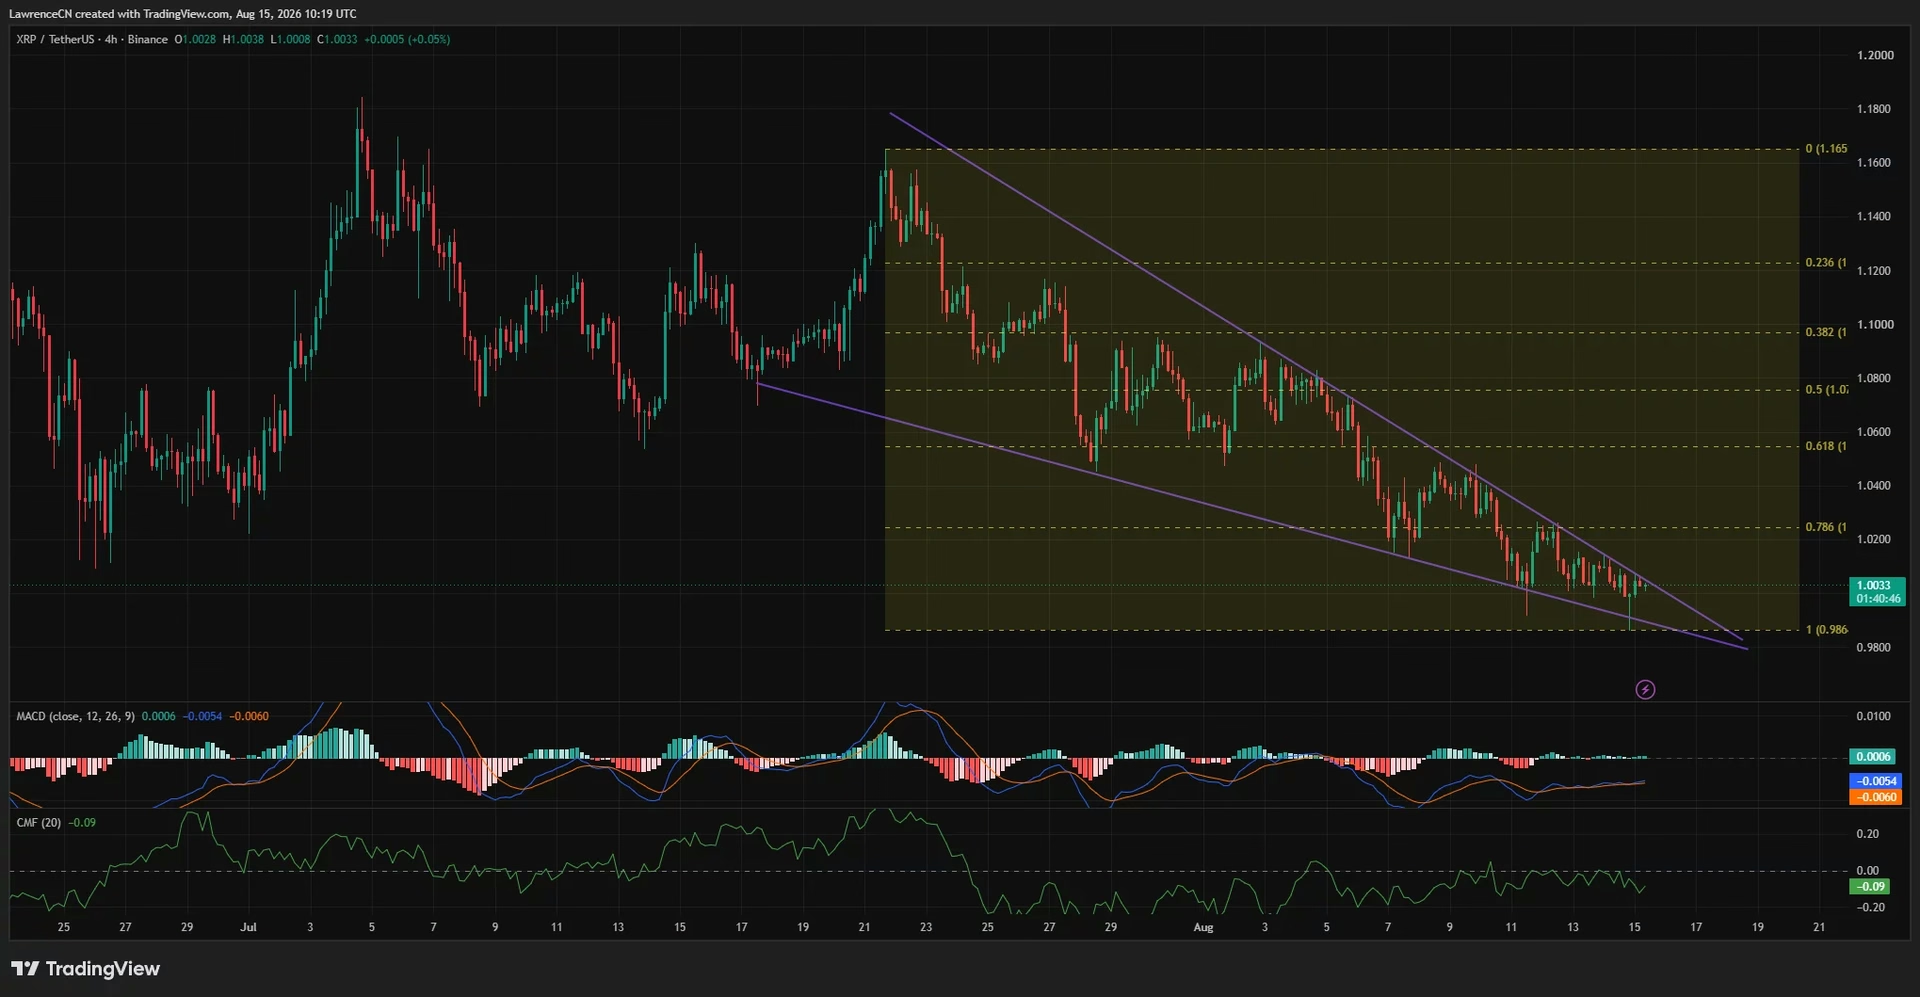
On shorter timeframes, a more constructive pattern has formed. XRP has moved inside a falling wedge structure that developed after the July 21 high near $1.165. As the two descending trendlines converge, a breakout becomes increasingly likely as the available trading range contracts.
The first nearby resistance sits at the 78.6% Fibonacci retracement around $1.024. Breaking above the wedge and this level would open a path toward $1.055, followed by $1.076. Higher resistance appears near $1.097 and $1.123, with the July high around $1.165 representing the ultimate challenge if the recovery gains momentum.
Momentum indicators on the 4-hour timeframe show early signs of improvement. The MACD line stands near minus 0.0054, above the signal line at minus 0.0060, with the histogram turning slightly positive at 0.0006. This crossover points to easing downside momentum rather than a confirmed trend change, as both lines remain below zero. The Chaikin Money Flow remains negative at minus 0.09, confirming that capital flows still favor sellers.
A wedge breakout accompanied by CMF moving above zero would provide firmer evidence that buyers are returning. Conversely, failure to leave the wedge could push XRP back toward $0.986, with a confirmed 4-hour close below the lower trendline invalidating the recovery setup and increasing the risk of moves toward $0.98 or $0.95.
Liquidation Clusters: Roadmap for the Rebound 🗺️
One-week liquidation heatmaps reveal several leveraged-position clusters that could influence XRP's near-term price action. The nearest liquidity concentration sits around $1.01, followed by larger pockets between $1.02 and $1.03. The strongest overhead concentrations appear near $1.03 and from approximately $1.045 to $1.05.
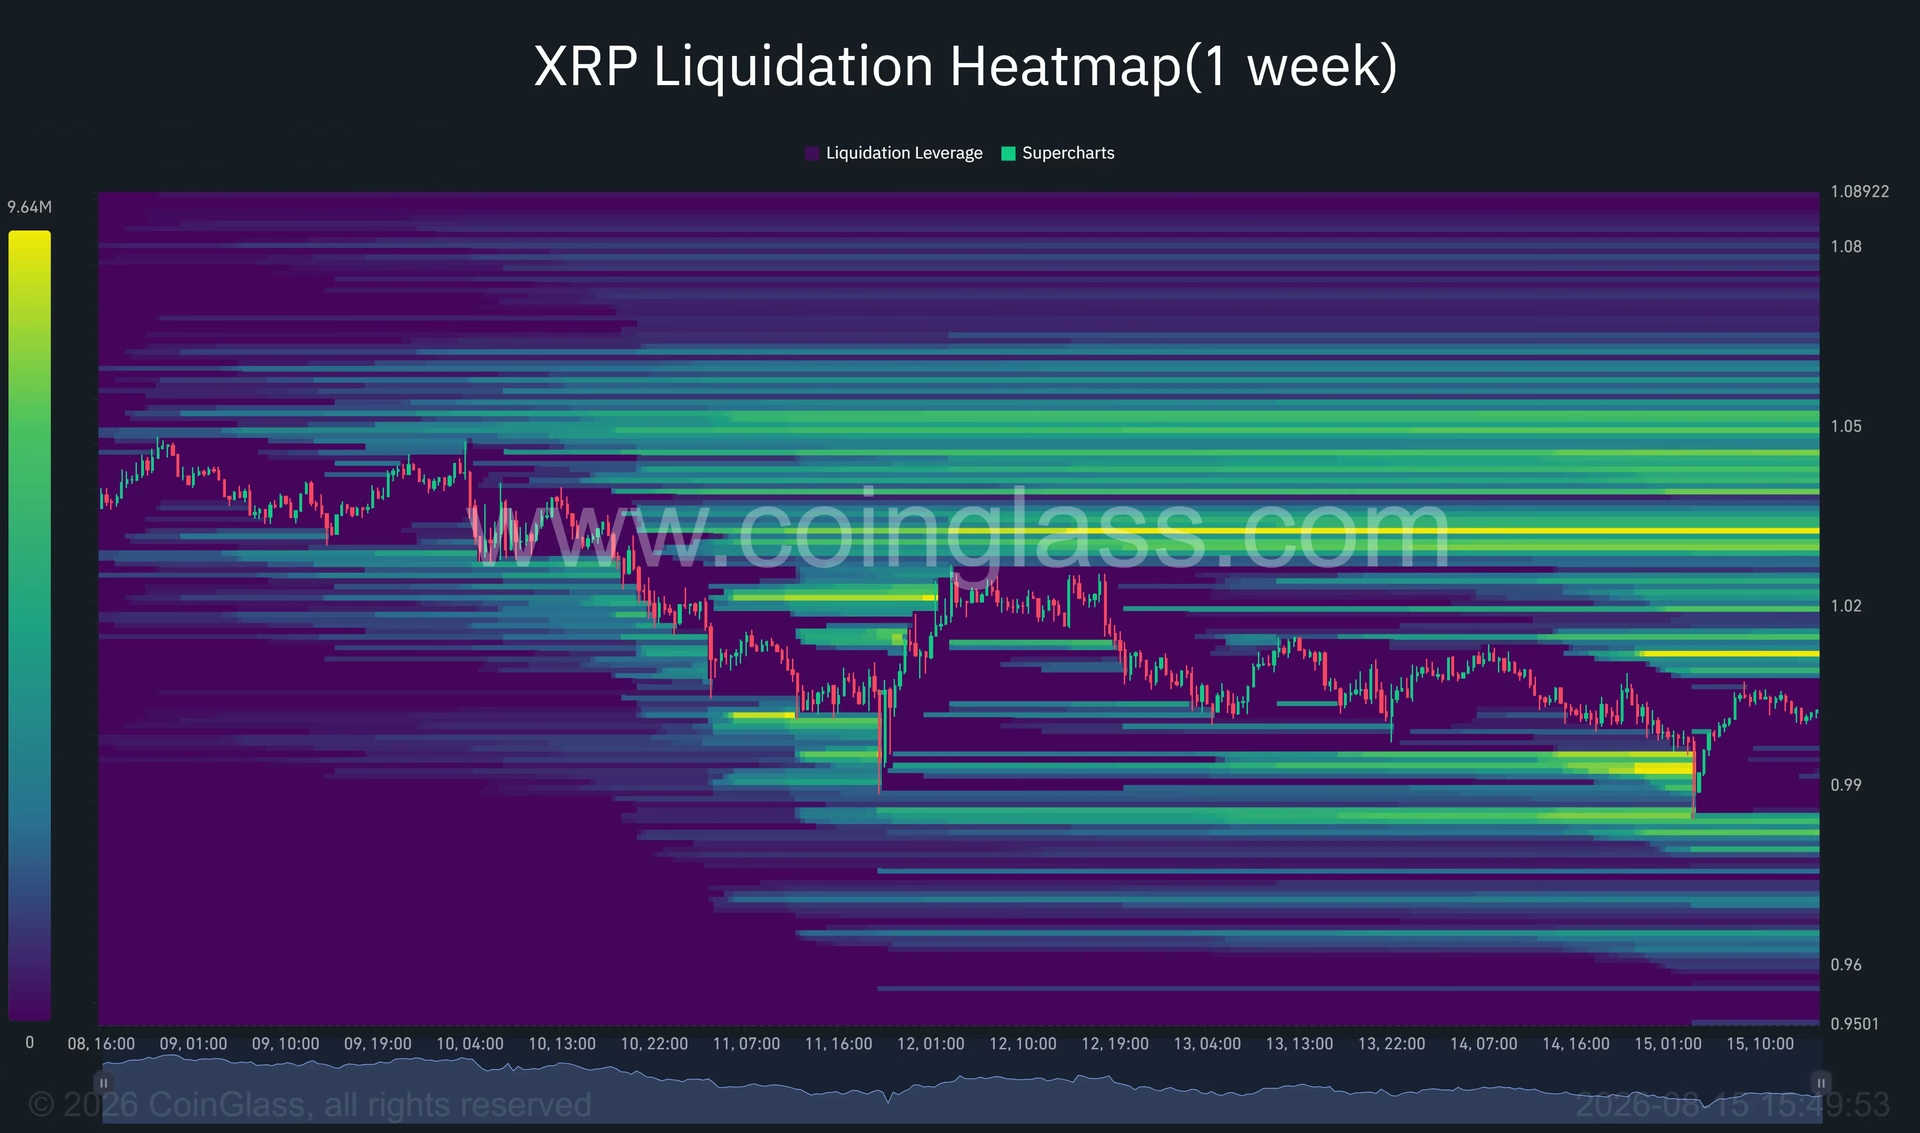
Price often accelerates toward areas holding large leveraged positions as liquidations cascade. A rebound could therefore accelerate rapidly as short liquidations trigger across these levels. This dynamic creates an asymmetric risk-reward scenario—if buyers can push through $1.024, momentum could build quickly toward $1.045-$1.05 as trapped shorts exit positions.
Additional liquidity below the market exists near $0.98 to $0.99. A loss of the $1 level could therefore pull XRP toward that zone before buyers receive another opportunity to defend the daily lower Bollinger Band. During weekend trading when liquidity thins, sudden moves around the $1 level become more probable.
Broader Market Context: Exchange Inflows and Trading Volume 🌐
The decline in XRP whale inflows fits a market-wide trend affecting multiple altcoins. Across the cryptocurrency ecosystem, exchange inflows have declined and trading volume has contracted as selling pressure fades before demand has fully recovered. This suggests the XRP weakness reflects broader market conditions rather than token-specific challenges.
Historically, such periods of reduced whale activity and exchange deposits have preceded significant recoveries. When large holders pull capital from exchanges, it typically signals confidence in holding positions long-term rather than immediate liquidation intentions. However, this positive interpretation requires validation from increasing retail and institutional demand before a sustained rally can develop.
Can XRP Rebound from Here? The Path Forward 🚀
The question investors are asking centers on whether current conditions support a meaningful rebound. The evidence presents a mixed picture:
Positive Factors:
- Whale inflows at 2021 lows suggest reduced immediate selling pressure
- 4-hour falling wedge structure provides a technical setup for breakout
- Liquidation clusters above current price could accelerate upside moves
- RSI remains above oversold threshold, leaving room for reversal
- Net flows remain positive despite reduced whale activity
Cautionary Factors:
- Daily chart structure remains bearish with lower highs and lows
- RSI weakness indicates subdued momentum
- Chaikin Money Flow remains negative, showing sellers still control flows
- No clear daily reversal pattern has established yet
- Price needs to break above multiple technical barriers for confirmation
Key Levels to Monitor 📍
For traders and investors, several price levels deserve close attention:
- $0.986: Immediate downside boundary; break here weakens $1 support
- $0.95: Secondary support if $0.986 fails
- $1.00: Psychological barrier and current price anchor
- $1.024: First technical sign of breaking the month-long decline
- $1.045: Bollinger middle line; key resistance for recovery confirmation
- $1.055-$1.076: Secondary resistance levels in wedge breakout scenario
- $1.165: July high representing ultimate challenge
The Bottom Line: Patience Required ⏳
While the decline in Binance whale inflows removes one significant source of selling pressure, the technical picture and on-chain metrics reach the same conclusion: XRP requires fresh buying demand before a lasting recovery can materialize. The falling wedge on the 4-hour chart offers an intriguing setup, and liquidation clusters above current price could accelerate upside moves if buyers successfully push through resistance.
However, the daily chart's bearish structure and weak momentum indicators suggest caution remains warranted. The next few trading sessions will prove critical—a confirmed break above $1.024 followed by $1.045 would signal genuine reversal momentum. Until then, XRP remains in a holding pattern, balanced between the potential for a corrective bounce and the risk of retesting lower support levels.
For investors monitoring this altcoin, the reduced whale inflows represent a positive development that removes one headwind, but they don't guarantee recovery. The market will ultimately require evidence of increasing demand before XRP can establish a sustainable move higher. Watch the $1.024 level closely—it will reveal whether the technical setup is gaining traction or if XRP faces another test of lower support.
You May Also Like

Altcoins
NCT Price Surge 200% on Upbit KRW Listing
August 26, 2026

Altcoins
WBT Reaches New All-Time High as Crypto Infrastructure Turns Institutional
August 26, 2026

Altcoins
Pi Network's August 24 Pricing Shakeup: End of Subsidized App Building
August 25, 2026

Altcoins
XRP Undervalued? Seven Spot ETFs & $1.4B Flows Tell
August 25, 2026