Category:
Market AnalysisEthereum Price May Drop to $1,650: Bearish Signs Loom

Ethereum, the second-largest cryptocurrency by market cap, is currently facing a challenging period as it eyes a potential drop to $1,650. The formation of a bearish rounding-top pattern is a key factor in this scenario, adding to the downward pressure on Ethereum's price.
Understanding the Bearish Rounding-Top Pattern 📉
The rounding-top pattern is a technical analysis indicator that suggests a reversal from a bullish to a bearish trend. In Ethereum's case, this pattern has formed on the 4-hour chart, indicating a potential decline in price. The pattern emerged after Ethereum's recent recovery stalled near $1,830, unable to sustain upward momentum.
Key Technical Levels
Ethereum recently fell below the critical $1,750 support level after failing to break above the 50-day Exponential Moving Average (EMA) near $1,800. This EMA has been a significant resistance point, converging with the daily Supertrend indicator.
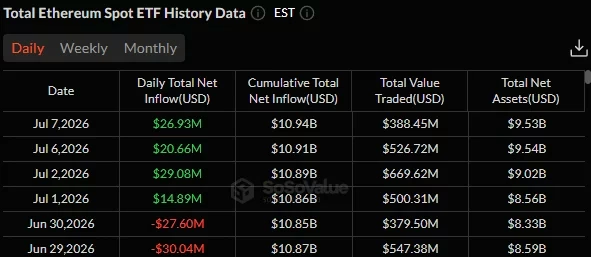
Momentum indicators further highlight the bearish outlook. The 4-hour Relative Strength Index (RSI) has dropped to around 44, moving away from overbought territory. Similarly, the Moving Average Convergence Divergence (MACD) remains below its signal line, with expanding negative histogram bars. These factors suggest that sellers might maintain control, pushing Ethereum toward the $1,650 target.
Geopolitical and Economic Context 📊
The broader economic environment has also influenced Ethereum's price dynamics. Geopolitical tensions, notably between the U.S. and Iran, have led to increased oil prices, reviving inflation concerns. This, in turn, has pushed up Treasury yields, affecting risk assets, including cryptocurrencies. As technology stocks retreat, the crypto market is also witnessing a downward trend.
Institutional and Spot Demand
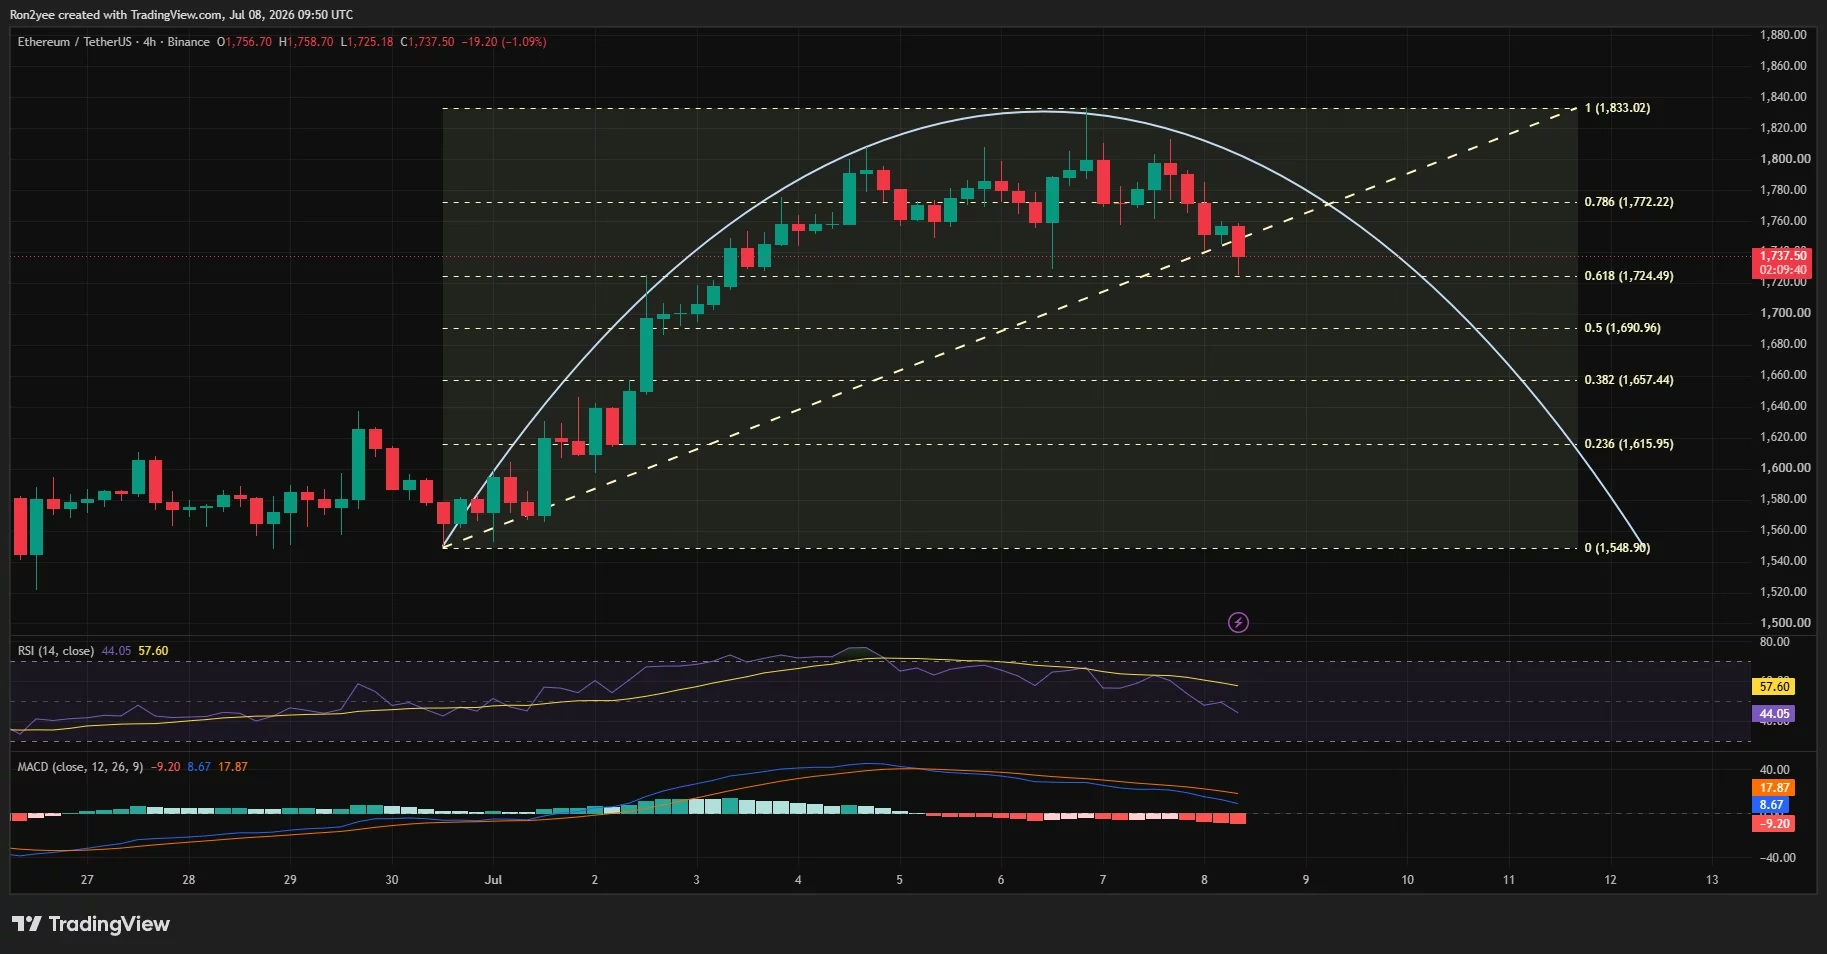
Despite the bearish technical indicators, Ethereum has seen positive developments in terms of institutional demand. U.S. spot Ethereum Exchange-Traded Funds (ETFs) have recorded four consecutive days of net inflows. Additionally, the Coinbase Premium index has shown signs of recovery, indicating improved institutional interest.
Derivatives Market Insights
The derivatives market provides a mixed picture of Ethereum's current state. Analyst Rain notes that Ethereum's recent price increase has been driven predominantly by spot buying rather than leveraged speculation. The leverage ratio has not recovered from June levels, suggesting that the recent bounce is due to genuine demand rather than speculative trading.
Critical Support and Resistance Levels 🔍
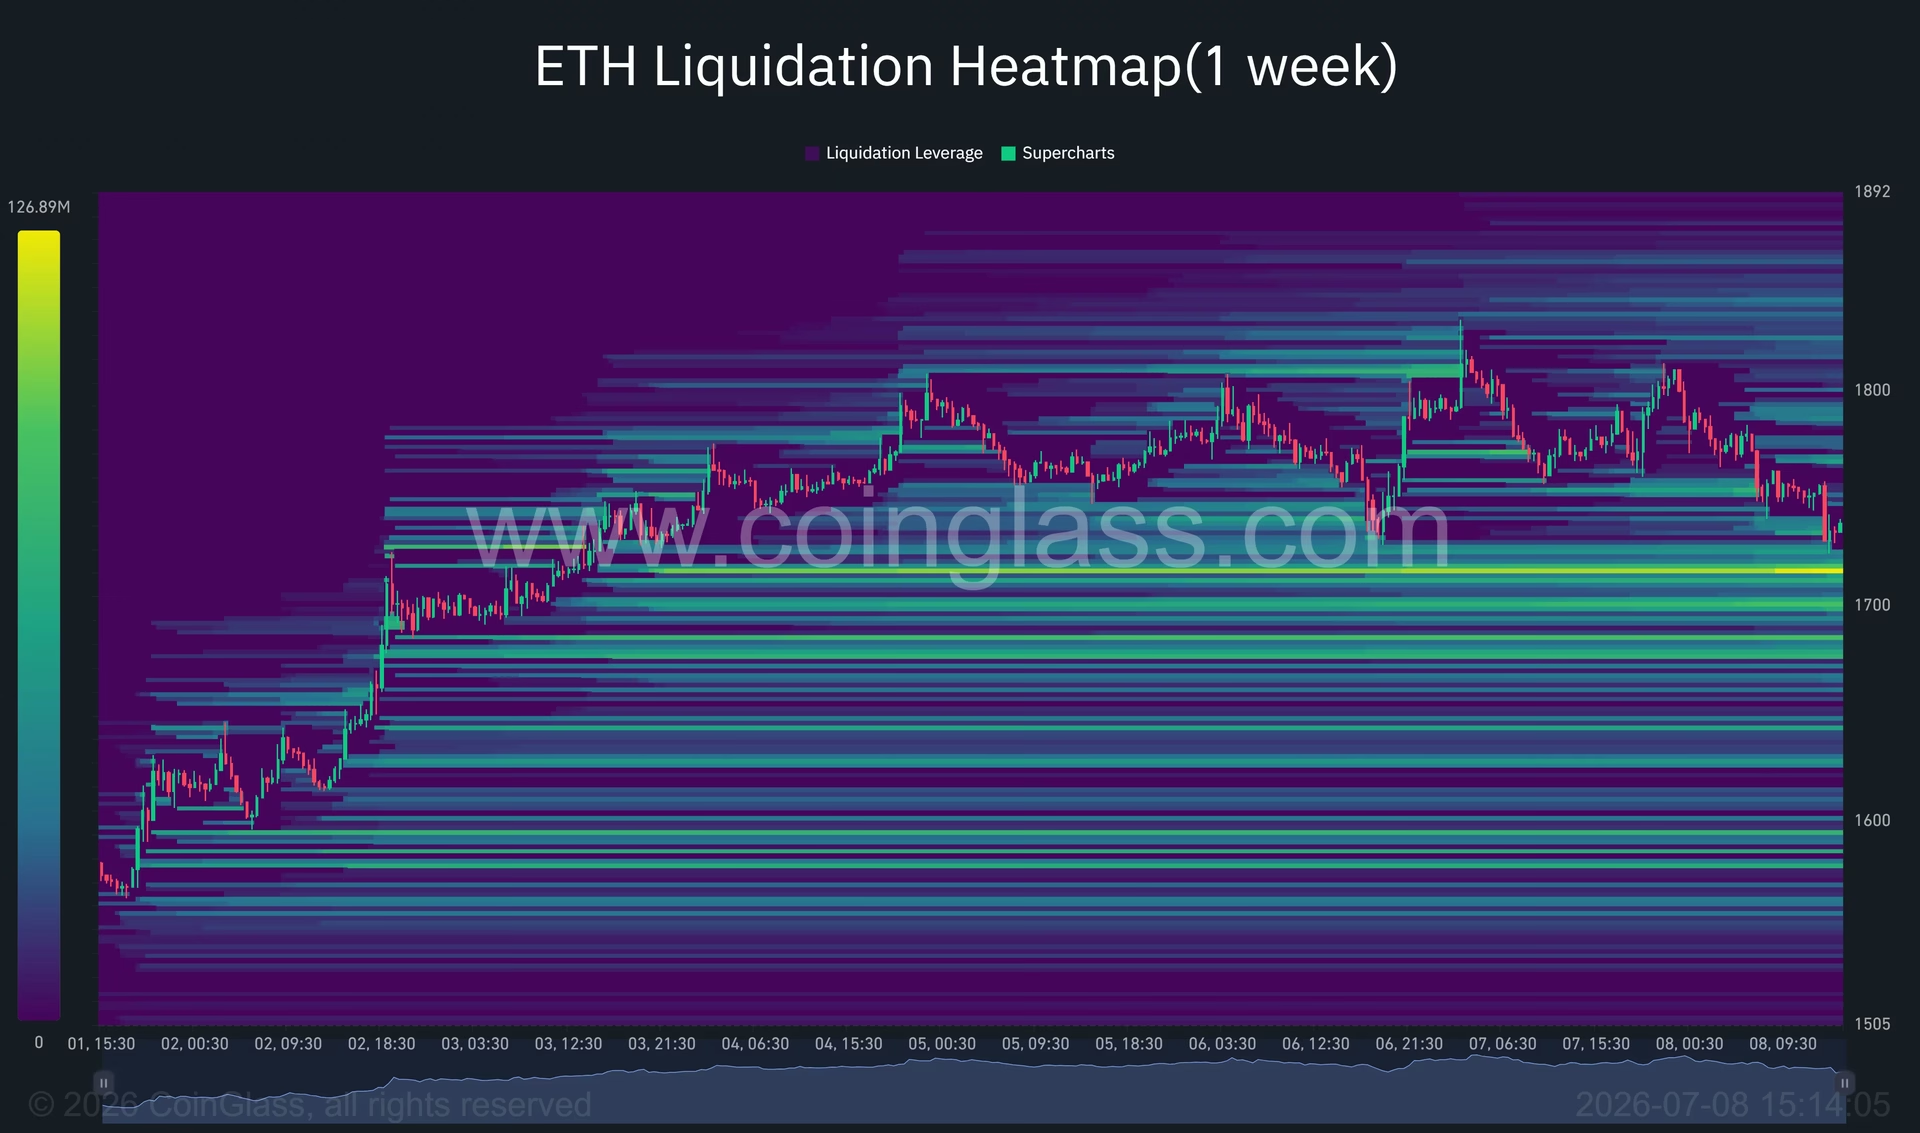
Ethereum's price action is closely tied to several critical support and resistance levels. A decisive break below the $1,700-$1,720 support zone could trigger another wave of liquidations, accelerating the decline toward $1,650. CoinGlass data indicates a large concentration of leveraged long positions within this range, further highlighting its importance.
Path to Recovery
For Ethereum to invalidate the bearish setup, it needs to reclaim the $1,800-$1,806 resistance area. A breakout above this zone could shift focus back to recent highs near $1,833 and potentially lead to an attempt at the psychological $1,900 level. Continued ETF inflows and a return of leverage in the futures market would support this bullish scenario.
Conclusion: Navigating Uncertainty
Ethereum's journey toward $1,650 underscores the volatile nature of the cryptocurrency market. While technical patterns suggest a bearish trend, institutional interest and spot demand offer a glimmer of hope. Traders and investors should remain vigilant, monitoring key support and resistance levels and broader market conditions. The interplay between technical indicators and geopolitical factors will continue to shape Ethereum's price trajectory in the coming weeks.
As always, this analysis is for educational purposes and does not constitute investment advice. Stay informed and make decisions based on comprehensive research and market analysis.
You May Also Like

Market Analysis
XRP Price Falls 5% as Leverage Hits Seven-Month High
August 26, 2026

Market Analysis
Crypto Market Hits Extreme Greed: What This Means for Bitcoin
August 26, 2026

Market Analysis
Ethereum Price Rally Overheats Below $2,550 Resistance
August 26, 2026

Market Analysis
Hyperliquid Price Rally: HYPE Targets $97 Amid $80 Support
August 25, 2026