Category:
Market AnalysisBitcoin Rebounds to $63,600: Can BTC Break $65,500?

Bitcoin's Recovery Attempt: What's Happening Right Now 📈
Bitcoin has staged a modest recovery, climbing to approximately $63,600 after finding critical support near $62,700. This 1.2% daily gain represents a temporary reprieve for bulls, but significant headwinds remain in place. The question on every trader's mind is whether this bounce has the momentum to push through the $65,500 resistance level—a move that would signal a genuine trend reversal.
The recovery wasn't driven by explosive institutional buying or breakthrough developments in the crypto space. Instead, it reflected short-term traders defending a well-established support zone that has proven its staying power throughout July and August. This distinction matters because it suggests the current rally may face resistance from overhead liquidity clusters that have repeatedly stalled previous attempts to climb higher.
Technical Momentum Shows Mixed Signals ⚙️
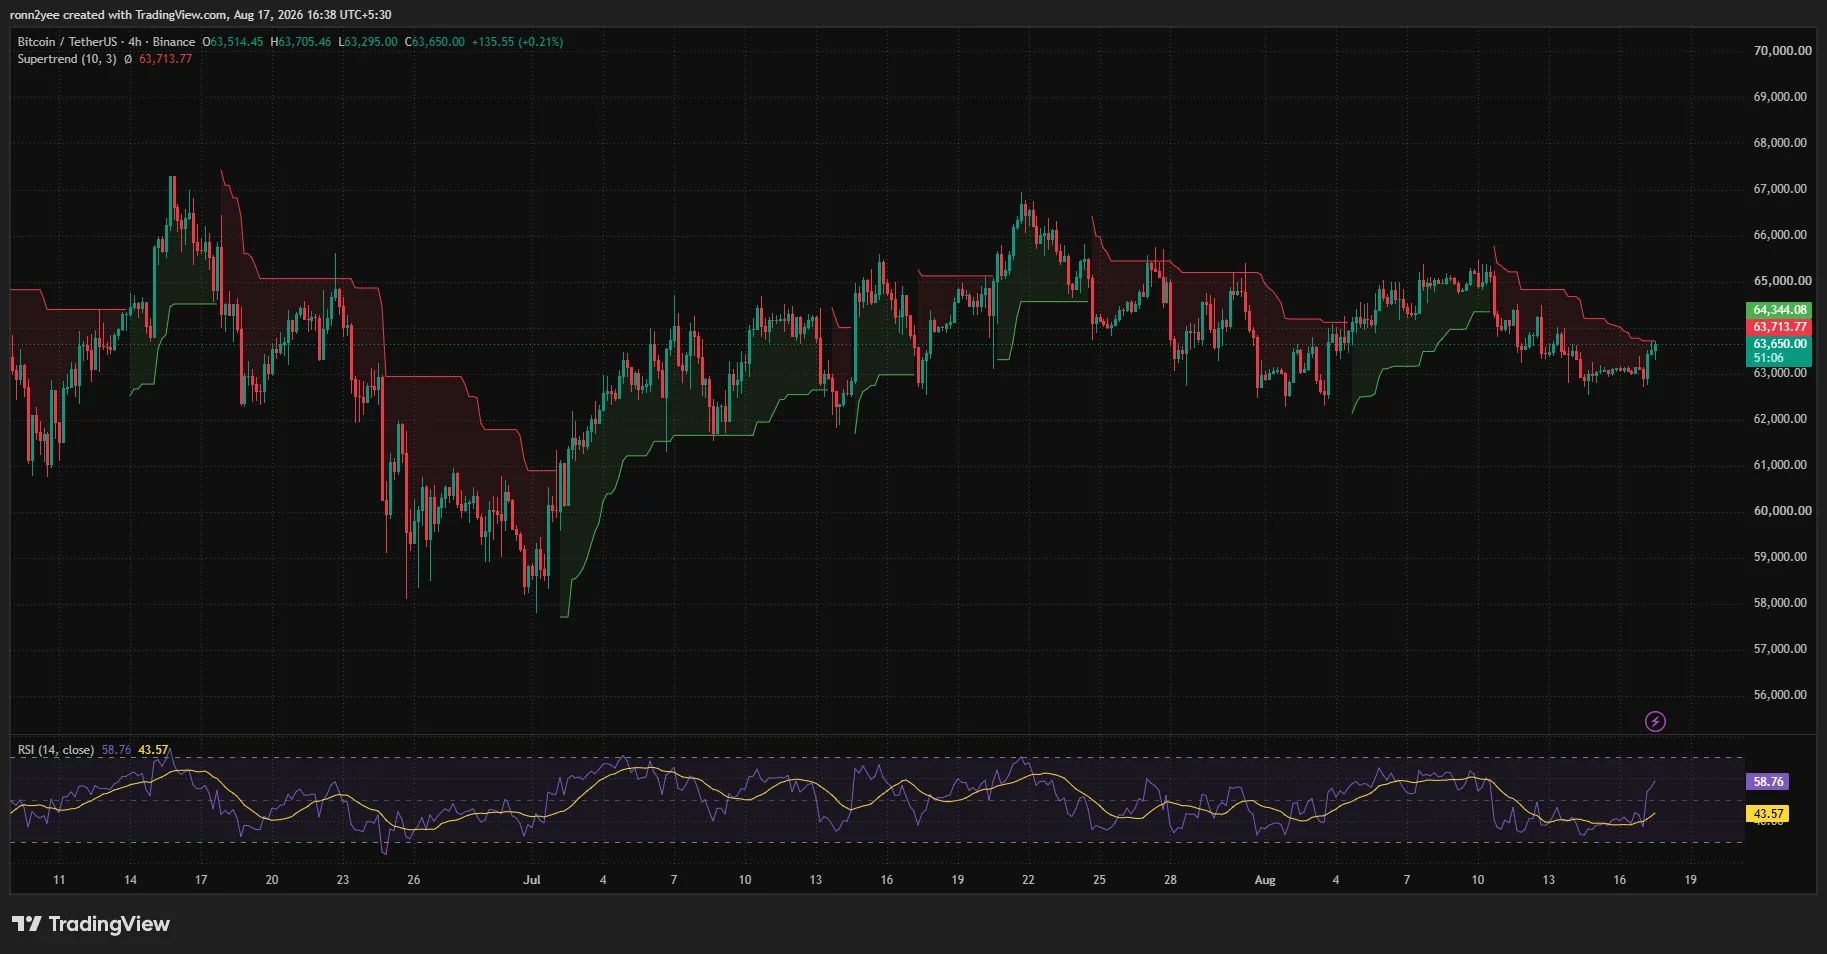
The 4-hour relative strength index (RSI) improved to 58.76, crossing above the neutral 50 level—a development that typically indicates buying momentum has gained the upper hand. However, the signal average remained stuck at 43.57, suggesting that this momentum improvement lacks conviction. Bitcoin still needs to hold its recovery through multiple consecutive 4-hour closes to establish genuine strength.
The Supertrend indicator reveals another complication. Bitcoin was trading just below the indicator's resistance line near $63,714, with another critical level standing at $64,344. Breaking through both of these thresholds would give bulls meaningful control and bring the early-August highs back into play. Failure to clear these zones would leave the market vulnerable to another test of $63,000, and potentially deeper declines toward $62,200.
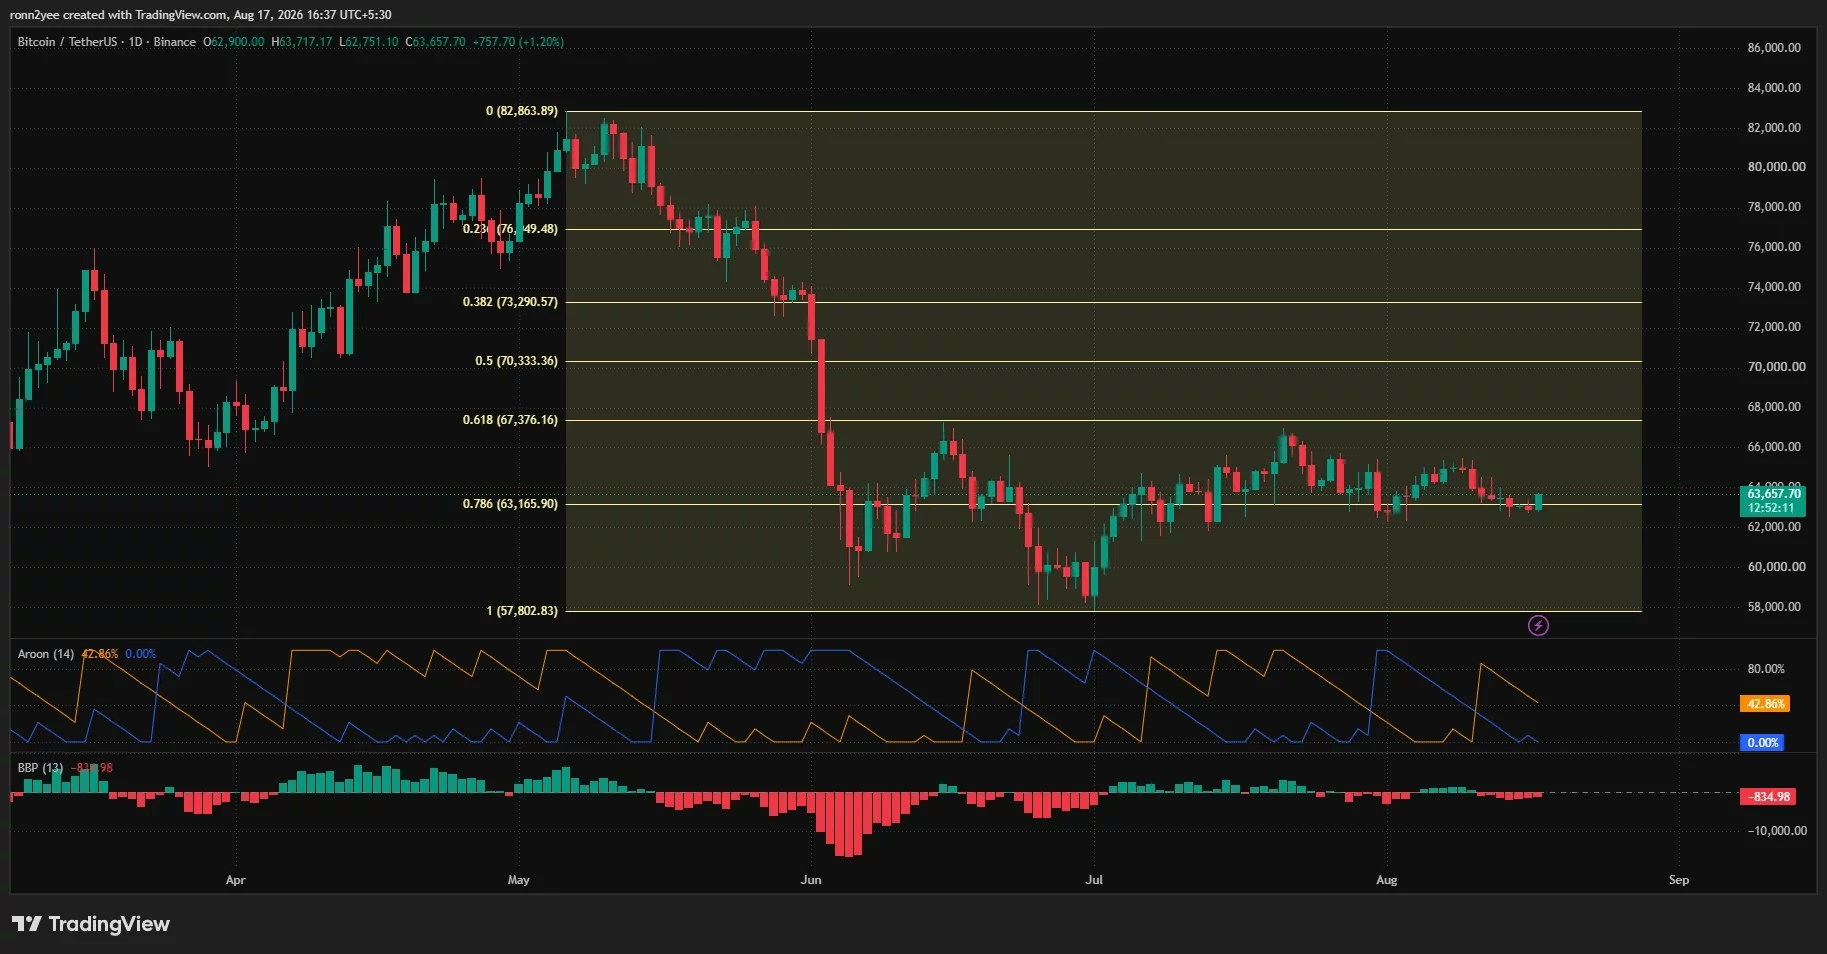
The broader daily chart paints a cautious picture. The Aroon Up indicator registered 0%, indicating that Bitcoin hasn't recently established a meaningful new high. Bear Bull Power remained negative at -834.98, suggesting sellers retain a structural advantage on the daily timeframe despite the intraday gains. This technical backdrop explains why institutional participants remain hesitant to commit significant capital to the rally.
ETF Outflows Signal Institutional Caution 💼
Perhaps the most telling indicator of institutional sentiment comes from US spot Bitcoin exchange-traded funds. These products recorded approximately $389.71 million in combined net outflows during the week of August 10-14—a sharp reversal after the strongest inflow week since April. The weekly outflows broke down as follows:
- Monday: $144.67 million withdrawn
- Wednesday: $61.16 million withdrawn
- Thursday: $131.13 million withdrawn
- Friday: $57.63 million withdrawn
This pattern suggests that institutional investors have lost confidence in the current rally. After a brief period of optimism in early August, large investors began systematically reducing their Bitcoin exposure. Continued redemptions from these products could make it substantially harder for Bitcoin to sustain a move above $65,000, as institutional demand typically provides the firepower needed to break through major resistance levels.
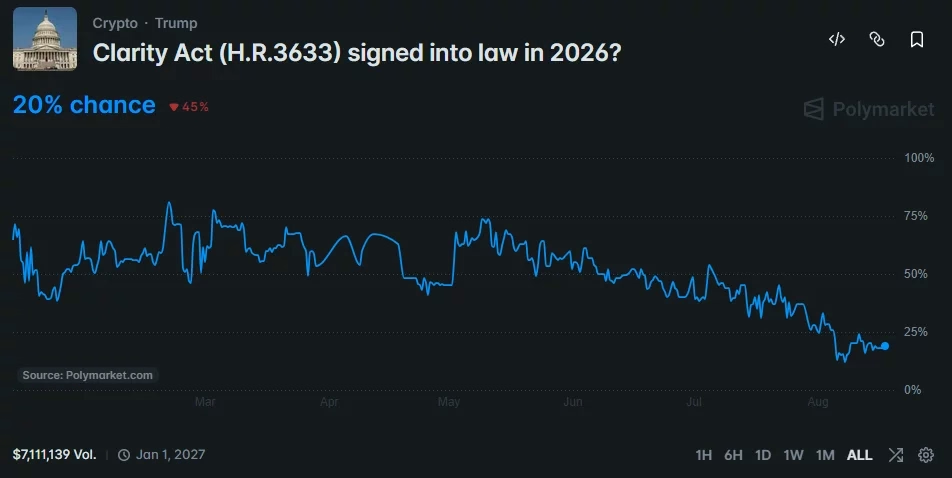
The weakness in ETF inflows also reflects deteriorating expectations around US regulatory clarity. Polymarket traders assigned the CLARITY Act—proposed legislation intended to establish clear rules for cryptocurrency markets—only a 20% probability of passage in 2026, down dramatically from above 80% earlier in the year. The Senate's failure to advance this market structure legislation before its recess signaled that crypto remains a lower priority for lawmakers. While regulatory developments don't directly determine Bitcoin's price, they influence institutional appetite for exposure.
Liquidity Clusters Define the Battle Zones 🎯
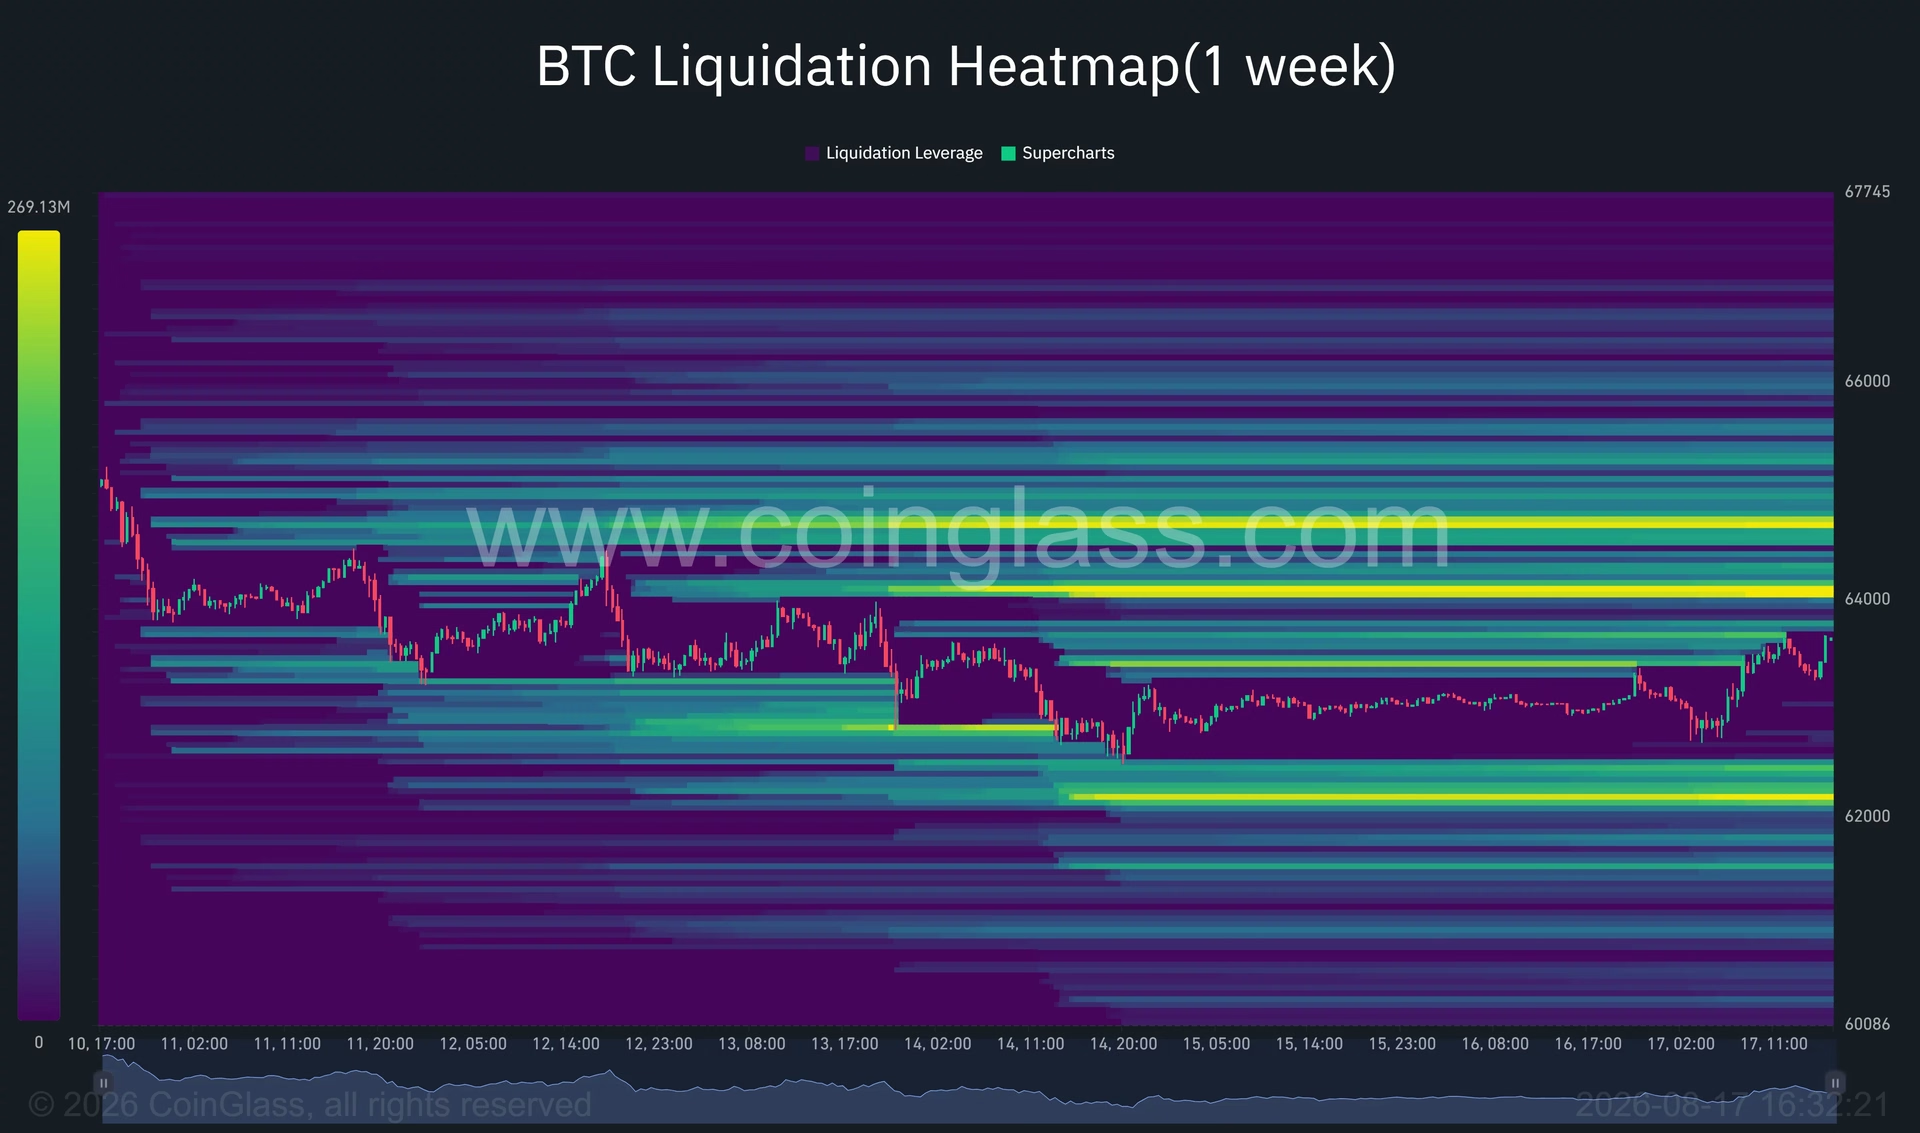
Understanding where Bitcoin's price will likely encounter resistance requires examining liquidity concentration patterns. The one-week liquidation heatmap reveals critical information about where leveraged traders have positioned their stop orders and liquidation points.
The nearest major liquidity band sits around $64,000–$64,200, representing the first serious hurdle for bulls attempting to extend their gains. A significantly larger and brighter cluster appears between $64,700 and $64,900—a zone where price action often experiences notable friction. Additional heavy concentrations of positions exist above $65,000, suggesting that if Bitcoin reaches that level, it could trigger cascading liquidations that accelerate the move higher.
Conversely, a large downside liquidity cluster near $62,200–$62,300 poses a threat if Bitcoin loses the $62,700 support level. Price often migrates toward areas with heavy liquidity because these zones contain stop orders and forced liquidation points. If the market breaks down through current support, the $62,200 area would likely become the next battleground before bulls get another opportunity to defend the broader range.
This liquidity structure creates the potential for sharp, unexpected price swings even within a stable daily range. The wide separation between major liquidation zones means Bitcoin could experience 3-5% moves in either direction as price discovers these liquidity clusters.
The $65,500 Level: Bitcoin's Critical Threshold 🔑
Market analysts have identified $65,500 as the level Bitcoin must reclaim to establish genuine bullish momentum. Breaking above this resistance would represent a meaningful shift in the market's technical structure and could attract fresh institutional capital. Until Bitcoin demonstrates the ability to sustain a position above $65,500, the broader downtrend from May's peak remains intact.
The path to $65,500 requires Bitcoin to first clear the $64,200 resistance, then navigate through the substantial liquidity cluster between $64,700 and $64,900. If Bitcoin successfully breaks $64,200, forced closures of short positions could accelerate the move toward $64,800 and ultimately $65,500. This scenario would represent the most bullish outcome for the current recovery.
However, the alternative scenario deserves equal attention. If Bitcoin fails to hold $62,700, the market could decline toward the $62,200–$62,300 liquidity zone before finding buyers again. A more severe breakdown would expose the $59,000–$60,000 region, with the daily swing low near $57,800 representing the larger bearish reference point. The $61,900 level has been identified as the main downside threshold that would confirm a shift toward deeper losses.
Macro Tailwinds Provide Limited Support 🌍
Bitcoin's recovery benefited from broader market dynamics that extended beyond cryptocurrency. US equity futures, particularly technology shares, led a risk-asset rebound that provided some tailwind for Bitcoin. Lower expectations for aggressive Federal Reserve rate increases also supported demand, as lower interest rates typically reduce the opportunity cost of holding non-yielding assets like Bitcoin.
The US dollar fell to a 10-day low as Treasury yields eased, creating a more favorable environment for dollar-denominated assets. However, elevated bond yields continue to represent a structural headwind, as investors can earn meaningful returns from government securities without assuming cryptocurrency's volatility. This dynamic explains why Bitcoin remains vulnerable to sudden selloffs whenever risk appetite deteriorates or yields spike higher.
What Traders Should Watch Going Forward 👀
The coming days will prove critical for determining whether Bitcoin's recovery has staying power. Several key developments warrant close monitoring:
Resistance Navigation: Watch whether Bitcoin can clear and hold the $63,714 level on the 4-hour chart, followed by the $64,344 zone. These sequential breaks would build confidence that the recovery has genuine momentum.
ETF Flow Reversal: Monitor US spot Bitcoin ETF flows closely. A return to positive inflows would signal that institutional investors are regaining confidence in the rally. Continued outflows would suggest institutional caution remains elevated.
Liquidity Zone Interaction: Observe how Bitcoin behaves when approaching the $64,000–$64,200 liquidity cluster. Sharp reversals or extended consolidation at these levels would indicate that liquidation points are exerting downward pressure.
Macro Conditions: Track developments in US monetary policy expectations and equity market sentiment. Risk-off periods typically trigger Bitcoin selloffs, while periods of improving risk appetite can support rallies.
The Bottom Line: Cautious Optimism With Caveats ✨
Bitcoin's recovery to $63,600 represents a meaningful technical improvement from the $62,700 lows, but substantial obstacles remain before bulls can declare victory. The combination of ETF outflows, weak daily chart indicators, and heavy overhead liquidity suggests that reaching $65,500 will require sustained buying pressure that institutional investors haven't yet demonstrated.
The technical setup favors a cautious approach. While short-term momentum has improved on the 4-hour chart, the daily timeframe continues to show structural weakness. Traders should view the current rally as a bounce within a broader downtrend rather than the beginning of a new bull phase. Only a decisive break above $65,500 combined with positive ETF flows would justify a more constructive outlook.
For now, Bitcoin remains caught in a critical zone where the next major move could extend in either direction. Success at $65,500 would open the door to $66,000 and beyond, while failure would likely trigger another test of the $62,200 support level. Patience and disciplined risk management remain essential as this critical technical battle unfolds.
You May Also Like

Market Analysis
XRP Price Falls 5% as Leverage Hits Seven-Month High
August 26, 2026

Market Analysis
Crypto Market Hits Extreme Greed: What This Means for Bitcoin
August 26, 2026

Market Analysis
Ethereum Price Rally Overheats Below $2,550 Resistance
August 26, 2026

Market Analysis
Hyperliquid Price Rally: HYPE Targets $97 Amid $80 Support
August 25, 2026