Category:
Market AnalysisXRP Price Loses $1 Support: Sellers Target $0.98

🔴 XRP Faces Critical Test as Buyers Struggle at Psychological $1 Level
Ripple's XRP token has entered a precarious phase in its market cycle, with sellers maintaining firm control as the cryptocurrency briefly dipped below the psychologically significant $1 threshold. 📉 Over a seven-day period, XRP experienced a 2.8% decline, reflecting broader weakness in daily momentum, consistent capital outflows, and a deteriorating technical landscape that has left bulls scrambling for footing.
The current price action represents far more than a routine pullback. With XRP having surrendered approximately 73% from its cycle peak above $3, the token now finds itself testing one of the most critical support zones in its recent trading history. This level carries outsized importance because it serves as both a psychological barrier and a technical inflection point that could determine whether the selling pressure continues or reverses.
📊 The Broader Downtrend: From $2 Glory to Current Struggles
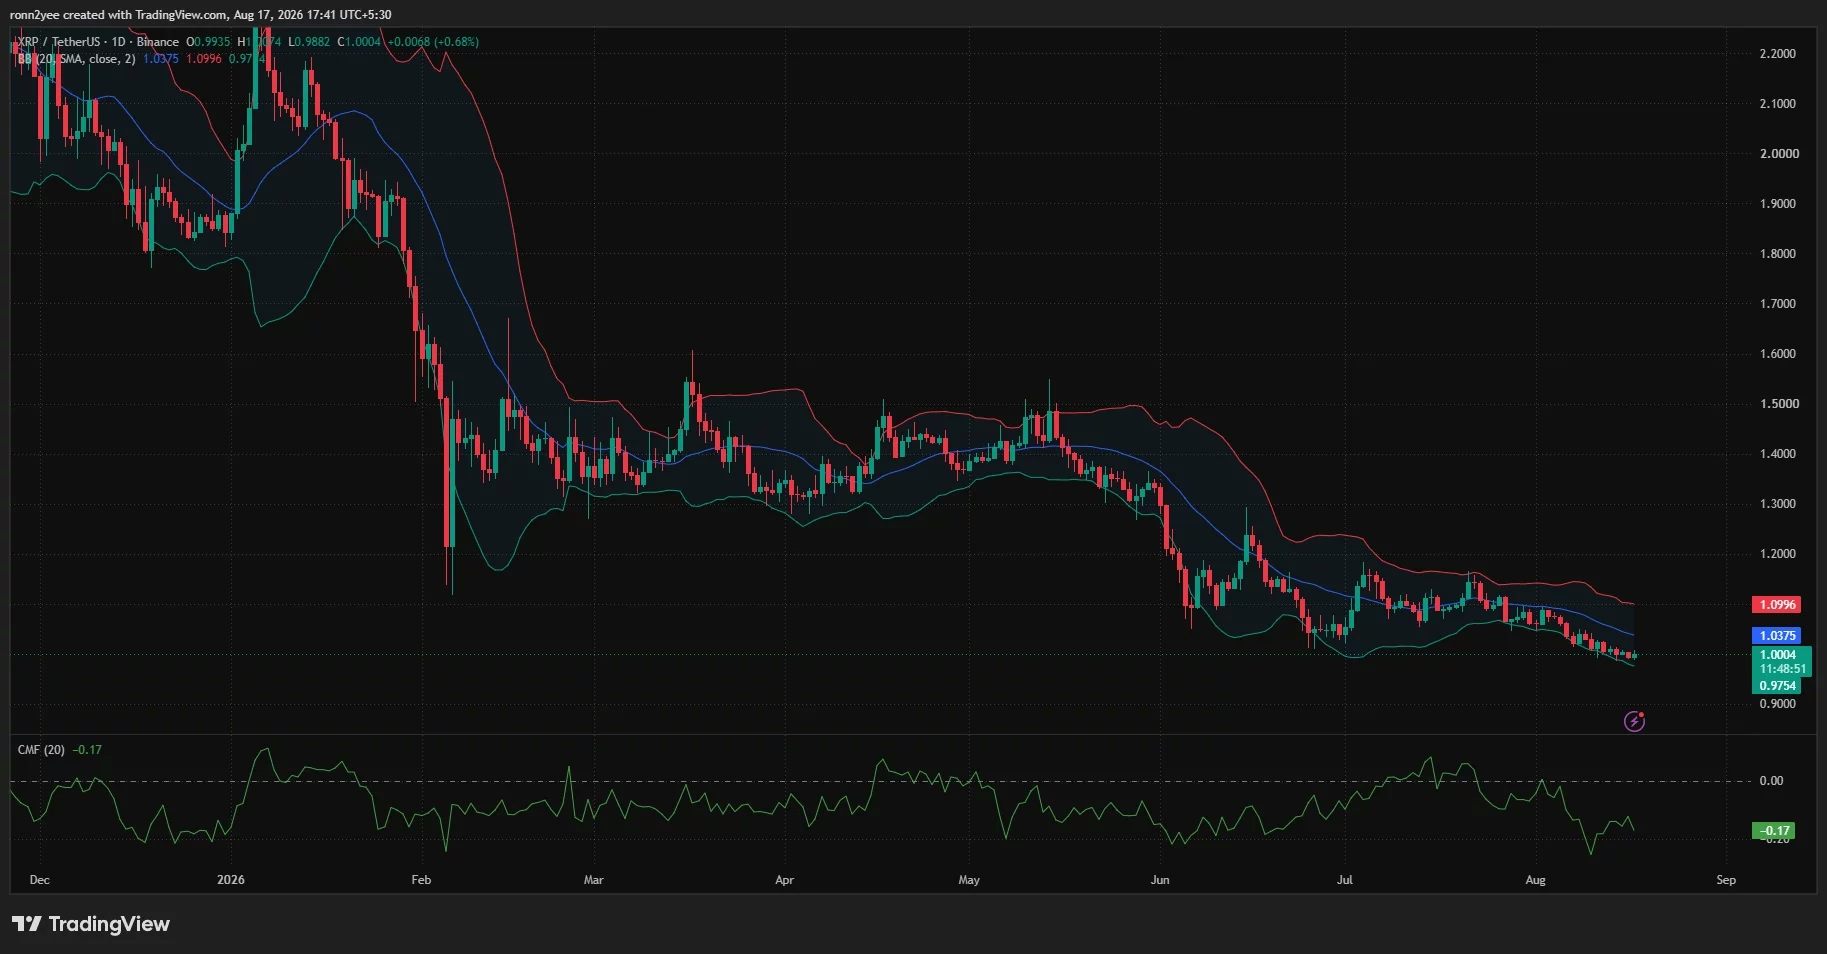
Understanding XRP's current predicament requires examining the token's journey over recent months. The decline accelerated dramatically during the first half of August, when XRP plummeted from approximately $1.14 to a low near $0.98 in just weeks. While a modest recovery subsequently pushed the price back toward $1.00, buyers have consistently failed to establish a sustained daily close above nearby resistance levels.
This extended weakness traces its roots back further. After trading above $2 in January—a level that once seemed achievable as a floor—XRP fell sharply to approximately $1.40 in February. The token then consolidated through May before resuming its decline in June, establishing a pattern of lower highs and lower lows that technical analysts view as deeply bearish.
The psychological impact cannot be understated. Each failed attempt to reclaim higher ground erodes investor confidence and attracts fresh selling pressure from traders looking to exit positions before further deterioration occurs.
🎯 Technical Indicators Paint a Concerning Picture
Daily Bollinger Bands reveal the extent of XRP's downside momentum. The token currently trades below the middle band near $1.037, a critical level that acts as a short-term trend gauge. For XRP to demonstrate even modest improvement, it must reclaim this middle band while simultaneously establishing buying volume support.
The upper Bollinger Band sits near $1.099, creating a wider resistance zone spanning $1.04 to $1.10. Notably, XRP has not successfully traded above the upper end of this range since early August, when an attempt to hold around $1.14 collapsed under selling pressure. This failure represents a critical technical breakdown that suggests resistance remains formidable.
On the downside, the lower Bollinger Band is positioned at approximately $0.975—dangerously close to current price levels. When price approaches the lower band, it typically indicates the market has become stretched toward the downside. While lower-band contact can occasionally precede temporary bounces, it does not guarantee that the broader decline has concluded.
The Chaikin Money Flow indicator delivers perhaps the most troubling signal. Trading at -0.17 on the daily chart, this reading sits firmly in negative territory, indicating that selling volume has substantially outweighed buying volume over the past 20 trading sessions. This persistent negative money flow undermines the case for a sustainable recovery, as any rallies receive limited support from fresh capital inflows.
💧 Lower Market Participation Amplifies Volatility
One factor exacerbating XRP's weakness is diminished market participation. With fewer buyers actively absorbing sell orders, relatively modest selling pressure can produce outsized price swings around critical support levels like $1. This dynamic creates a vicious cycle: reduced participation attracts more selling, which further discourages buyers, leading to even wider volatility.
This environment proves particularly challenging for long-term holders and accumulation-focused investors. The lack of sustained buying interest means that even modest rallies face resistance, while breakdowns accelerate as stop-losses trigger in quick succession.
4️⃣ Short-Term Bounce Signals on 4-Hour Charts
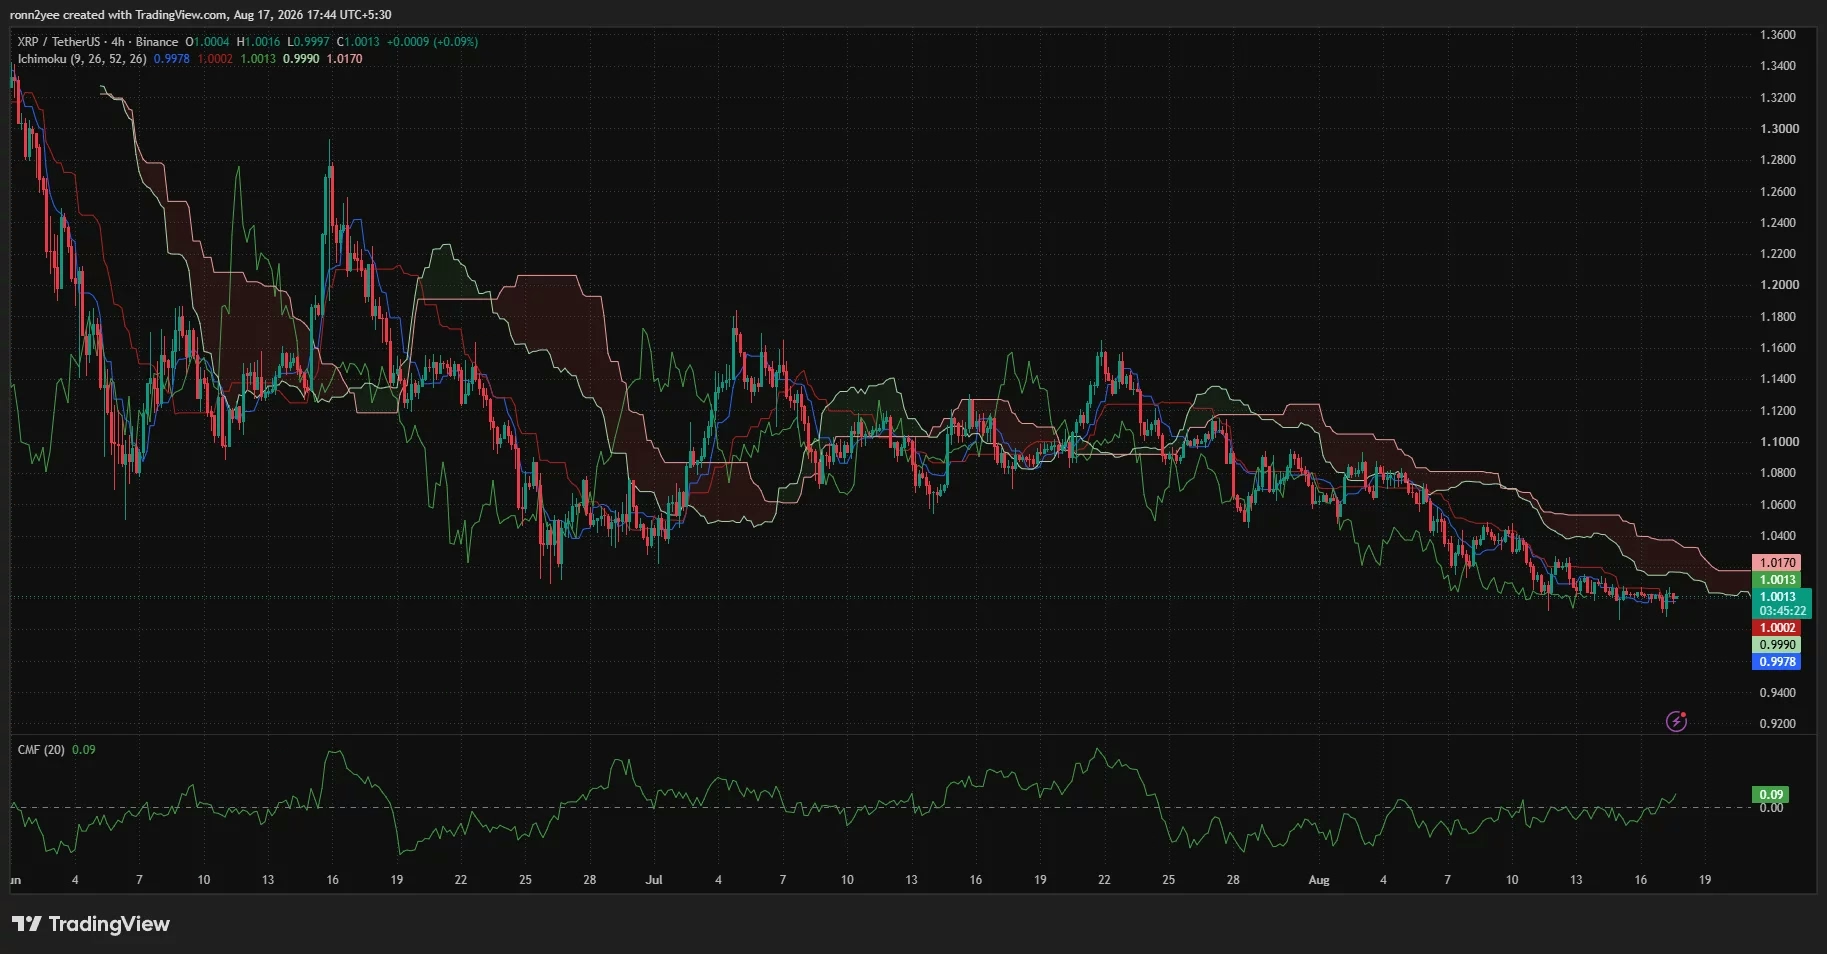
While daily indicators remain uniformly bearish, the 4-hour timeframe offers a marginally more constructive signal. 🔄 XRP was trading near $1.001 with its 4-hour Chaikin Money Flow rising to 0.09, suggesting that some buyers have entered positions near the latest lows. This represents an early attempt at stabilization, though it remains far too premature to declare a reversal.
The token also moved marginally above the Ichimoku conversion line near $0.998 and the baseline around $1.000, indicating that very short-term momentum has stabilized after the recent decline. However, XRP remains trapped below the main Ichimoku cloud, with its upper boundary positioned near $1.017. Most concerning, the cloud continues sloping downward, maintaining the bearish structure that has dominated since late July.
A meaningful 4-hour close above $1.017 would provide the first substantive evidence that buyers are reasserting control. Subsequent resistance would then materialize near $1.037 and $1.05, followed by the daily upper Bollinger Band around $1.10.
🌊 Liquidation Heatmap: Where the Real Action Awaits
CoinGlass' three-day liquidation heatmap reveals crucial information about leveraged positioning that could determine XRP's next directional move. A dense concentration of leveraged positions sits immediately above current price levels, with the strongest nearby pool clustered around $1.011. Additional liquidity appears near $1.02.
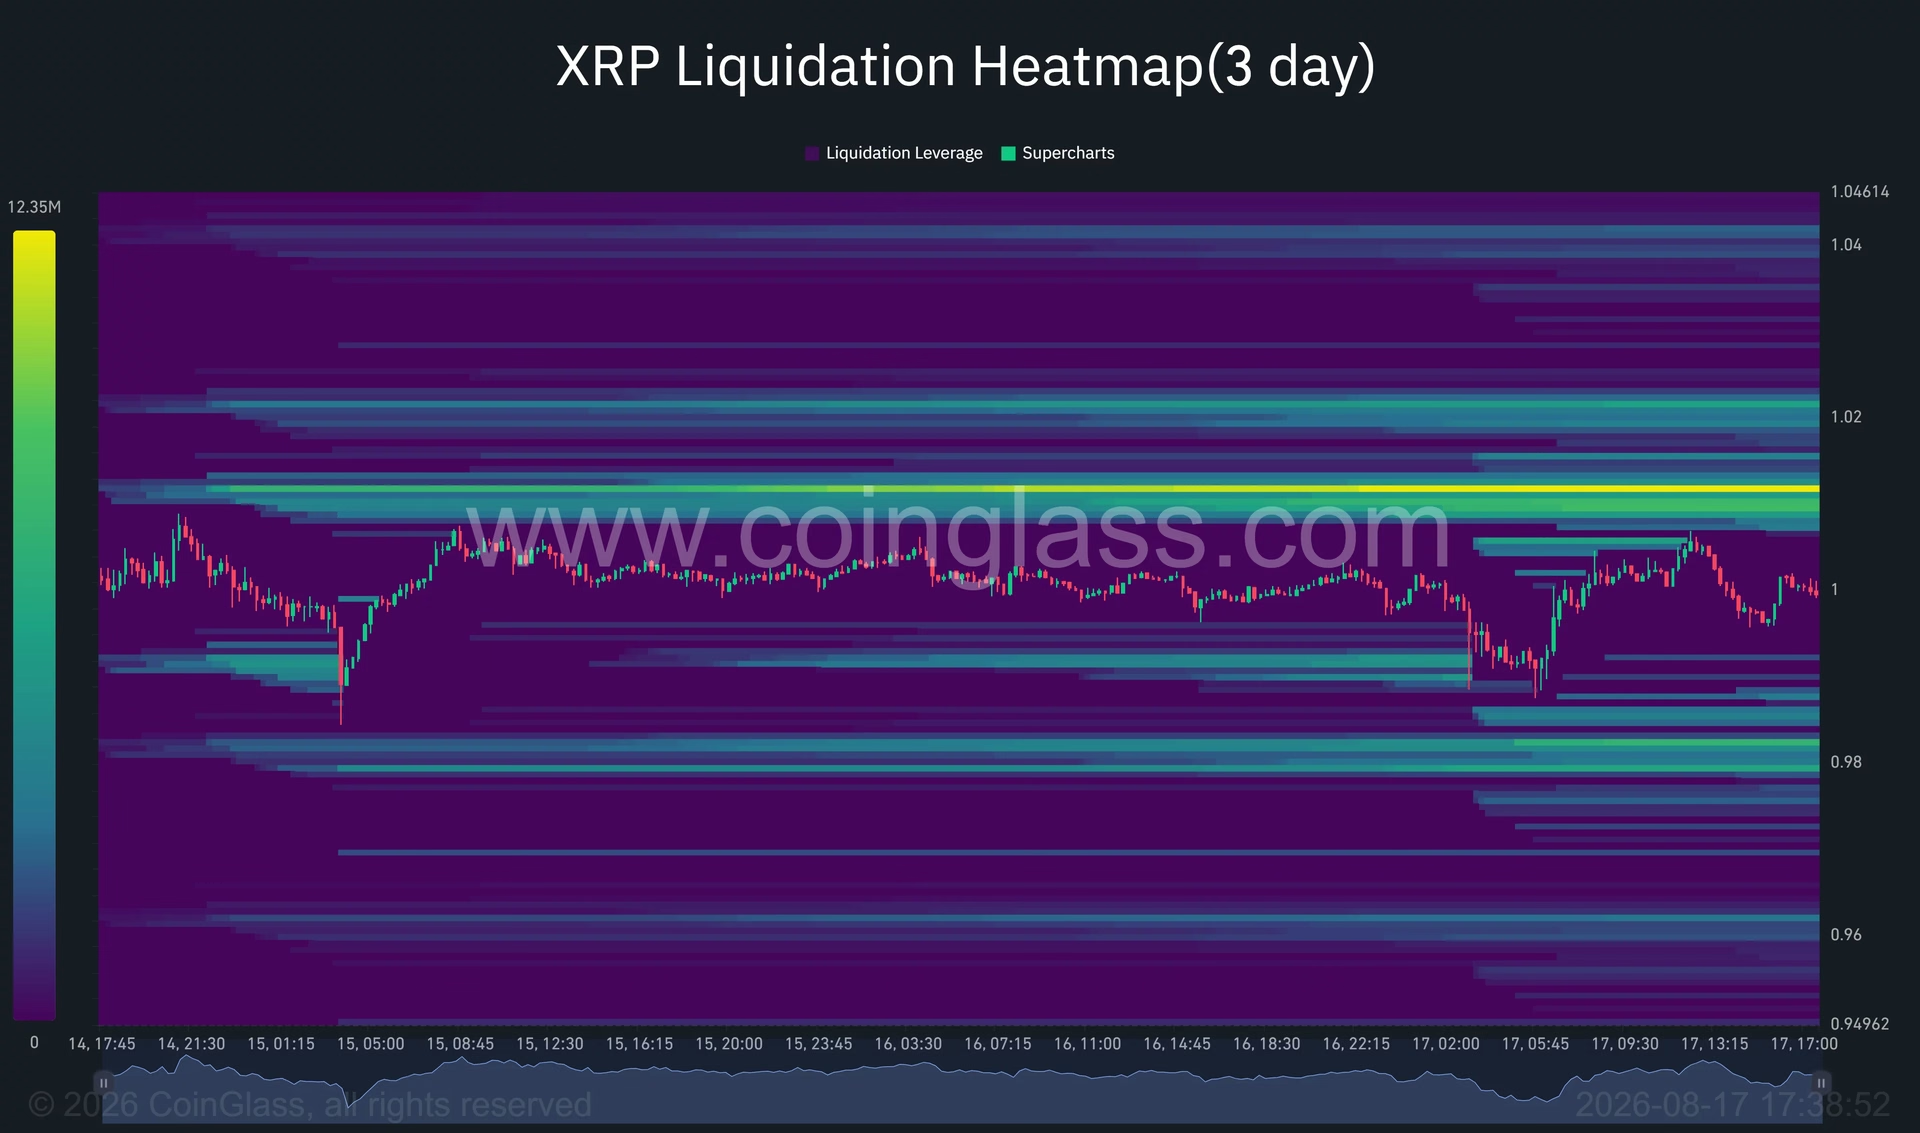
This positioning matters significantly because price often gravitates toward areas containing substantial volumes of leveraged positions. When price reaches these zones, liquidations cascade through the market, increasing volatility and frequently triggering sharp moves. A successful push through $1.011 could therefore trigger short liquidations and potentially propel XRP toward $1.02.
The downside tells an equally important story. The clearest downside liquidity cluster sits near $0.98, positioned dangerously close to the daily lower Bollinger Band at $0.975. Additional concentrations appear around $0.96, though they are less immediately threatening. A decisive loss of $0.99 could expose the $0.98–$0.975 region and force leveraged long positions to capitulate. Should buyers fail to defend this critical range, XRP could extend its decline toward $0.96 and beyond.
Currently, XRP trades between competing liquidity pools, making $1.011 the immediate upside target and $0.98 the primary downside objective.
🤔 The Analyst Divide: How Low Could XRP Go?
Market analysts remain divided on whether XRP has approached a durable bottom. Some respected voices in the space, including analyst Crypto Patel, suggest that XRP could decline another 20% to 40% before establishing a major reversal pattern. This perspective identifies the $0.85–$0.65 range as a potential long-term accumulation zone, though Patel emphasizes that capital should be deployed gradually rather than deployed all at once at an exact bottom.
Such a decline would require XRP to decisively break the $0.975 support level and extend below the lower liquidity areas visible on the three-day heatmap. The analyst's longer-term targets of $3, $5, $7, and $10 represent aspirational levels that depend entirely on future reversal confirmation—levels that currently lack support from the present daily trend.
Other analysts maintain that $1 represents a meaningful support floor that should hold, particularly given the psychological significance of round numbers in attracting institutional interest.
💡 Key Takeaways: What Happens Next?
XRP currently stands at a critical juncture that will define its trajectory for weeks ahead:
- Immediate resistance sits at $1.037 (daily middle Bollinger Band), with the $1.011 liquidation cluster serving as the first hurdle
- Critical support exists at $0.98–$0.975, with a breakdown potentially opening the door to $0.96 and lower
- Money flow remains negative, suggesting sellers retain control despite any short-term bounces
- Lower market participation amplifies volatility around key levels, making price swings more dramatic
- Analyst disagreement on a bottom suggests traders should exercise caution with aggressive positions
For XRP to establish a genuine recovery, the token must reclaim the middle Bollinger Band while simultaneously attracting fresh capital inflows—evidenced by positive Chaikin Money Flow readings. Until those conditions materialize, the path of least resistance remains downward. 📉
Traders monitoring XRP should watch the $1.011 liquidation level closely for upside clues, while $0.98 represents the final line in the sand before a more substantial breakdown becomes likely. The next 48 to 72 hours could prove decisive in determining whether XRP stabilizes or extends its decline toward analyst targets in the $0.85–$0.65 range.
You May Also Like

Market Analysis
XRP Price Falls 5% as Leverage Hits Seven-Month High
August 26, 2026

Market Analysis
Crypto Market Hits Extreme Greed: What This Means for Bitcoin
August 26, 2026

Market Analysis
Ethereum Price Rally Overheats Below $2,550 Resistance
August 26, 2026

Market Analysis
Hyperliquid Price Rally: HYPE Targets $97 Amid $80 Support
August 25, 2026