Category:
Market AnalysisEthereum Slips Below $1,800: Is $2,140 Still Possible?

In recent days, Ethereum's price has dipped below the crucial $1,800 mark, raising questions about its short-term trajectory. Despite this slip, technical charts suggest a potential rally towards $2,140, contingent upon breaking key resistance levels. 🌟
Current Market Scenario 🌍
The recent decline in Ethereum's price was largely influenced by geopolitical tensions between the U.S. and Iran, which have led to a surge in oil prices. As crude oil prices escalated to over $74 a barrel, investors shifted away from riskier assets like cryptocurrencies, impacting Ethereum's market position. 🔥
Key Support and Resistance Levels 📊
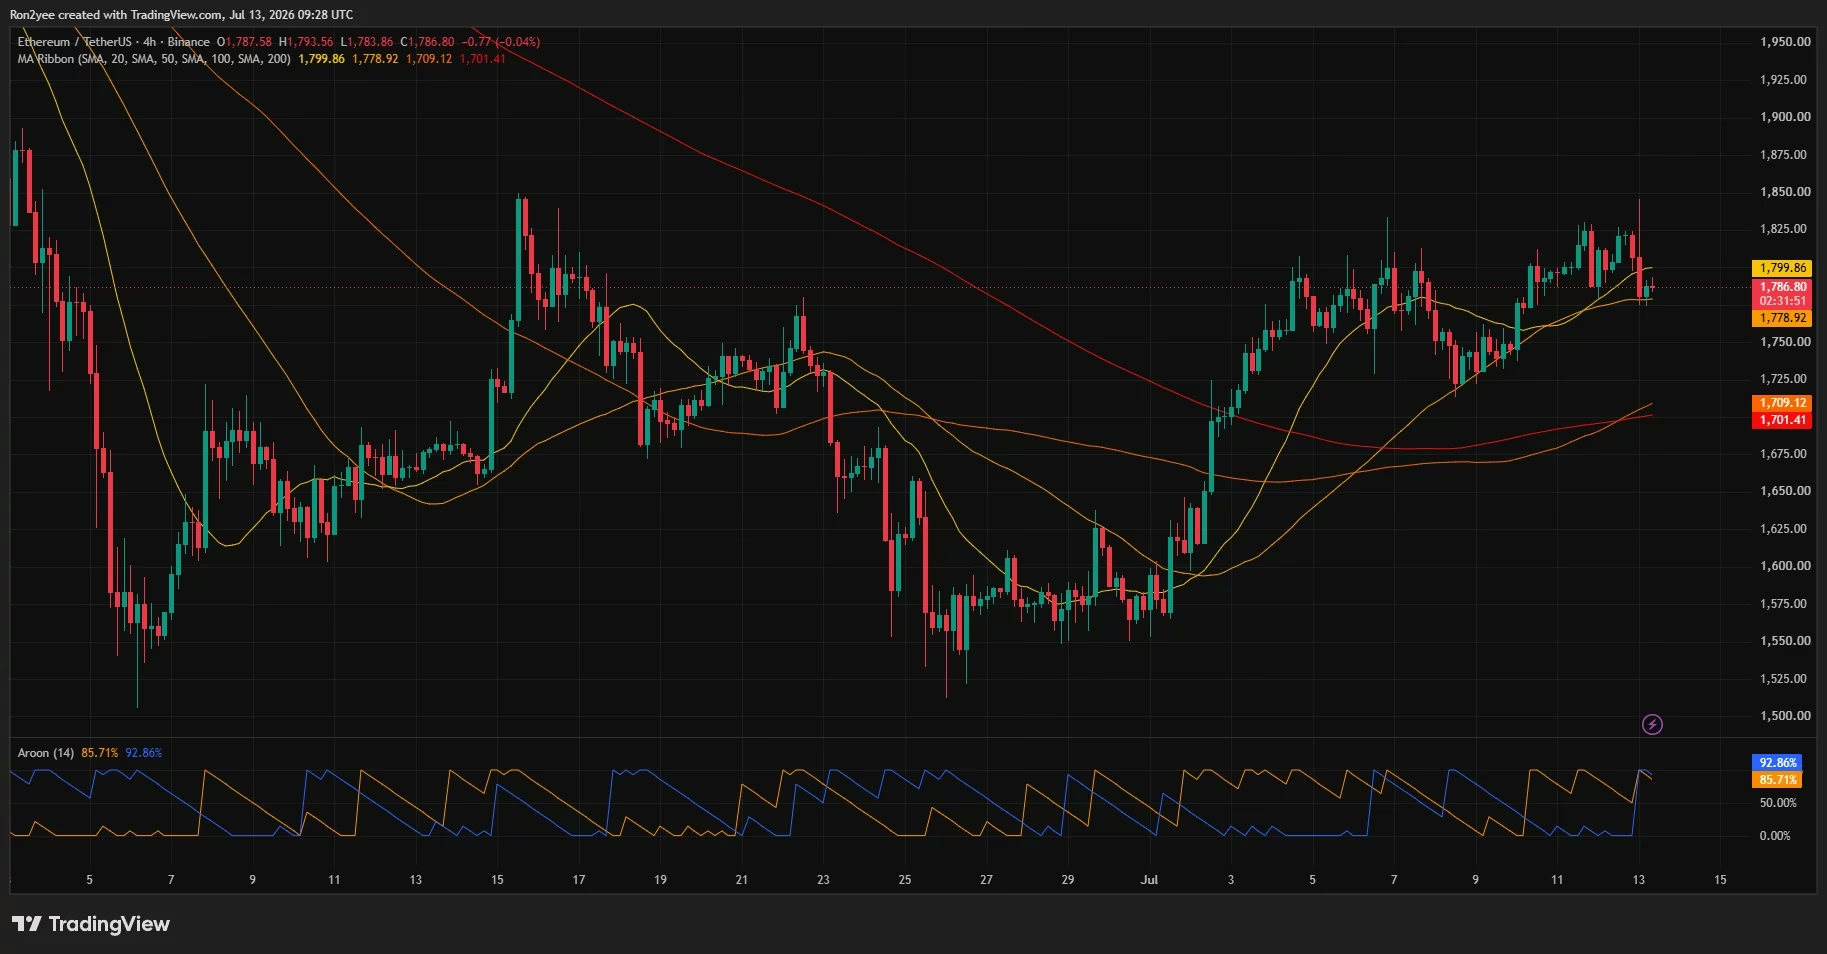
Ethereum has been trading near $1,775, showing resilience at the $1,750 support level. This threshold is critical; a breach could expose Ethereum to further declines toward $1,700 and potentially $1,505. However, a successful breakout above the $1,825-$1,850 resistance zone may pave the way for a rally targeting $2,140. 💹
Technical Indicators and Patterns 🔍
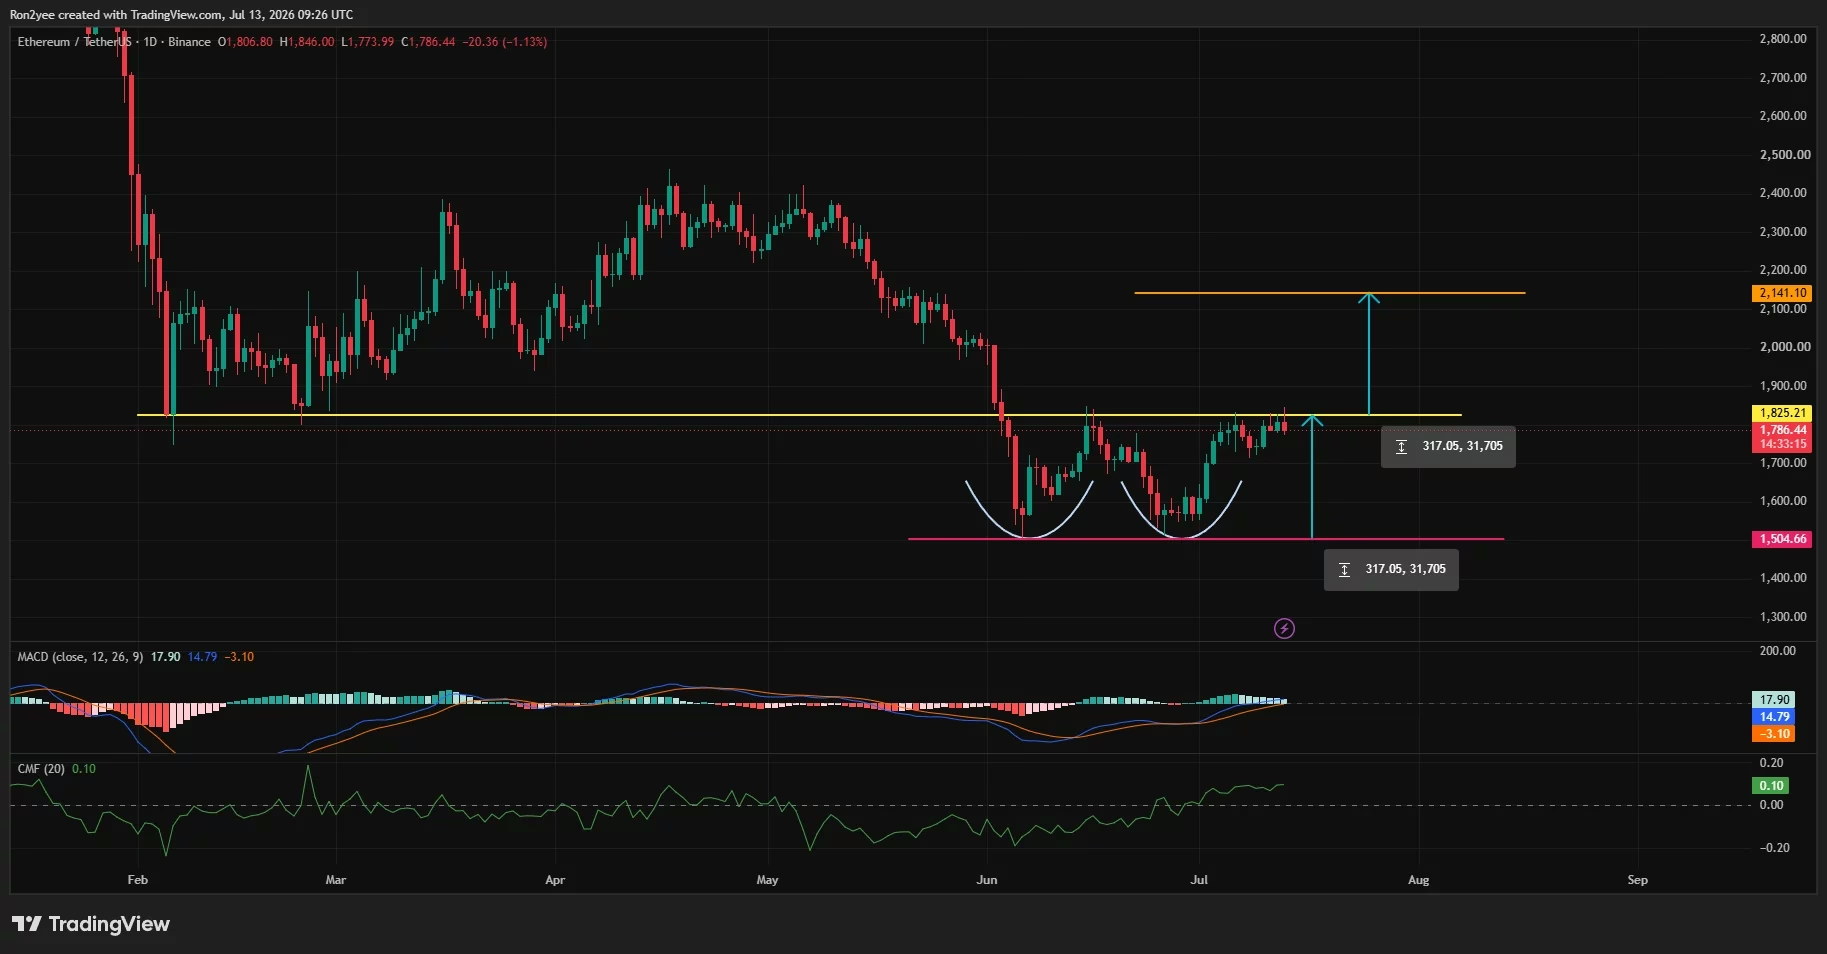
Ethereum's technical structure has been weakened after falling below its 20-day moving average. Nonetheless, it remains above the 50-day and 100-day moving averages, hinting at a potential medium-term recovery. The daily chart shows a possible double-bottom pattern, which could be confirmed with a breakout above $1,825, projecting the $2,140 target. 📈
Momentum and Market Sentiment 🌟
The MACD indicator remains above its signal line, and the Chaikin Money Flow is positive, suggesting that capital has not fully exited the market. Additionally, the Aroon indicator indicates that buyers may still have a slight edge if Ethereum reclaims the $1,800-$1,825 range. 💪
Derivatives and Liquidation Data 💼
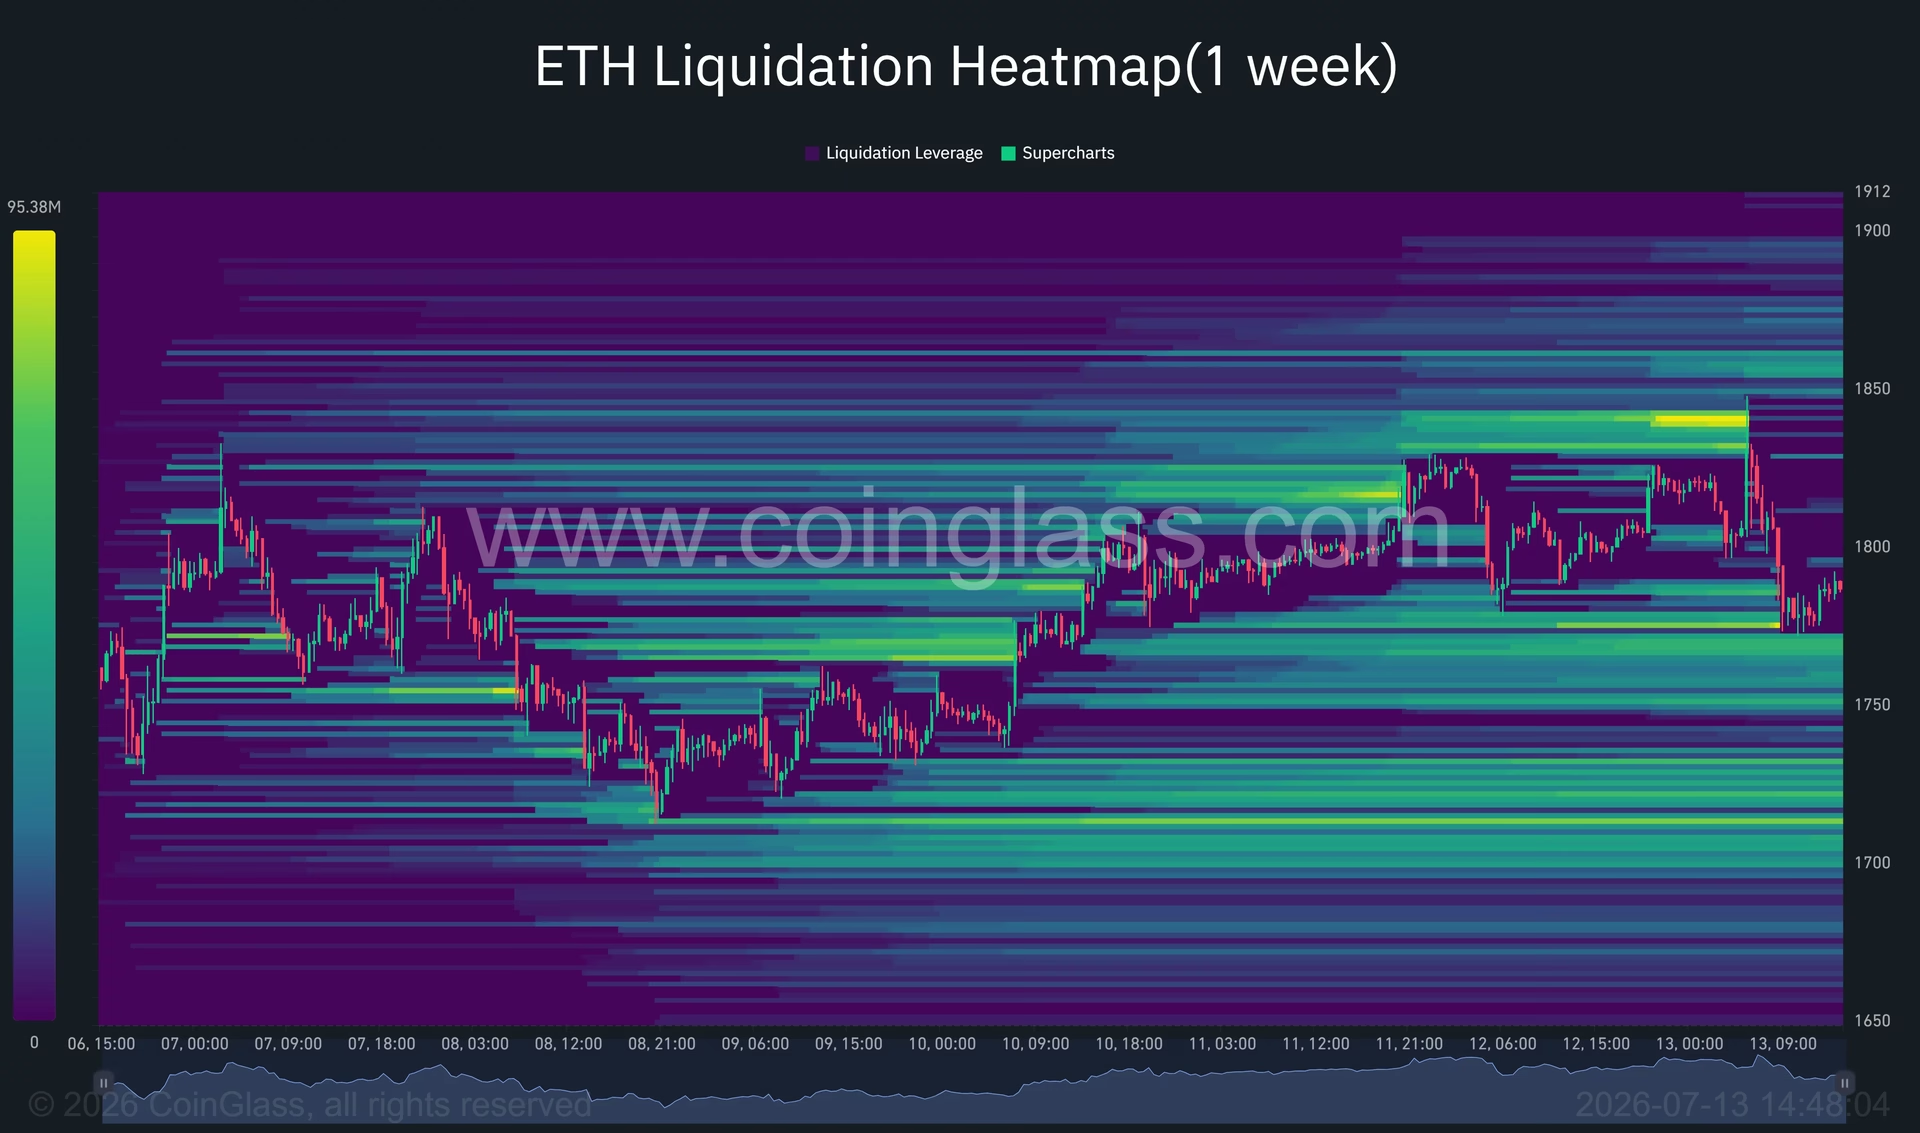
Derivatives markets reveal significant short liquidation clusters between $1,840 and $1,860. A decisive move through this area could trigger short covering, potentially propelling Ethereum toward $1,900 and beyond. Notable bid-side liquidity is also present near the $1,700 mark. 🔄
Geopolitical and Macro Risks 🌐
The ongoing geopolitical tensions and their impact on oil prices continue to influence Ethereum's market dynamics. Rising inflation expectations due to higher energy prices could support a hawkish Federal Reserve stance, possibly keeping cryptocurrencies under pressure. ⚠️
Conclusion: What Lies Ahead? 🚀
Ethereum's ability to hold above the $1,750 support level is crucial for maintaining its upward potential. While the immediate outlook is clouded by geopolitical and macroeconomic uncertainties, a breakout above key resistance levels could ignite a rally towards $2,140. Traders should remain vigilant, monitoring technical indicators and global news closely.
Ethereum's journey remains full of potential, yet fraught with challenges. As the market evolves, the interplay of technical signals and macroeconomic factors will dictate the path ahead. 📈✨
You May Also Like

Market Analysis
XRP Price Falls 5% as Leverage Hits Seven-Month High
August 26, 2026

Market Analysis
Crypto Market Hits Extreme Greed: What This Means for Bitcoin
August 26, 2026

Market Analysis
Ethereum Price Rally Overheats Below $2,550 Resistance
August 26, 2026

Market Analysis
Hyperliquid Price Rally: HYPE Targets $97 Amid $80 Support
August 25, 2026