Category:
Market AnalysisBitcoin Price Risks $59K Drop as Iran War Lifts Oil

Bitcoin's recent price action reveals a critical juncture for the world's largest cryptocurrency. 📉 As geopolitical tensions escalate between the United States and Iran, the ripple effects are reshaping market dynamics across traditional and digital asset classes. Understanding these interconnected forces is essential for anyone tracking Bitcoin price movements and broader cryptocurrency market trends.
The Perfect Storm: Geopolitical Tension Meets Market Volatility 🌍
On July 31st, Bitcoin experienced a significant pullback, sliding below the $64,000 psychological barrier as multiple headwinds converged. The cryptocurrency fell as low as $62,466—a 3.6% decline from intraday highs—amid escalating tensions in the Middle East and renewed concerns about global oil supply stability.
The catalyst? Iran reportedly attacked two oil tankers under U.S. military escort in the Strait of Hormuz, one of the world's most critical shipping corridors. This wasn't an isolated incident; Tehran also claimed to have turned back four additional vessels while launching drone strikes targeting U.S.-linked military facilities in Kuwait and Bahrain. The escalation raised immediate concerns about potential direct military confrontation, pushing oil prices higher and strengthening the U.S. dollar—both headwinds for Bitcoin and other non-yielding assets.
Technical Breakdown: The Bearish Rounded-Top Pattern ⚙️
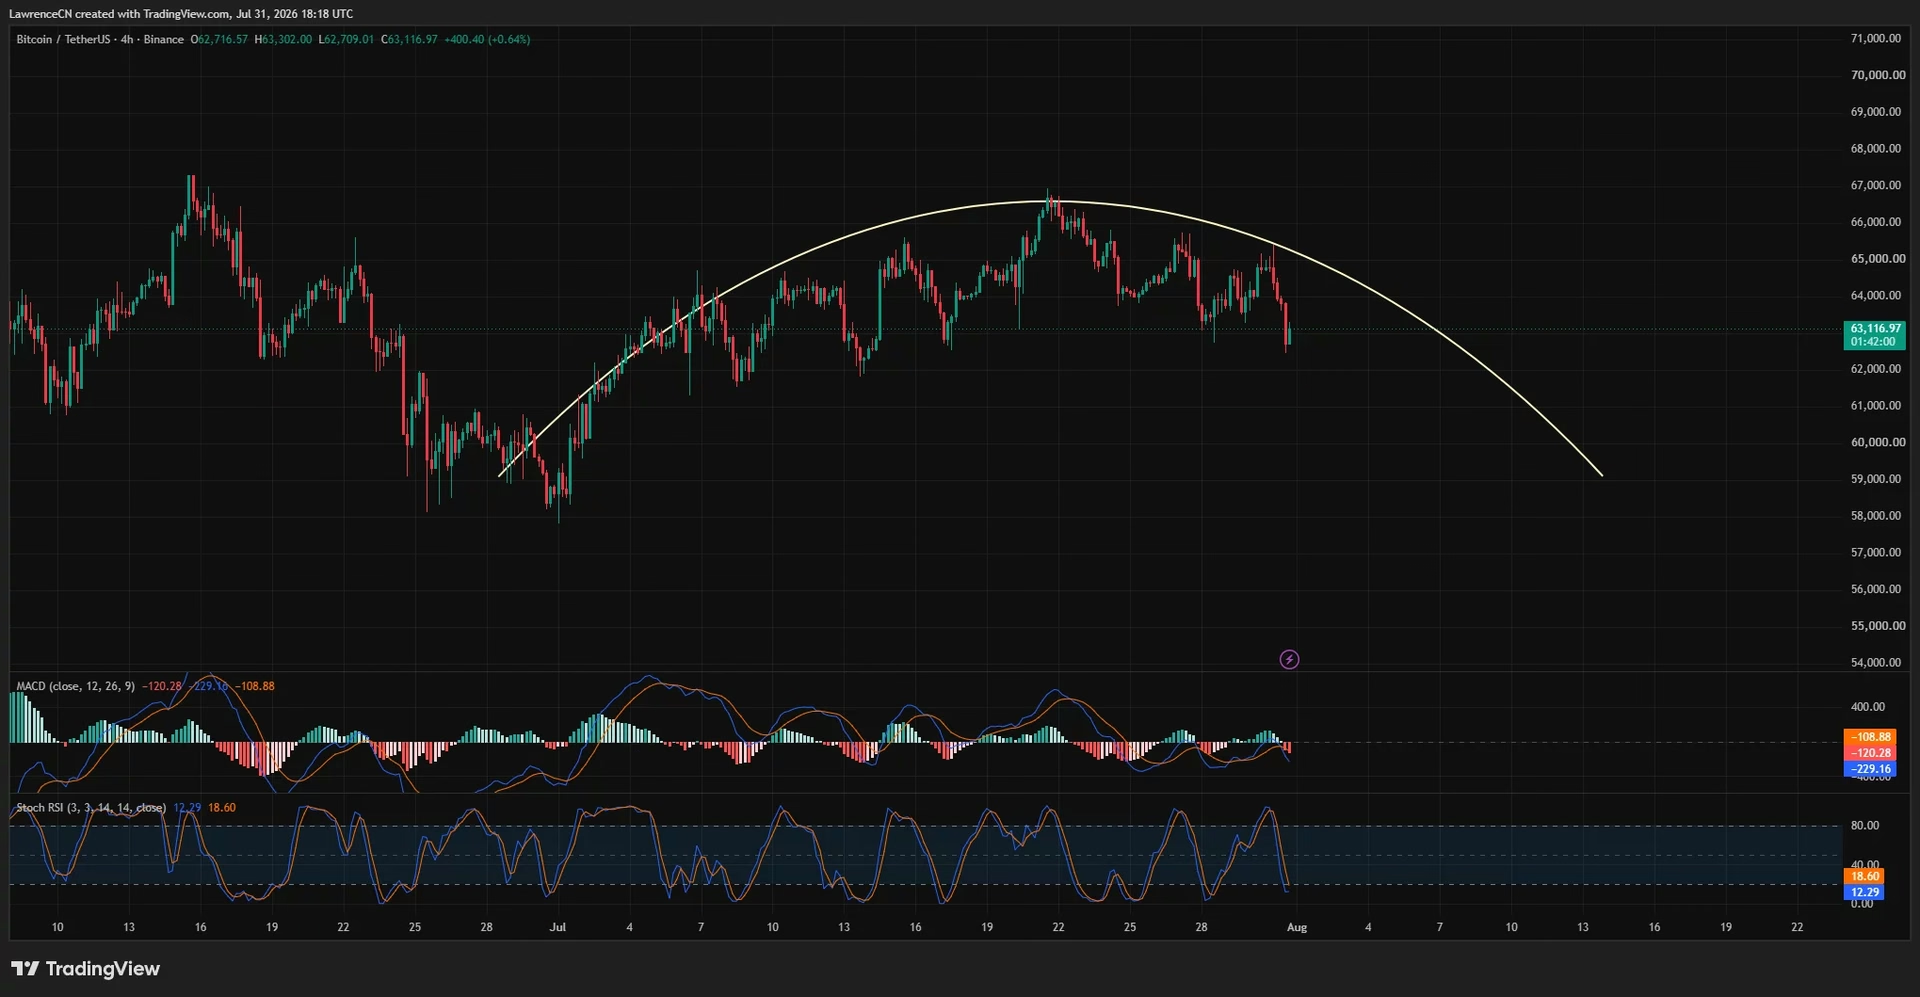
From a technical perspective, Bitcoin's 4-hour chart has been painting a troubling picture. The cryptocurrency has formed a rounded-top formation since late June, climbing from approximately $59,000 to a July 22 peak near $66,700 before gradually creating a series of lower highs. This classic bearish pattern suggests that buyers are losing momentum at higher price levels.
The most recent rejection from the $65,000 area pushed Bitcoin toward the pattern's critical neckline, positioned between $62,000 and $63,000. A confirmed 4-hour close below this support level could validate the breakdown and expose the $59,000 target—representing a potential 6-7% decline from current levels.
Key technical levels to monitor:
- Immediate support: $62,000–$63,000 (neckline of rounded-top pattern)
- Secondary support: $60,000 (psychological level)
- Rounded-top target: $59,000 (pattern completion)
- Resistance: $63,445–$64,500 (7-day and 25-day moving averages)
- Strong resistance: $65,000–$66,700 (July rally highs)
Momentum indicators currently favor sellers. Bitcoin's 4-hour MACD line fell to approximately -229, well below its signal line near -109, with the negative histogram widening to around -120. This acceleration in bearish momentum suggests that selling pressure has intensified during the latest decline.
Moving Averages Signal Trend Reversal 📊
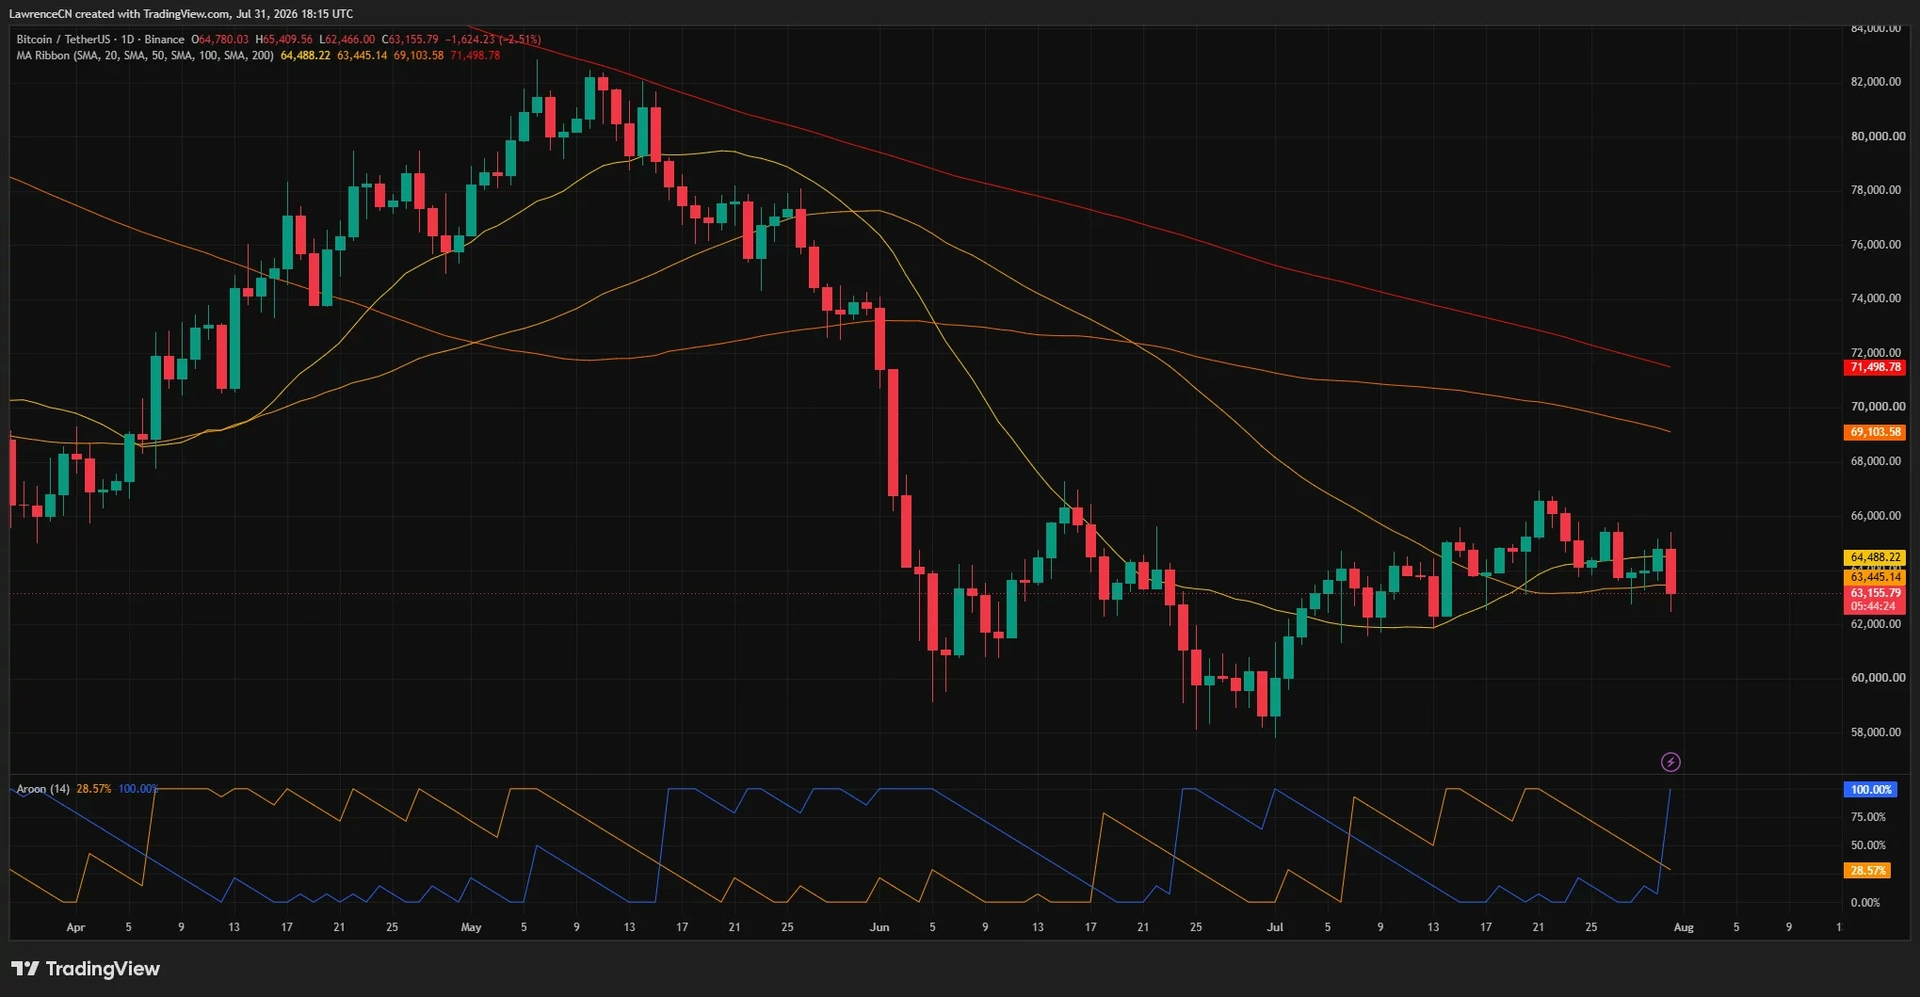
Bitcoin has broken below several critical moving averages, a development that typically signals weakening short-term strength. The cryptocurrency dipped beneath both the seven-day simple moving average (approximately $63,445) and the 25-day SMA (around $64,488), indicating that short-term sellers have reasserted control after Bitcoin failed to sustain its July recovery gains.
The situation becomes more bearish when considering longer-term averages. Bitcoin remains substantially below the 50-day SMA at $69,104 and the 200-day SMA near $71,499—levels that represent major overhead resistance and reinforce the broader bearish structure that has persisted since the asset fell from above $82,000 in May.
The daily Aroon indicator provides additional confirmation of this bearish bias. Aroon Down jumped to 100%, while Aroon Up stood at just 28.57%, demonstrating that the most recent low occurred significantly more recently than the last meaningful high—a classic sign of downtrend dominance.
Oil Prices and Dollar Strength: The Hidden Pressure 💰
While Bitcoin price analysis often focuses exclusively on on-chain metrics and cryptocurrency-specific factors, macroeconomic forces deserve equal attention. The Iran escalation lifted crude oil prices, renewing concerns that elevated energy costs could keep U.S. inflation elevated longer than previously anticipated.
This inflation concern paradoxically strengthens the U.S. dollar, as markets price in expectations of higher interest rates to combat price pressures. A stronger dollar creates headwinds for Bitcoin and other non-yielding risk assets, as investors rotate toward dollar-denominated assets and yield-bearing instruments like Treasury bonds.
This dynamic creates a challenging environment for Bitcoin price recovery. Traditional risk-off sentiment—where investors flee to safety—typically benefits the dollar and commodities while pressuring speculative assets. Bitcoin, despite its growing institutional adoption, still carries a risk-asset label during periods of heightened geopolitical uncertainty.
Oversold Conditions Suggest Potential Rebound 🔄
Despite the bearish technical setup, one bright spot emerges from momentum analysis. The Stochastic RSI on Bitcoin's 4-hour chart has reached oversold territory, with both lines positioned at 12.29 and 18.60—well below the 20 threshold that typically signals extreme selling pressure.
While oversold conditions don't guarantee an immediate recovery, they do suggest that the sell-off may be becoming stretched over the short term. Bitcoin could retest the broken $63,400–$64,500 area before determining its next directional move. Reclaiming $64,500 would weaken the immediate bearish setup, while a move above $65,500 would challenge the rounded-top structure itself.
Liquidation Levels: The $62,000 Flashpoint 💥
Analysts monitoring Bitcoin's liquidation map have identified concentrated liquidity near the $62,000 level as a critical decision point. This area aligns perfectly with the rounded-top pattern's neckline and several recent intraday lows, making it the most important near-term support zone.
A sweep below the $62,000 support could trigger cascading leveraged long liquidations, potentially accelerating the downside move. However, such a move could paradoxically attract buyers attempting to capitalize on oversold conditions and concentrated buying interest at that level. The outcome depends on whether demand emerges at these depressed prices or if sellers maintain control.
Failure to attract meaningful buying interest at $62,000 would open the path toward $60,000 and ultimately the rounded-top objective near $59,000. This scenario would represent a significant capitulation event in Bitcoin markets.
Geopolitical Risks Remain the Wildcard 🎲
The immediate external risk to Bitcoin price stability remains geopolitical in nature. Further escalations involving U.S. forces, oil tankers, or major shipping routes through the Strait of Hormuz could lift oil prices further and extend the broader risk-off move that pressures Bitcoin and other speculative assets.
The U.S. Senate's failure to advance a measure restricting President Trump's military authority (a 49–50 vote) left the administration's short-term military options largely unchanged. Meanwhile, reports of a potential U.S.-Israeli proposal for a land blockade of Iran remain under discussion rather than announced policy, adding uncertainty to the geopolitical calculus.
Conversely, any evidence of negotiations, diplomatic progress, or safer passage through the Hormuz Strait could ease inflation concerns and help Bitcoin stabilize. Markets often price in worst-case scenarios during uncertainty, creating potential for rapid reversals if tensions de-escalate.
What's Next for Bitcoin Price? 🔮
The current setup presents a classic technical breakdown scenario with external headwinds reinforcing bearish momentum. Bitcoin's failure to maintain support above $64,000 and the formation of a bearish rounded-top pattern suggest that downside risks outweigh upside potential in the near term.
Bear case scenario: If $62,000 support fails to hold, Bitcoin could accelerate toward $59,000, representing a 6-7% decline from current levels. Further weakness could expose $60,000 and create capitulation-style selling.
Bull case scenario: If Bitcoin finds support at $62,000 and oversold conditions trigger a rebound, the cryptocurrency could retest $63,445–$64,500. A successful retest and close above $65,000 would invalidate the rounded-top breakdown and suggest a consolidation pattern instead.
Key Takeaways for Bitcoin Investors 📌
Several critical insights emerge from this analysis:
- Technical deterioration is real: Bitcoin's break below key moving averages and formation of a bearish rounded-top pattern indicate genuine weakness beyond normal volatility.
- Macro factors matter: Oil prices, dollar strength, and geopolitical tensions create powerful headwinds that on-chain analysis alone cannot explain.
- $62,000 is the critical line: This level represents both technical support and concentrated liquidity, making it the most important price zone to monitor.
- Oversold conditions provide hope: While the technical picture appears bearish, extreme oversold readings suggest that downside may be limited in the very short term.
- Geopolitical developments could be game-changers: Escalation or de-escalation in U.S.-Iran tensions could dramatically shift Bitcoin price direction.
The cryptocurrency market remains at an inflection point. Bitcoin price risks falling toward $59,000 if current technical support fails, but oversold momentum and concentrated liquidity suggest that any move lower could be met with renewed buying interest. Investors should monitor both technical levels and geopolitical headlines closely, as both will likely drive price action in the coming days and weeks.
You May Also Like

Market Analysis
XRP Price Falls 5% as Leverage Hits Seven-Month High
August 26, 2026

Market Analysis
Crypto Market Hits Extreme Greed: What This Means for Bitcoin
August 26, 2026

Market Analysis
Ethereum Price Rally Overheats Below $2,550 Resistance
August 26, 2026

Market Analysis
Hyperliquid Price Rally: HYPE Targets $97 Amid $80 Support
August 25, 2026