Category:
Market AnalysisBitcoin Tests $63K Amid $265M ETF Outflows

Bitcoin finds itself at a critical juncture 🔀 as the leading cryptocurrency hovers near the $63,000 mark, facing mounting pressure from institutional capital flight and deteriorating technical momentum. The digital asset's struggle to maintain support levels signals a broader shift in market sentiment, with spot Bitcoin ETF outflows reaching $265 million on a single day—a stark reminder that institutional enthusiasm may be cooling faster than many anticipated.
Bitcoin's Battle at the $63,000 Support Level 📉
The current price action reveals a market caught between competing forces. Bitcoin is trading directly below the critical 78.6% Fibonacci retracement level at $63,150, a technical barrier measured from the May peak of $82,492 down to the June low of $57,884. This level represents more than just a number on a chart—it's a psychological battleground where buyers and sellers are testing each other's conviction.
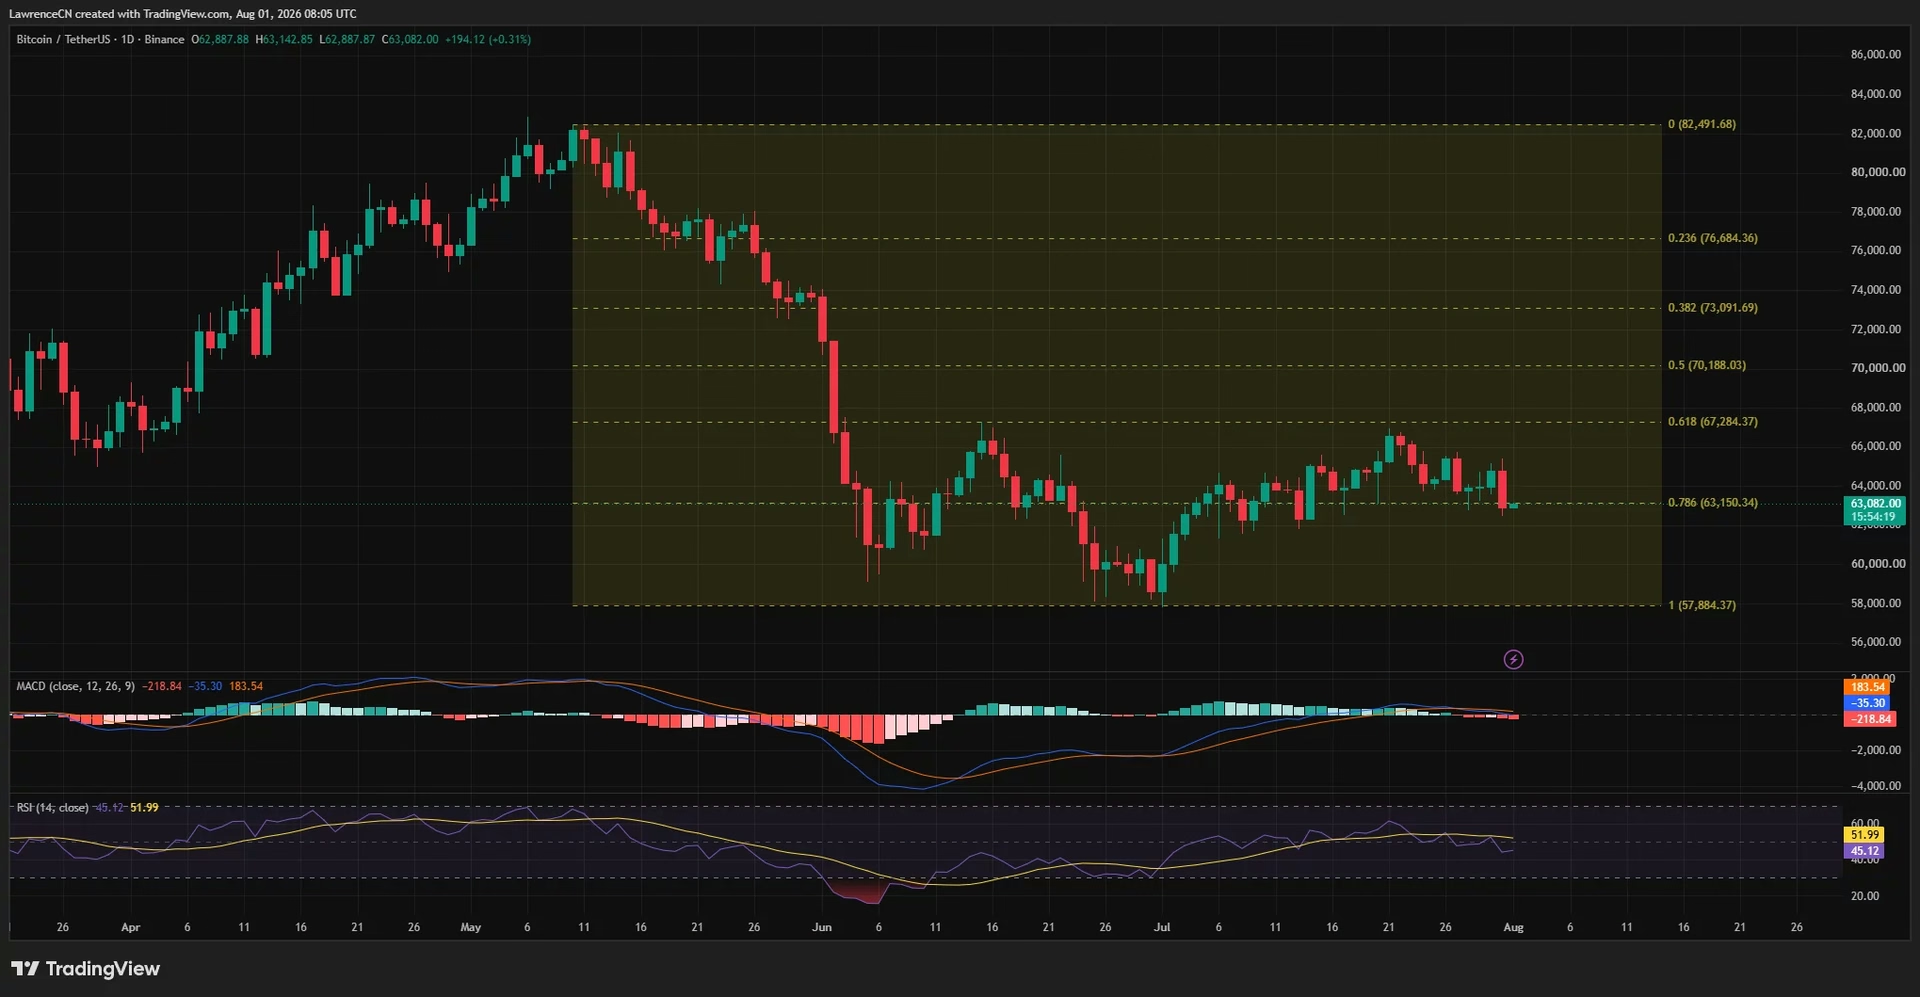
The recent pullback has erased most of Bitcoin's recovery gains from July's ambitious climb toward $66,900. A daily close below $63,150 would confirm that institutional and retail buyers have abandoned their defensive positions, potentially opening the door to deeper declines toward the $62,000 zone and the psychologically significant $60,000 support.
However, holding the current area would suggest consolidation rather than capitulation—a scenario that could lead to another accumulation phase before the next directional move. The critical question remains: will buyers step in at these levels, or will selling pressure intensify further?
Technical Indicators Flash Red Signals 🚨
Momentum analysis paints a concerning picture for Bitcoin bulls. The relative strength index on the daily chart has fallen to 45.12, sitting below its moving average of 51.99. While this reading hasn't reached oversold conditions—typically seen below 30—it indicates the market has substantial room to decline before attracting the aggressive dip-buying that often characterizes capitulation events.
The daily moving average convergence divergence (MACD) indicator has turned decisively bearish, with the MACD line crossing below its signal line while the histogram has shifted into negative territory at −218.84. This technical setup typically precedes further downside pressure, especially when combined with weakening price action.
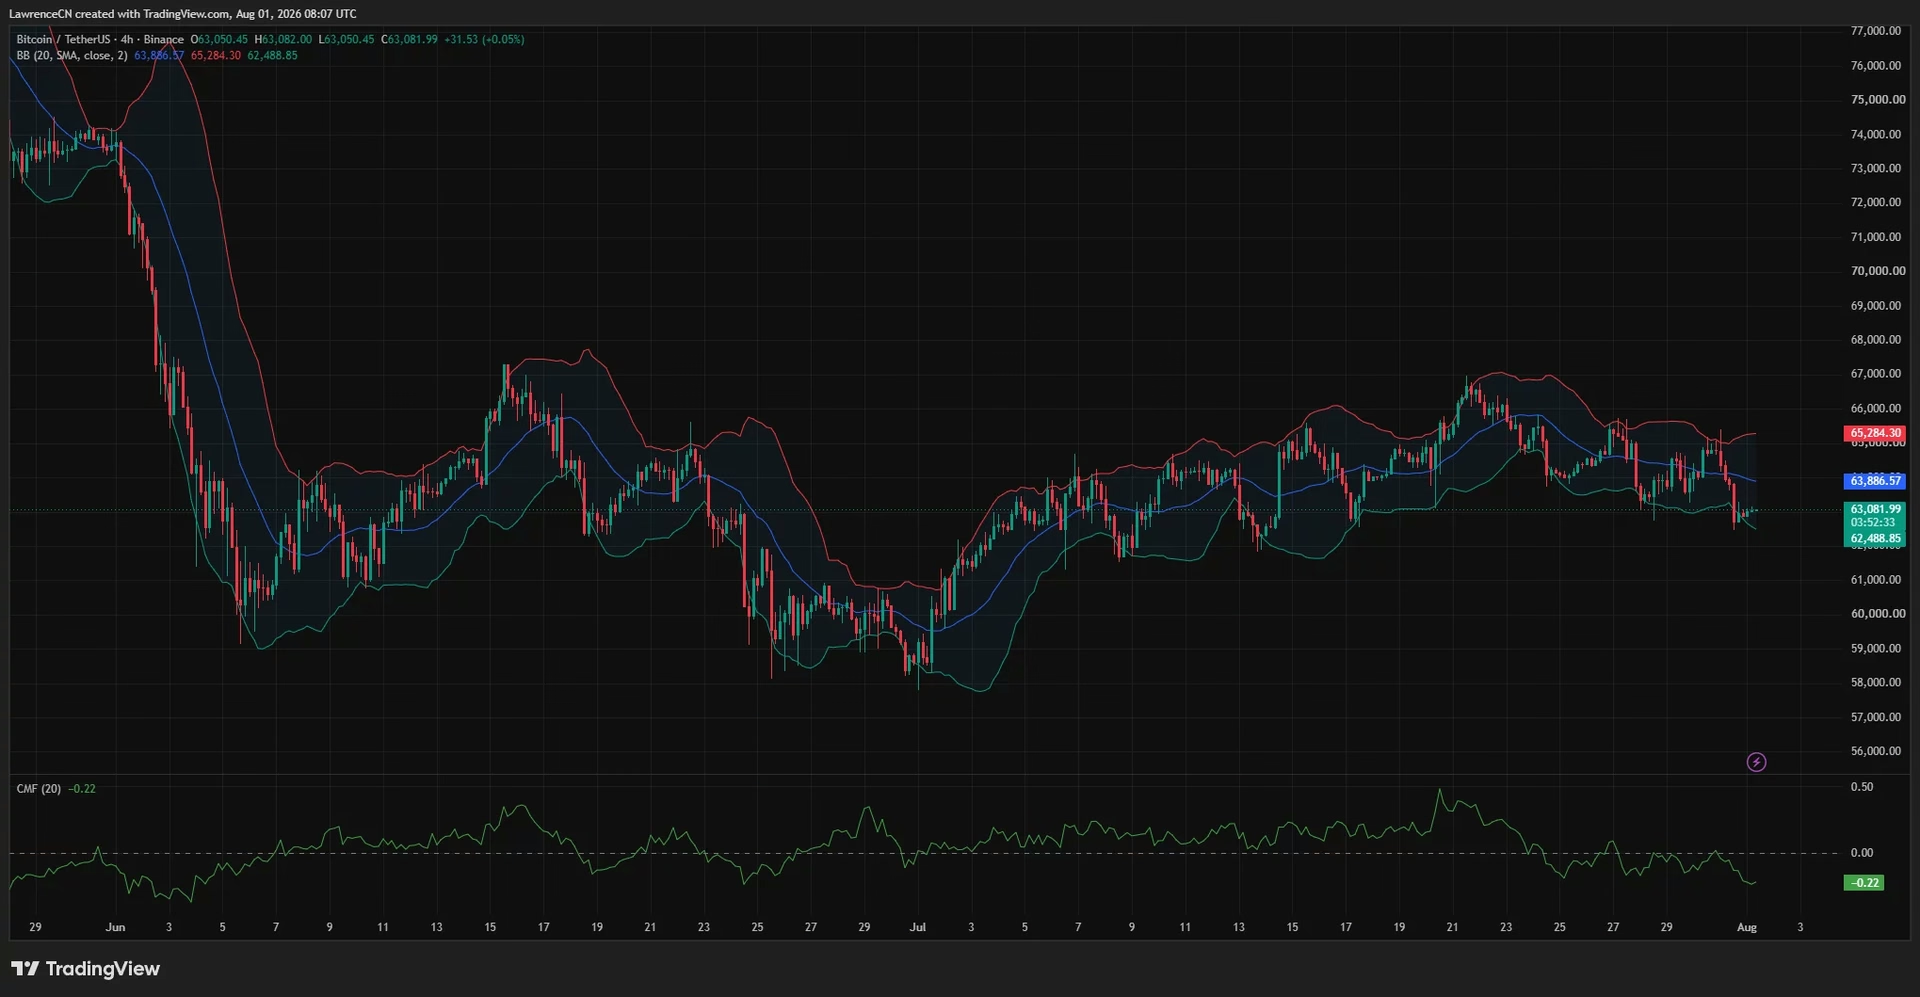
On the 4-hour timeframe, Bitcoin is trading below the Bollinger Band midpoint at $63,886, dangerously close to the lower band at $62,489. The Chaikin Money Flow indicator has deteriorated to −0.22, a deeply negative reading that reveals capital is actively fleeing Bitcoin even as it trades near support levels. This combination suggests any short-term recovery attempt would lack the buying power needed for sustained upside momentum.
Institutional Retreat: ETF Outflows Tell the Story 💸
The $265 million in net outflows from US spot Bitcoin ETFs on July 31 represents more than just a statistical blip—it signals a meaningful shift in institutional positioning. BlackRock's iShares Bitcoin Trust, typically a bellwether for institutional sentiment, led the exodus with $123 million in withdrawals. Fidelity's FBTC followed with approximately $54.8 million in outflows.
This daily outflow ended a brief two-session inflow streak, suggesting that institutional demand remains fragile at best. The total assets held by US spot Bitcoin ETFs currently stand at approximately $76.29 billion, representing 6.04% of Bitcoin's entire market capitalization. While this percentage might seem modest, the concentration of capital in these vehicles means their flows carry outsized influence on short-term price dynamics.
The timing of these outflows is particularly significant. They coincide with broader market uncertainty surrounding regulatory developments and macroeconomic headwinds that continue to weigh on risk assets globally. Institutional investors, traditionally focused on longer-term accumulation, appear to be taking profits or reducing exposure ahead of potential market volatility.
Liquidation Clusters: Where the Real Action May Occur 🎯
Bitcoin's one-week liquidation heatmap reveals critical price zones where leveraged traders have concentrated their positions. The most substantial downside liquidity cluster sits near $62,000, creating a potential magnet for price if Bitcoin breaks below the 4-hour lower Bollinger Band at $62,489.
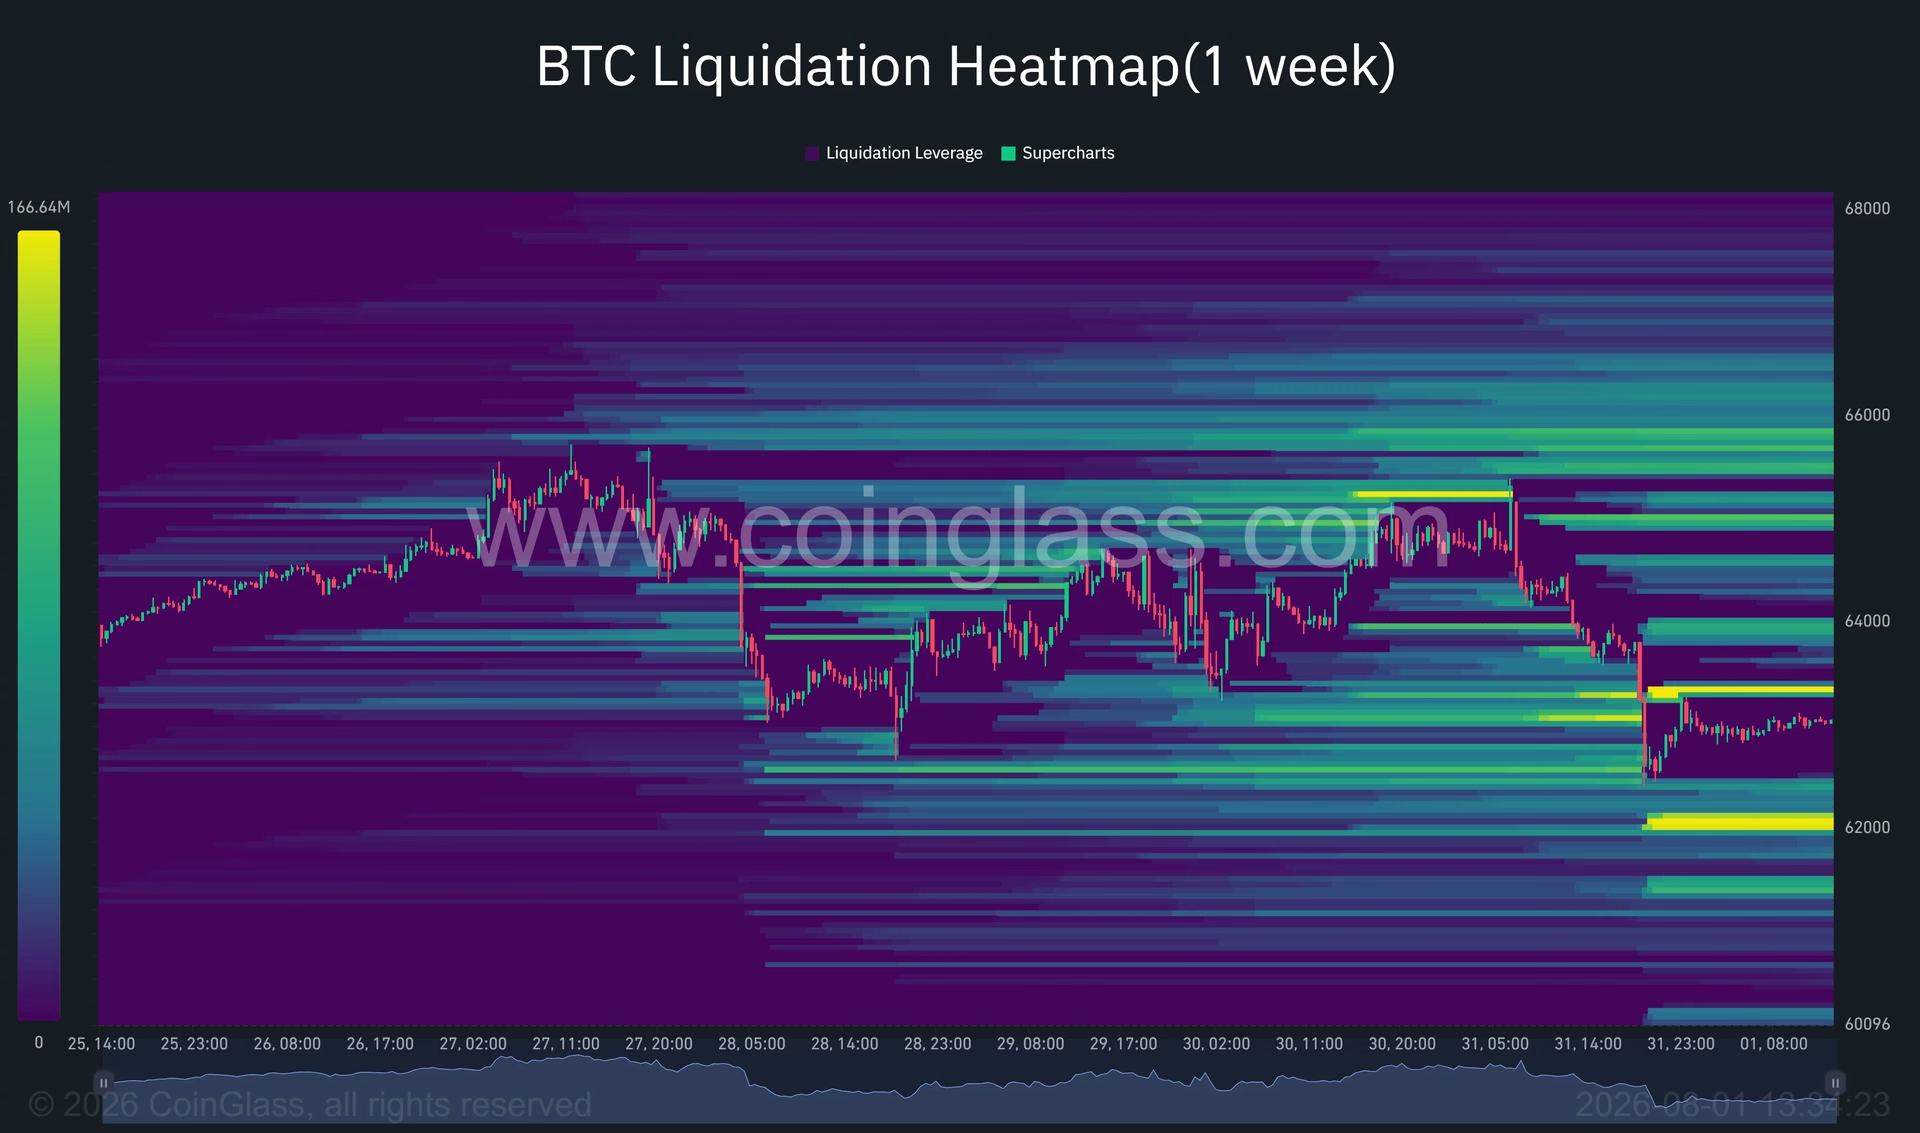
A smaller but notable concentration appears near $63,300, which could serve as an immediate rebound target during any recovery attempt. More significantly, the strongest short-liquidation zones cluster between $65,000 and $66,000—levels that could trigger cascading liquidations if Bitcoin manages to break above current resistance.
These liquidation clusters act as potential price magnets, attracting Bitcoin as exchanges automatically close leveraged positions. However, they don't guarantee directional movement. Bitcoin could first sweep liquidity below $63,000 before attempting recovery, particularly while money flow indicators remain deeply negative.
Regulatory Uncertainty: The CLARITY Act Wildcard ⚖️
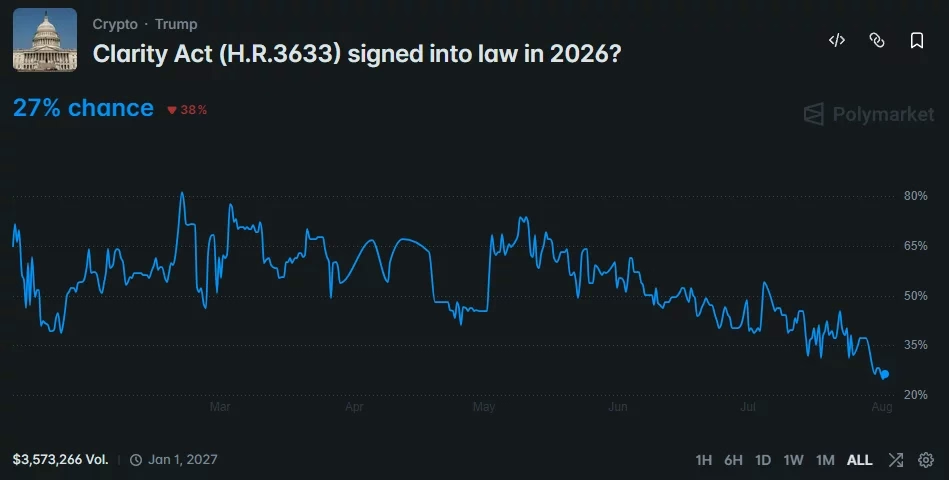
Beyond technical factors and capital flows, regulatory developments are influencing market sentiment. The CLARITY Act negotiations in Washington represent a potential turning point for cryptocurrency market structure regulation. However, Polymarket traders have assigned just a 27% probability to the legislation becoming law in 2026—a significant decline from earlier expectations.
This low probability reflects trader skepticism about lawmakers' ability to resolve their differences before the Senate's August recess. While prediction markets don't offer perfect legislative forecasts, they do capture the collective sentiment of informed traders monitoring political developments. The lack of regulatory clarity continues to create friction for institutional capital, making it easier for fund managers to justify profit-taking at these price levels.
The Path Forward: Recovery or Capitulation? 🔮
Bitcoin's immediate outlook hinges on several critical technical levels. To establish a recovery signal, the asset needs to reclaim the 4-hour Bollinger Band midpoint near $63,886. A move above $64,000 would open the possibility of testing $65,000 and the upper Bollinger Band at $65,284.
Clearing that resistance could trigger short liquidations and potentially allow Bitcoin to retest the $65,800 to $66,000 zone. However, the broader recovery remains incomplete until price breaks above July's high near $66,900 and the 0.618 Fibonacci level at $67,284.
Conversely, a sustained break below $62,000 would significantly weaken the near-term outlook and expose the psychological $60,000 support, followed by the June low near $57,884. Technical analysts have noted TD Sequential sell signals on Bitcoin's three-day chart, adding another layer of caution to the current environment.
Key Takeaways for Traders and Investors 📋
Multiple headwinds converge on Bitcoin:
- Institutional capital is fleeing through ETF outflows
- Technical momentum indicators have turned decisively bearish
- Money flow readings suggest sustained selling pressure
- Regulatory uncertainty continues to dampen institutional enthusiasm
Critical support and resistance zones:
- Immediate support: $62,000 (liquidation cluster)
- Key resistance: $63,886 (4-hour Bollinger midpoint)
- Secondary resistance: $65,000–$66,000 (short liquidation zone)
- Major resistance: $66,900 (July high)
Bitcoin's current struggle at $63,000 represents a genuine test of buyer conviction 💪. While technical bounces remain possible, the combination of ETF outflows, bearish momentum indicators, and negative money flow creates a challenging environment for bulls. Traders should monitor the $62,000 liquidation cluster closely—a break below this level would signal that institutional and leveraged long positions are surrendering, potentially opening the door to a more significant decline.
The cryptocurrency market often rewards patience during periods of uncertainty. Whether Bitcoin finds buyers at current levels or experiences further downside will likely determine sentiment for the remainder of Q3 2026. 🎬✨
You May Also Like

Market Analysis
XRP Price Falls 5% as Leverage Hits Seven-Month High
August 26, 2026

Market Analysis
Crypto Market Hits Extreme Greed: What This Means for Bitcoin
August 26, 2026

Market Analysis
Ethereum Price Rally Overheats Below $2,550 Resistance
August 26, 2026

Market Analysis
Hyperliquid Price Rally: HYPE Targets $97 Amid $80 Support
August 25, 2026