Category:
Market AnalysisBitcoin Nears $63K: Saylor's BTC as Digital Energy

The cryptocurrency market is abuzz as Bitcoin hovers around the $63,000 mark, drawing attention from traders and analysts alike. The digital asset, often considered the bellwether of the crypto space, saw a slight uptick in its value, sparking discussions on its future trajectory.
Bitcoin Tests New Highs 🌟
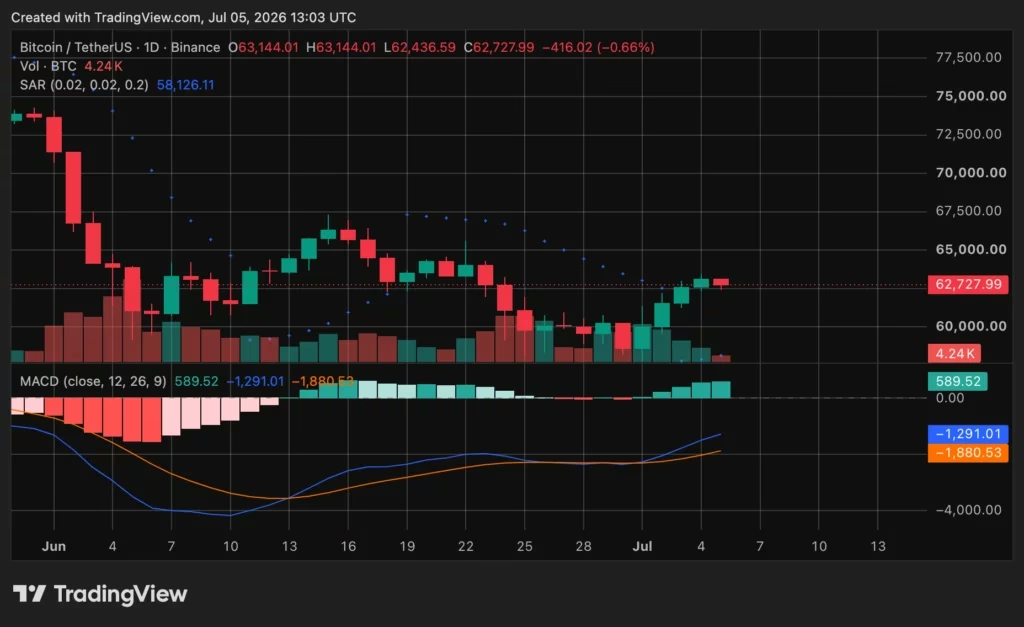
As of July 5, Bitcoin traded near $62,675, showcasing a modest increase over the past 24 hours. This movement has stirred the market, with traders speculating on whether the cryptocurrency can maintain its upward momentum.
One key factor in this price action is the weekly 200-day moving average (200MA), a critical technical indicator that traders are watching closely. Bitcoin’s ability to hold above this level could signal a sustained rally, while a drop below might indicate a potential pullback.
Michael Saylor's Perspective: Bitcoin as Digital Energy ⚡
Michael Saylor, a prominent Bitcoin advocate, recently sparked further interest with his description of Bitcoin as "Digital Energy." This concept aligns with his broader vision of Bitcoin’s role in the global financial ecosystem. Saylor emphasizes the importance of institutional adoption and capital market integration, suggesting that these factors will significantly influence Bitcoin's long-term value.
Market Dynamics and Short Squeezes 📈
The recent surge in Bitcoin's price has been partly attributed to short squeezes. This phenomenon occurs when traders betting against Bitcoin are forced to buy back their positions as the price rises, further propelling the asset’s value. Notably, the $63,000 mark has seen significant short clearing, indicating strong resistance at this level.
However, despite these positive signals, the trading volume remains weak, raising questions about the sustainability of this rally. For a robust upward movement, Bitcoin would need to break through the $65,000 resistance with higher trading volume.
Technical Indicators: A Mixed Bag 📊
Technically, Bitcoin's current setup presents a mixed outlook. The daily chart shows a falling wedge pattern, often seen as a bullish sign, combined with a bullish divergence on the Relative Strength Index (RSI). These indicators suggest that while bearish pressure is easing, confirmation of a breakout is still pending.
On the momentum front, the Moving Average Convergence Divergence (MACD) indicator shows improvement, albeit still below the zero line, indicating that the broader trend remains cautious.
Broader Market Implications 🌍
Bitcoin's recent movements are happening against a backdrop of broader market trends. The influence of U.S. Bitcoin Exchange-Traded Funds (ETFs) is becoming more pronounced, with capital flows into these financial instruments impacting Bitcoin's price dynamics. This shift highlights the increasing role of institutional players and capital markets in the cryptocurrency space.
Conclusion: The Path Ahead 🚀
As Bitcoin continues to test new highs, the market remains on edge. The key levels to watch are the weekly 200MA near $62,600 and the critical resistance at $65,000. A clear break above these levels, supported by strong trading volume, could mark the beginning of a new bullish phase.
In the meantime, Michael Saylor's vision of Bitcoin as "Digital Energy" offers a fascinating lens through which to view the cryptocurrency's potential as a transformative financial asset. As the market evolves, the interplay between technical indicators, institutional adoption, and innovative financial products will shape Bitcoin’s trajectory in the months to come.
You May Also Like

Market Analysis
Zcash Bulls Battle $500 Support Amid Ironwood Upgrade
July 24, 2026

Market Analysis
Ethereum Faces $2,000 Test Amid Oil Surge Fears
July 24, 2026

Market Analysis
Can Bitcoin Hold $65K Amid Inflation Fears?
July 24, 2026

Market Analysis
Bitcoin Slips to $65K Before $1.2B Options Expiry
July 24, 2026