Category:
Market AnalysisBitcoin Price Falls to $63K as CPI Rally Momentum Fades

Bitcoin's recent price action tells a compelling story about market sentiment and the delicate balance between macroeconomic data and cryptocurrency demand. 📉 On August 13, the leading digital asset slipped toward the $63,300 level, marking a notable pullback from earlier positions around $64,300. What makes this movement particularly significant is not just the price decline itself, but the underlying reasons—an in-line inflation report that failed to spark the bullish momentum traders had anticipated.
The CPI Report That Changed Nothing (And Everything) 📊
The U.S. Bureau of Labor Statistics delivered inflation data that matched market expectations precisely. Consumer Price Index readings showed a 0.1% monthly increase and 3.4% annual growth, both aligning with forecaster predictions. While the annual inflation figure represented a cooling from June's 3.5% rate, this "good news" paradoxically created a problem for Bitcoin bulls.
When markets price in an expected outcome before an announcement, the actual release rarely generates fresh buying interest—a phenomenon traders call "sell the news." Bitcoin had already incorporated expectations for softer inflation into its price structure, leaving the actual CPI print without enough catalytic power to drive a sustained rally above key resistance zones.
Understanding the Resistance Breakdown 🚧
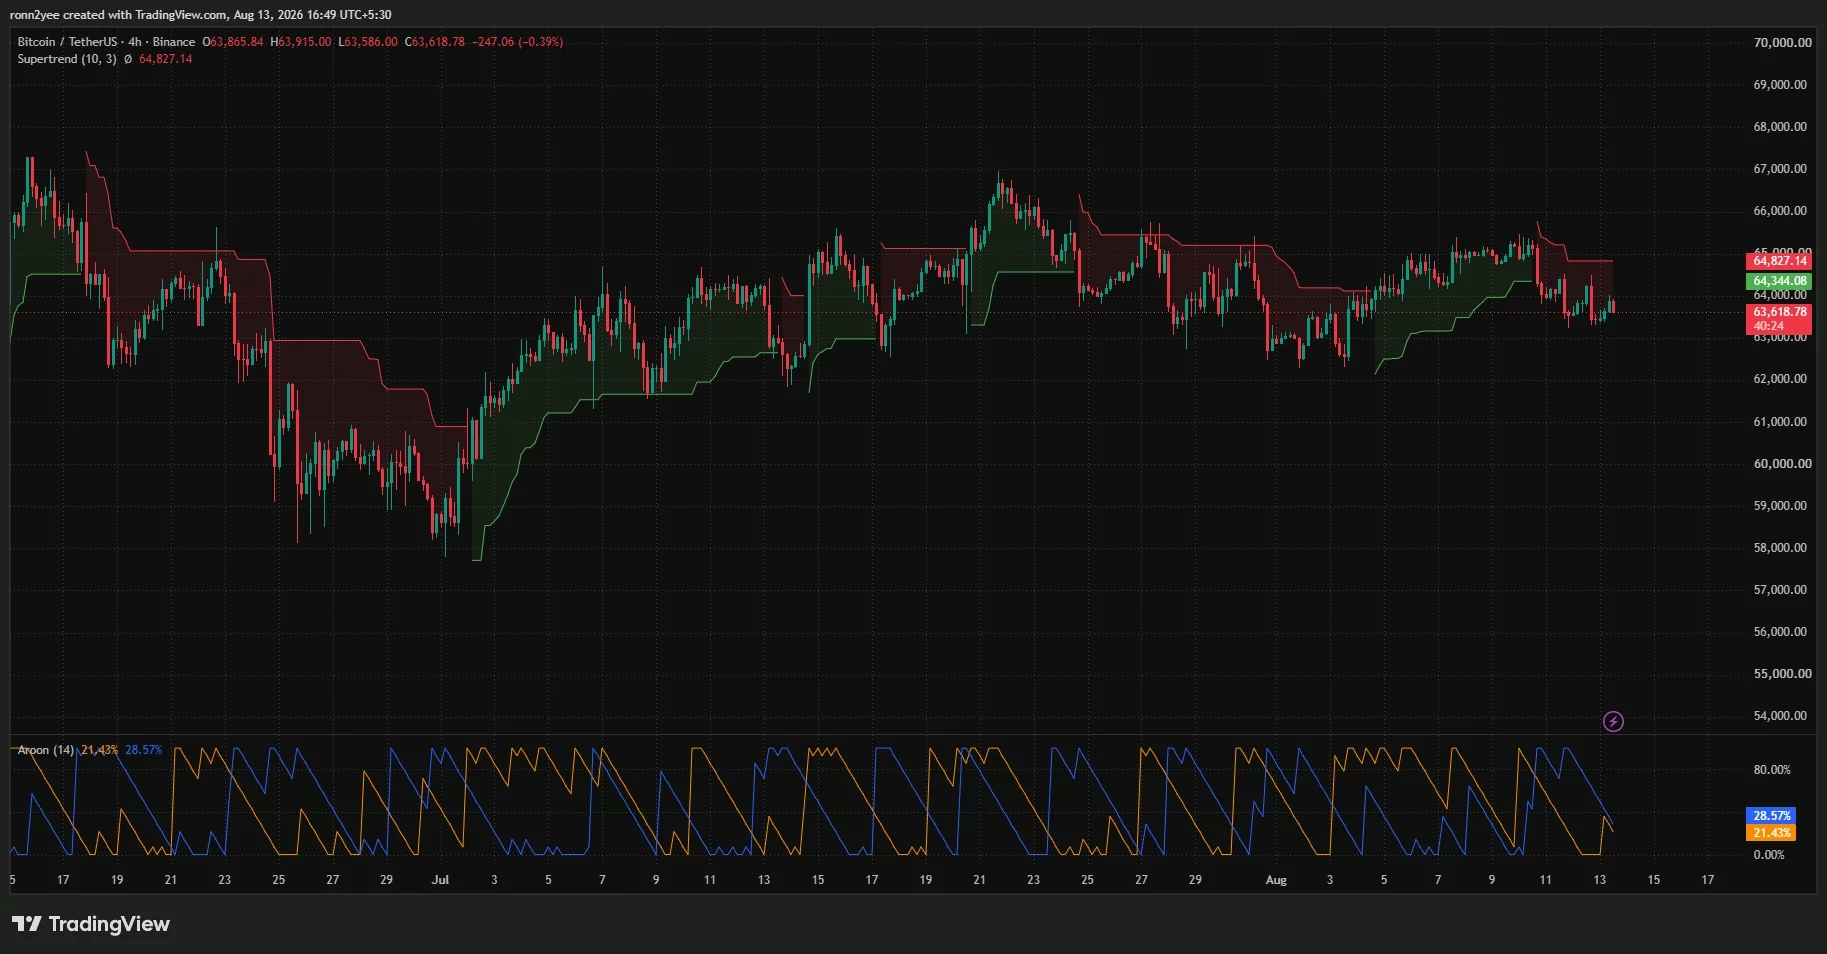
Bitcoin had been attempting to break through the $64,500–$65,000 resistance band for several trading sessions. Each attempt met aggressive selling pressure, preventing the market from confirming a higher high on the 4-hour timeframe. This repeated rejection wasn't random—it reflected genuine uncertainty among traders about whether macroeconomic conditions truly supported higher valuations.
The technical setup revealed a market struggling to find conviction. With Bitcoin trading around $63,620 during analysis, the price remained trapped below the critical breakdown area around $64,000. This positioning left traders vulnerable to sharp moves in either direction, depending on which liquidation clusters would be triggered first.
Why Core Inflation Matters More Than Headlines 💡
Core inflation—which strips out volatile food and energy prices—increased 0.2% monthly and 2.5% annually. This metric matters because it better reflects underlying price pressures the Federal Reserve targets. A sticky core reading suggested that despite headline inflation cooling, underlying economic pressures remained elevated, reducing the Fed's urgency to cut rates aggressively.
For Bitcoin, this nuance created ambiguity. Lower inflation expectations typically support risk assets, but persistent core inflation keeps the Fed cautious. This mixed message left institutional buyers hesitant to aggressively accumulate positions, contributing to the weak demand environment.
Technical Indicators Shift Bearish ⚠️
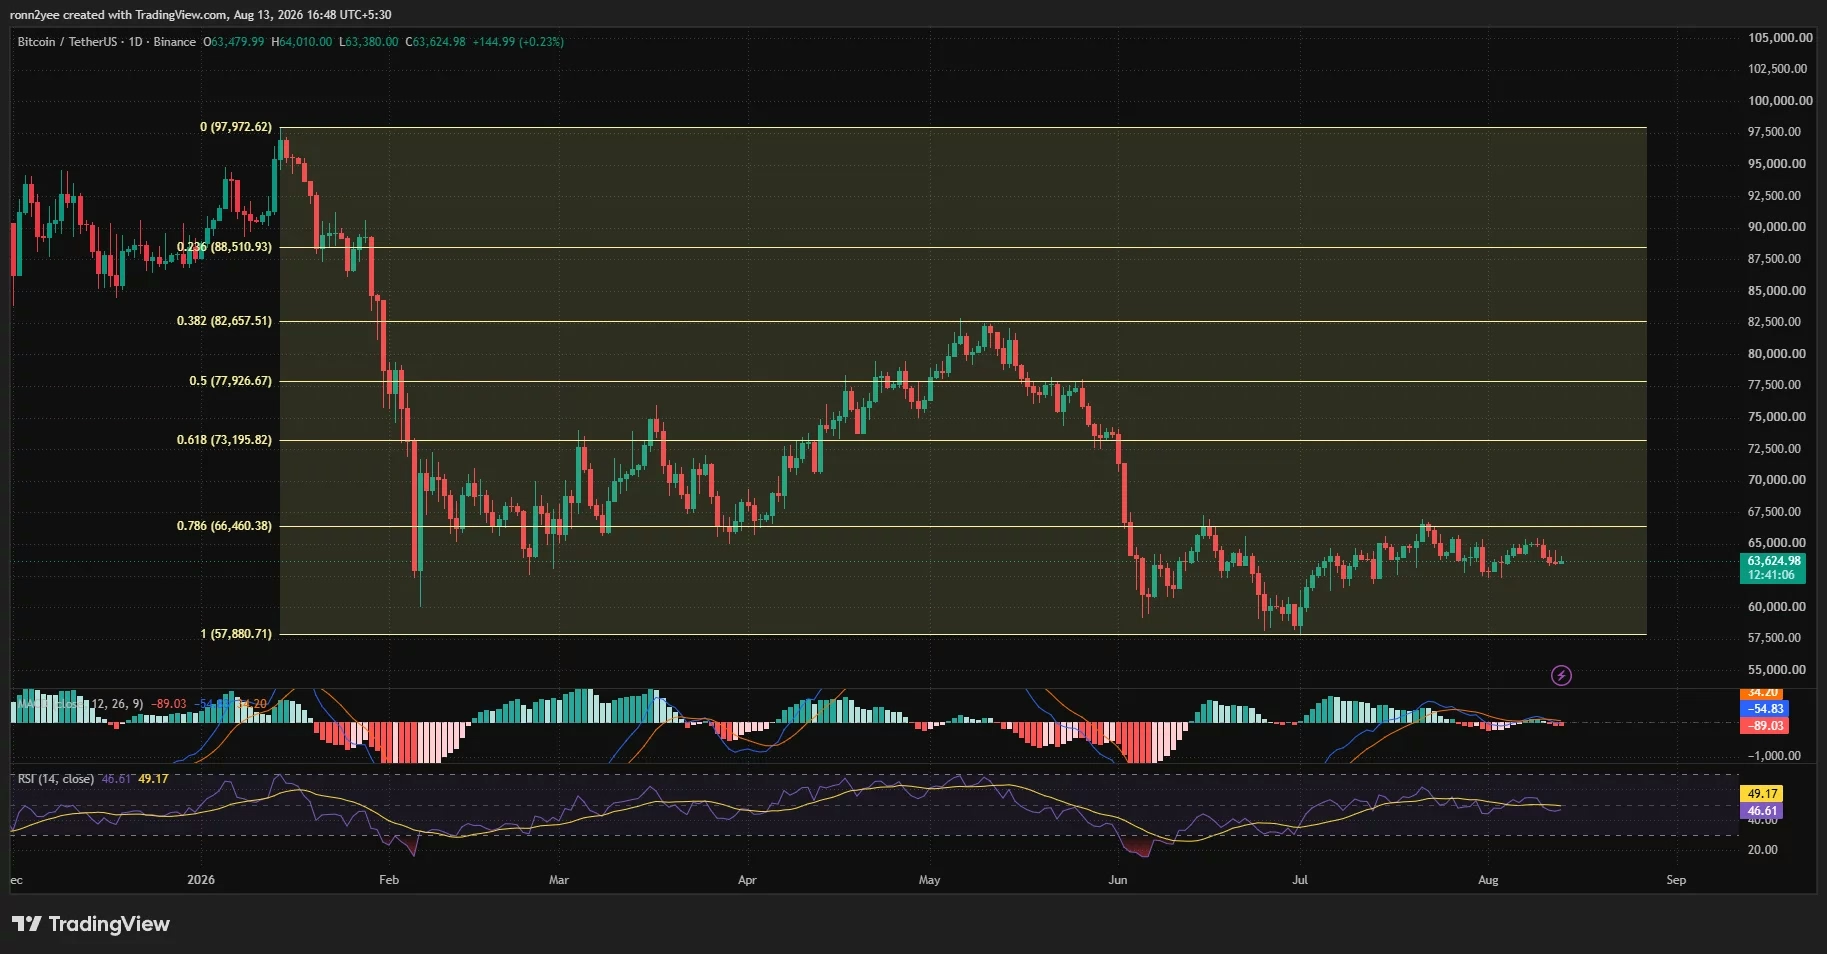
The daily chart painted a cautious picture for bulls. Bitcoin remained firmly below the 0.786 Fibonacci retracement level at $66,460—a threshold derived from the decline from $97,973 to $57,881. Every rebound attempt since late July had been capped near this level, establishing it as formidable resistance.
Momentum indicators confirmed the shift in sentiment. The daily Relative Strength Index fell to 46.61, below both its signal average (49.17) and the neutral 50 level. While this reading didn't signal oversold conditions, it clearly favored sellers. The Moving Average Convergence Divergence (MACD) showed renewed bearish pressure, with its histogram turning negative—a sign that the rebound from early July was losing steam.
Liquidation Levels: The Danger Zones 🎯
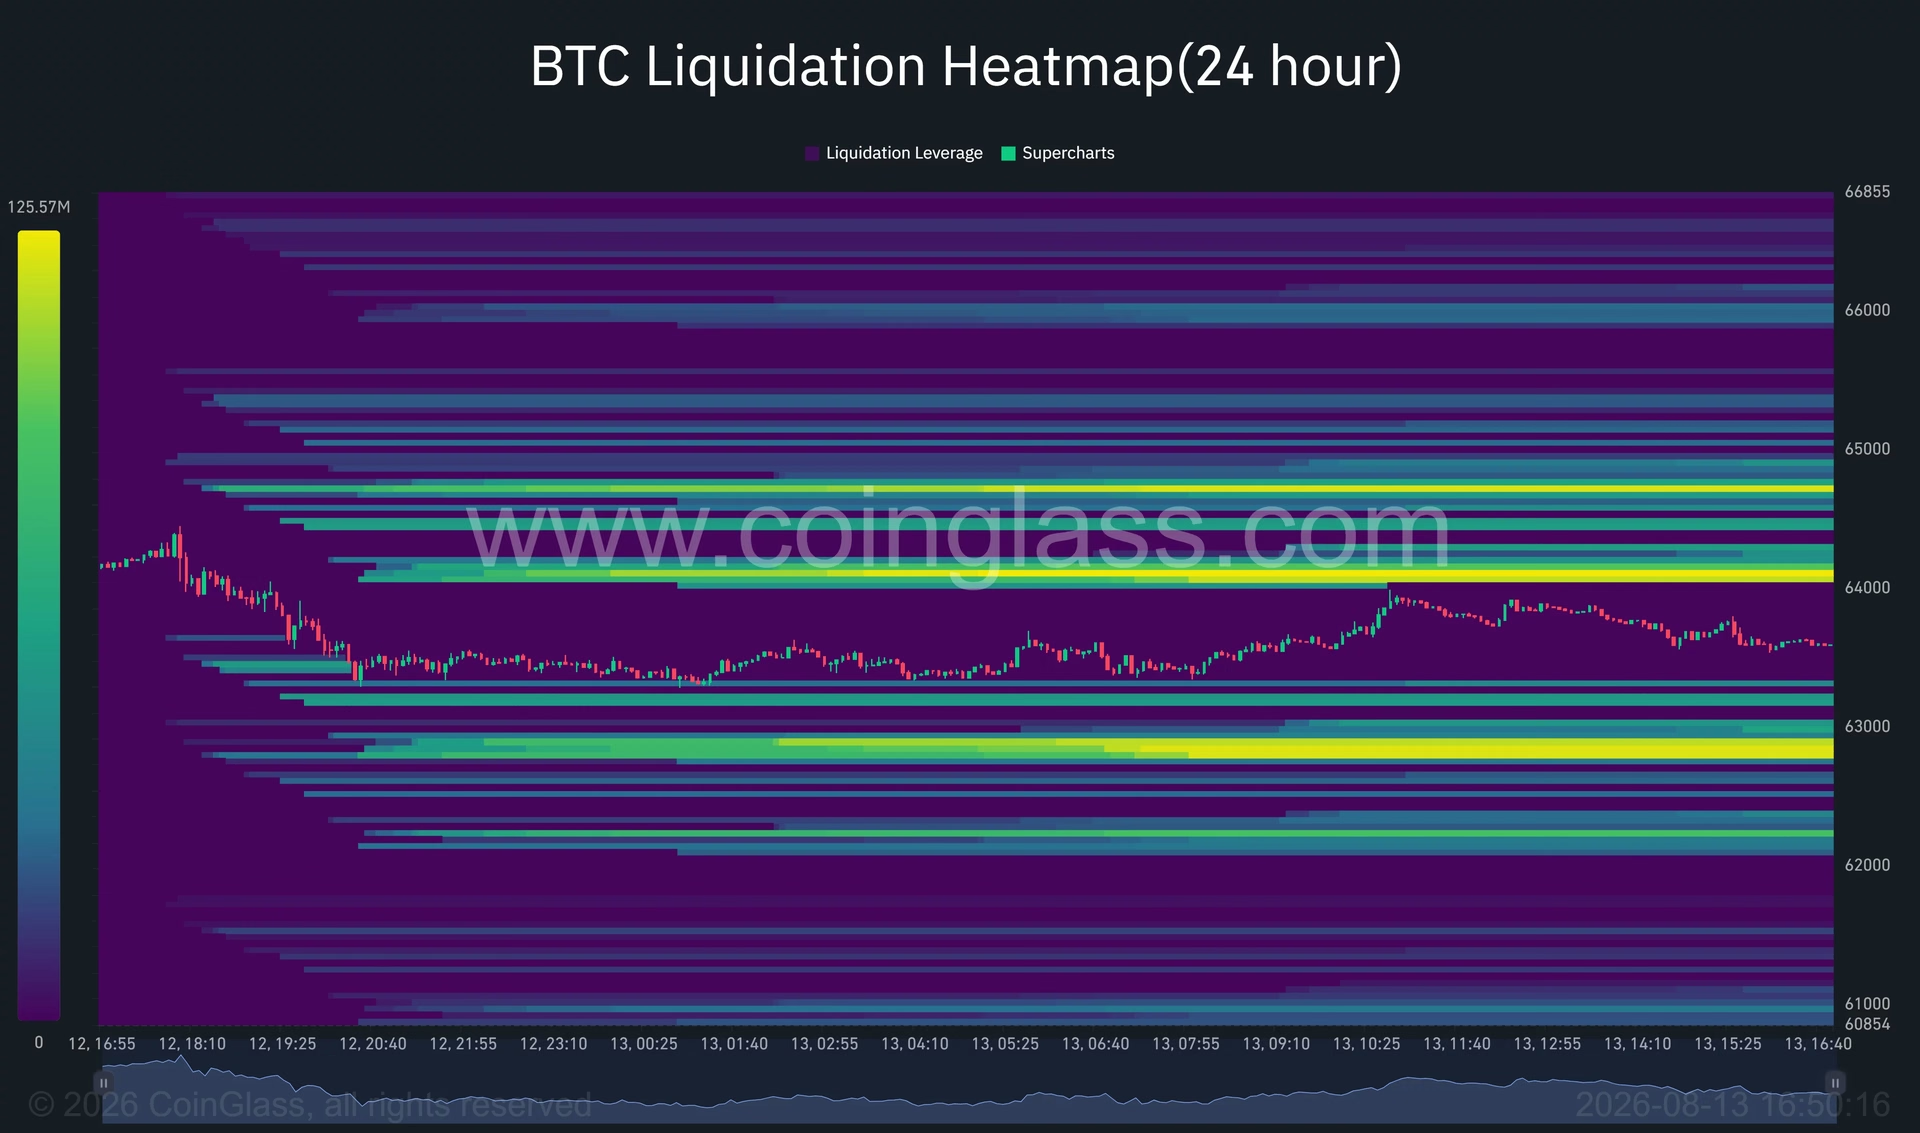
Understanding where traders have positioned their stop losses reveals critical price levels where rapid moves can occur. The 24-hour liquidation heatmap identified substantial clusters around $64,050 and $64,700–$64,800 on the upside. If Bitcoin recovered through $64,000, these positions would face forced liquidations, potentially accelerating any rally.
Downside liquidation concentrations appeared more dangerous. The $62,800–$62,900 zone contained significant short positions, with additional clusters between $62,200 and $62,400. Breaking below $63,300 could trigger a cascade of liquidations that might push Bitcoin toward the $62,000–$62,500 support range identified by technical analysts.
The market's positioning left Bitcoin almost equidistant from major upside and downside liquidity pools—a precarious position vulnerable to sharp moves in either direction before a sustained trend develops.
What Happens If Support Breaks? 📍
If Bitcoin fails to defend the $62,800 cluster, the next critical support emerges at $62,000–$62,500. Should that level also fail, the late-June low around $59,000 comes into focus, followed by the major Fibonacci floor at $57,881. This cascading support structure suggests the downside isn't unlimited, but Bitcoin would need to hold multiple levels to prevent a deeper correction.
The ETF Factor and Institutional Flows 🏦
Analysts noted that renewed selling pressure from Bitcoin exchange-traded funds may have contributed to weakness. ETF flows have become an important barometer for institutional sentiment, though recent data has been mixed. Some reporting sessions showed outflows while others indicated inflows, suggesting institutional investors remain undecided about Bitcoin's near-term direction.
This uncertainty reflects a broader challenge: Bitcoin has become increasingly sensitive to interest-rate expectations. When financial conditions tighten, demand for risk assets declines. Conversely, when the Fed signals easing, Bitcoin typically rallies. The August CPI report didn't provide clear direction on either front, leaving institutions in a holding pattern.
On-Chain Metrics Signal Holder Stress 🔗
On-chain analysis revealed that approximately 45–46% of Bitcoin's total supply was held at unrealized losses. While this metric might sound alarming, experienced analysts interpret it differently than retail traders might expect. Rather than indicating a market top, this reading more accurately reflects "advanced holder stress"—a condition where long-term holders face paper losses but haven't capitulated.
Historically, true capitulation events occur when this percentage reaches much higher levels (70%+), often coinciding with market bottoms rather than tops. The current reading suggests the market is closer to a potential stabilization point than a crash, though significant downside risk remains in the near term.
What Bitcoin Needs to Reverse Course 🔄
For a genuine bullish reversal, Bitcoin must accomplish several technical milestones. First, it needs to reclaim and sustain the $64,500–$65,000 resistance zone with conviction. This breakout would need to be accompanied by increasing trading volume to signal genuine institutional participation rather than a false breakout.
If Bitcoin successfully clears $65,000, the next target emerges at $66,460—the 0.786 Fibonacci retracement. Breaking through that level would weaken the bearish structure and potentially open a path toward the 0.618 Fibonacci level at $73,196. However, these scenarios remain conditional on market sentiment shifting meaningfully.
Looking Ahead: Economic Data as the Catalyst 🔮
The next U.S. inflation and labor reports now carry heightened importance. These releases could significantly alter expectations for the Federal Reserve's remaining 2026 meetings, which in turn would impact Bitcoin's trajectory. The cryptocurrency market has learned that macroeconomic surprises matter more than in-line data—volatility follows unexpected outcomes.
Traders should monitor upcoming employment figures and subsequent CPI releases closely. A surprise in either direction could provide the catalyst Bitcoin needs to break free from its current $62,000–$65,000 trading range and establish a new trend.
Key Takeaways for Bitcoin Investors 📌
The current environment requires patience and discipline. Bitcoin's consolidation between $62,000 and $65,000 represents a critical decision point. The market is determining whether recent highs near $67,000 represent a temporary peak or a stepping stone toward higher levels.
Technical indicators favor caution. With the daily RSI below neutral, MACD showing bearish pressure, and price capped by Fibonacci resistance, the near-term bias remains to the downside unless Bitcoin can generate unexpected strength.
Liquidation levels matter more than ever. In range-bound markets, these clusters become self-fulfilling prophecies. Understanding where they sit helps traders anticipate potential flash crashes or rapid rallies.
Macro sensitivity cuts both ways. Bitcoin's growing correlation with interest-rate expectations means that future inflation reports and Fed communications will drive more volatility. Investors should prepare for sharper moves rather than gradual trends.
The Bitcoin market's current state reflects broader uncertainty in financial markets. Until macroeconomic data provides clearer directional signals, expect continued volatility around key technical levels. The next major move will likely follow an unexpected economic development rather than an in-line report. 🚀
You May Also Like

Market Analysis
XRP Price Falls 5% as Leverage Hits Seven-Month High
August 26, 2026

Market Analysis
Crypto Market Hits Extreme Greed: What This Means for Bitcoin
August 26, 2026

Market Analysis
Ethereum Price Rally Overheats Below $2,550 Resistance
August 26, 2026

Market Analysis
Hyperliquid Price Rally: HYPE Targets $97 Amid $80 Support
August 25, 2026