Category:
Market AnalysisEthereum Price Faces $1,850 Risk After $1,900 Loss

Understanding Ethereum's Recent Price Pressure 📉
Ethereum's recent trading session revealed significant volatility as ETH declined 2.4% from an intraday peak of $1,918 to a low of $1,872, slipping decisively below the psychological $1,900 threshold. This pullback emerged following the release of U.S. inflation data, which ultimately failed to provide the catalyst traders anticipated for sustained upward momentum. The cryptocurrency market's muted response to the Consumer Price Index report underscores how macroeconomic expectations, rather than surprises, increasingly shape digital asset valuations.
The decline represents more than a routine correction—it reflects the delicate balance between speculative positioning and fundamental support levels that currently define Ethereum's technical landscape. Understanding the mechanics behind this selloff requires examining both the immediate catalysts and the deeper structural challenges confronting the network.
The Inflation Data Disappointment 💹
When the U.S. Bureau of Labor Statistics released July's inflation figures, markets received exactly what they expected—nothing more, nothing less. Headline inflation rose 0.1% month-over-month and 3.4% annually, while core inflation increased 0.2% monthly and 2.5% year-over-year. All four readings aligned perfectly with consensus forecasts, eliminating any surprise factor that might have sustained bullish momentum.
This "no news is no news" scenario proved problematic for Ethereum's near-term technicals. Traders who had accumulated positions ahead of the CPI release were banking on an inflation surprise—either higher readings that might accelerate Federal Reserve rate cuts or lower figures that would confirm disinflationary trends. Instead, the matched expectations removed both upside and downside catalysts, leaving only profit-taking as the dominant force.
Ethereum had already climbed to $1,918 before the report, positioning itself to capitalize on a bullish surprise. When the data failed to deliver, the initial buyers reversed course, and the lack of fresh conviction among new accumulation efforts allowed the decline to accelerate. This pattern reflects a broader cryptocurrency market characteristic: digital assets often rally into major economic announcements, then reverse when expectations are met rather than exceeded.
Technical Breakdown: Key Support Levels at Risk ⚠️
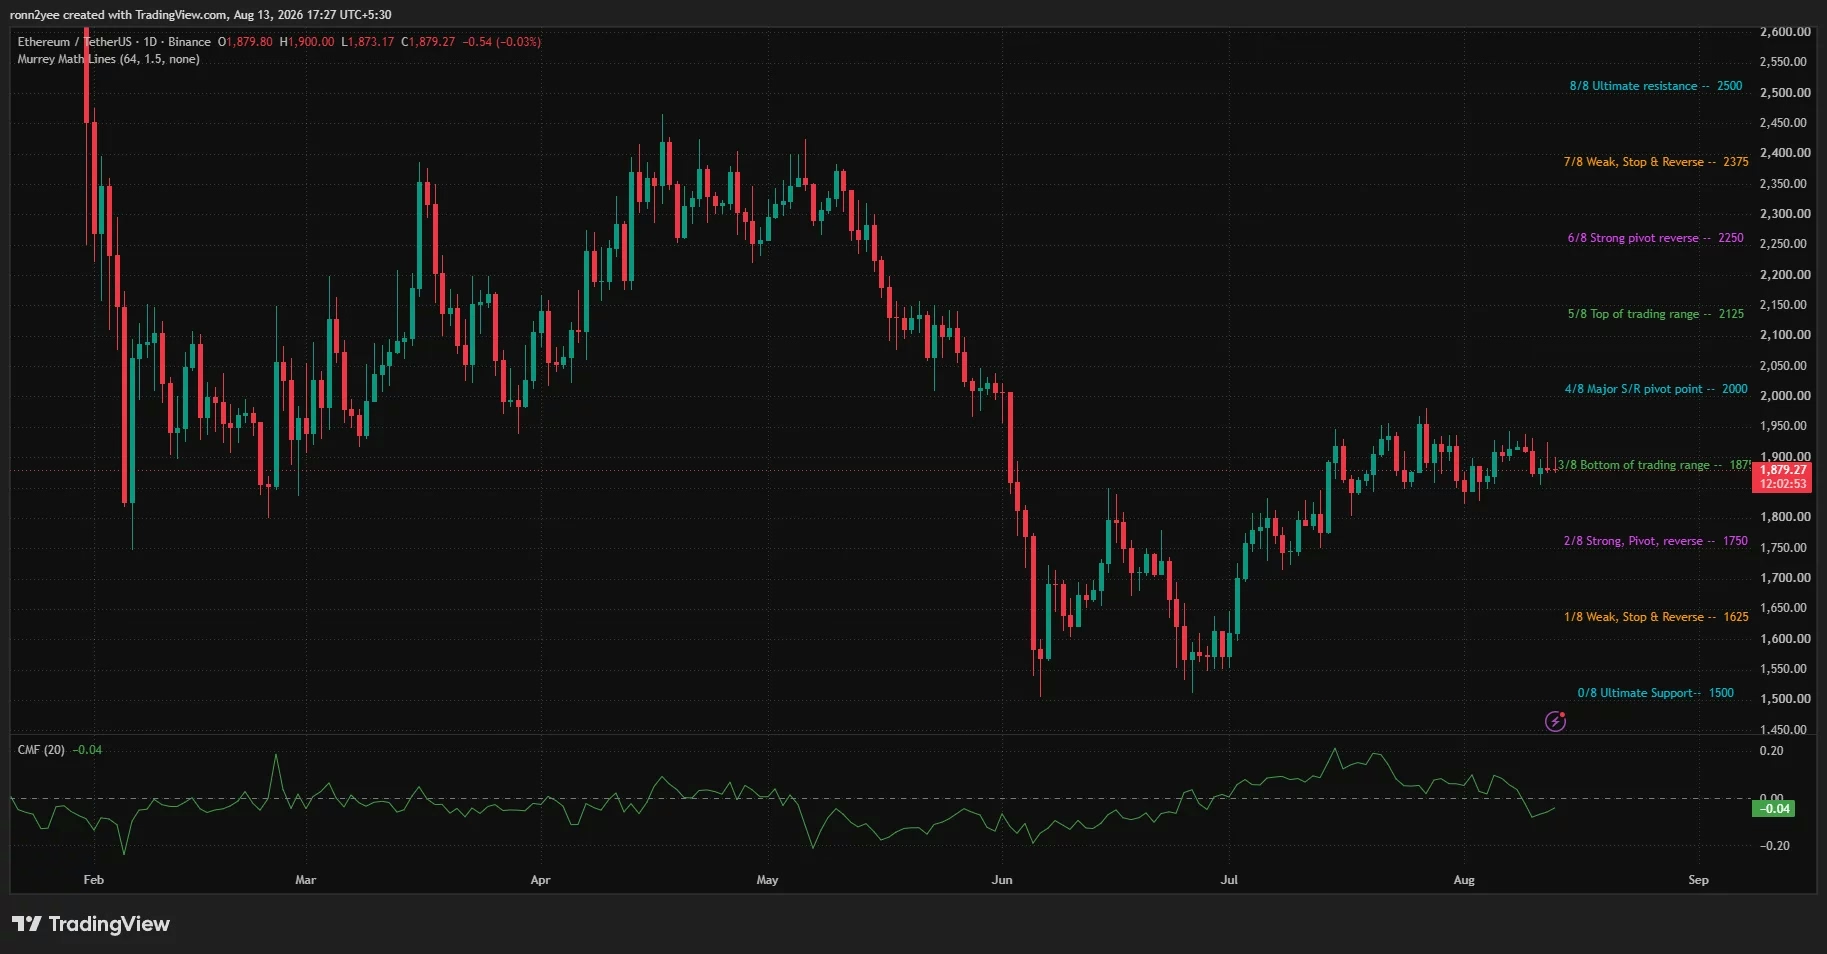
The immediate support structure surrounding Ethereum's current price reveals why the $1,850 level has become such a critical juncture. The $1,875 Murrey Math level represents the bottom of Ethereum's consolidation range that has persisted since late July, serving as the first line of defense against deeper losses.
However, the technical picture grows more concerning below that threshold. The 4-hour Bollinger Band lower boundary sits near $1,857, while the midpoint rests around $1,888. Ethereum's failure to maintain positioning above the midpoint suggests weakening short-term momentum, with the 4-hour Relative Strength Index reading 45.15—below both its signal line and the neutral 50 level.
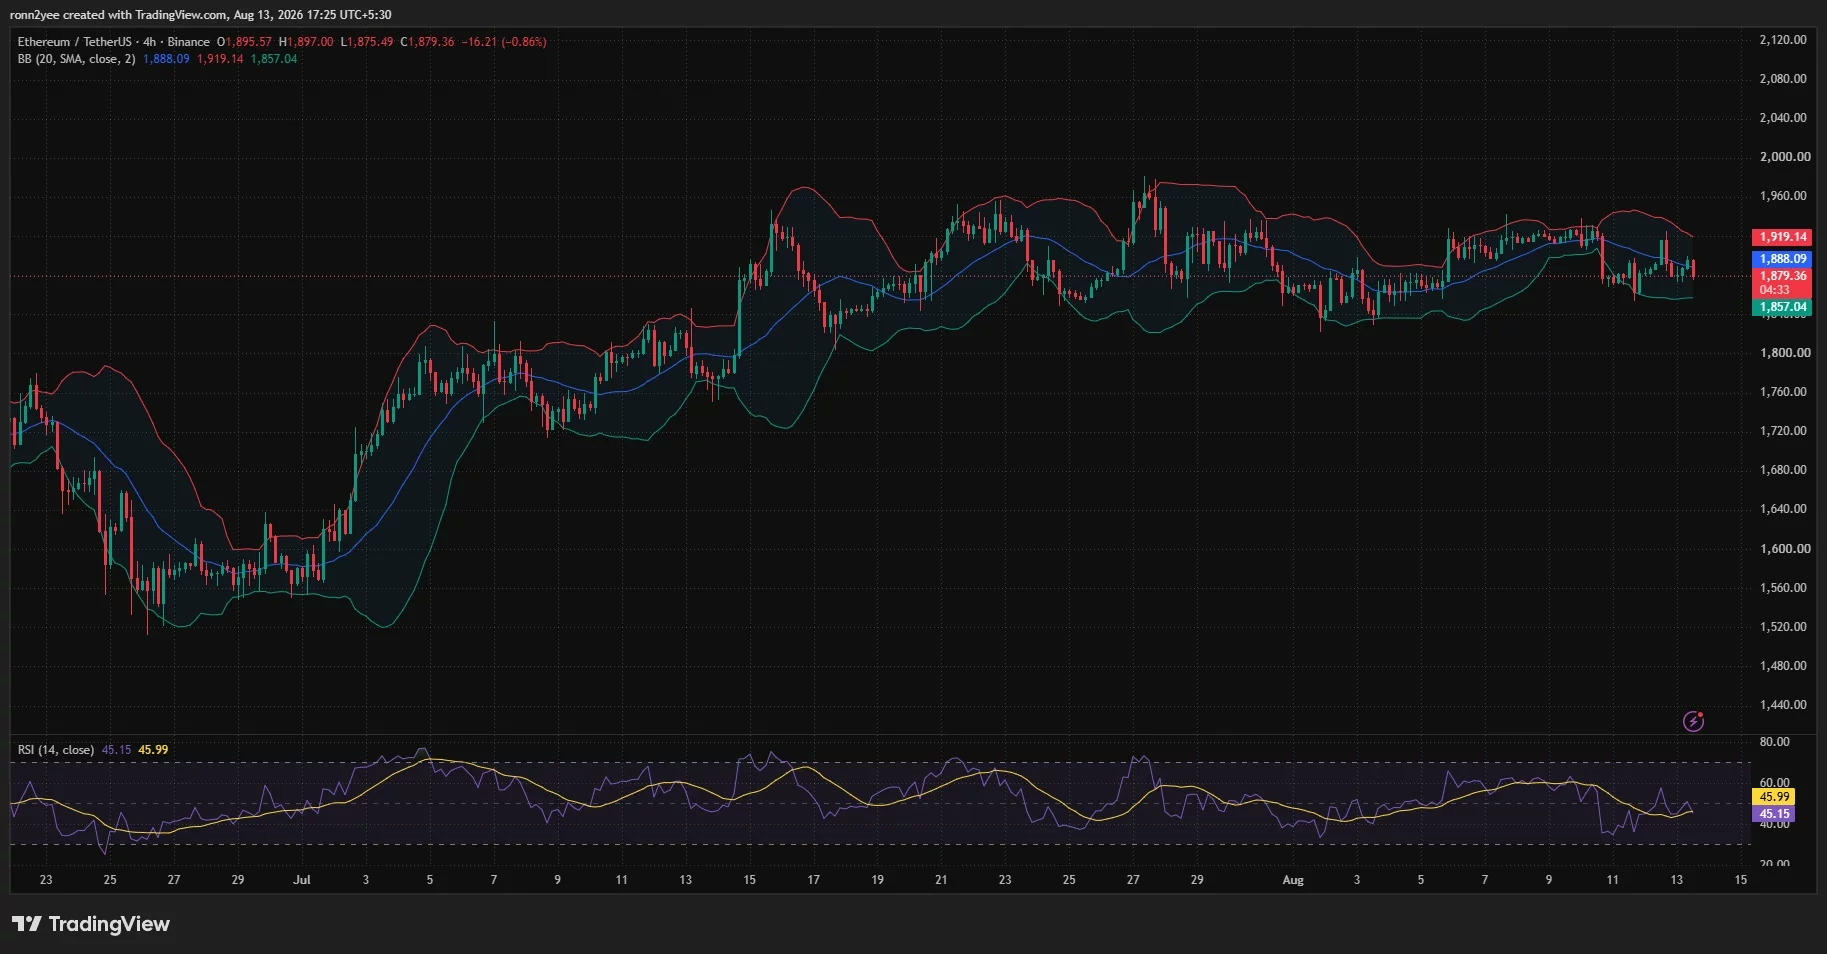
Daily Chaikin Money Flow at -0.04 indicates that capital flows have shifted marginally toward sellers, though not dramatically. This reading suggests neither strong accumulation nor capitulation, leaving room for either direction depending on which support level proves decisive.
The broader downside scenario presents a cascade of deteriorating support levels:
- $1,875: Immediate support (Murrey Math level)
- $1,857: 4-hour Bollinger Band lower boundary
- $1,850: Critical psychological and technical support
- $1,835-$1,840: Secondary support cluster
- $1,750: Major pivot support from the daily chart
A break below $1,850 would represent a significant technical failure, potentially opening the path toward $1,835 and ultimately the $1,750 major support zone. Each of these breaches would remove key technical anchors that traders rely upon for position management.
The Layer 2 Dilemma: Structural Headwinds for Ethereum 🔗
Beyond immediate technical concerns, Ethereum faces a more insidious structural challenge rooted in the network's evolving fee economy. The proliferation of Layer 2 solutions—including Arbitrum, Optimism, and Polygon—has successfully reduced transaction costs and expanded the ecosystem's throughput capacity. However, this efficiency improvement has created an unintended consequence that pressures Ethereum's supply narrative.
Ethereum's base fees are burned, meaning they're permanently removed from circulation. This deflationary mechanism has been central to Ethereum's value proposition, particularly during bull markets when transaction activity surges. However, as Layer 2 networks mature and capture increasing transaction volumes, the fee economy dynamics shift dramatically.
Recent academic research analyzing data through March 2026 documented a stunning transformation: Ethereum mainnet median fees collapsed from more than $2 to below $0.02, while Layer 2 median fees declined by more than 95%. This represents a fundamental restructuring of the network's economic model. While users celebrate lower costs, the weaker burn rate during periods of muted demand makes Ethereum's supply narrative less compelling to investors focused on deflationary mechanics.
The Layer 2 networks do continue paying Ethereum for data availability and settlement, preserving some fee flow to the base layer. However, this revenue stream doesn't match the economic impact of direct transaction fees, leaving the long-term valuation implications contested among analysts and developers.
This structural shift explains why Ethereum has struggled to sustain rallies above $1,920-$1,950 since late July. The market has internalized that lower fees mean slower burn rates, reducing one of the primary bullish arguments that drove previous bull cycles.
Liquidation Heatmap: A Two-Sided Volatility Setup 🎯
The liquidation landscape reveals why the current price action matters disproportionately to the percentage decline alone. CoinGlass's one-week liquidation heatmap shows a dramatic concentration of leveraged positions clustered above Ethereum's current trading level.
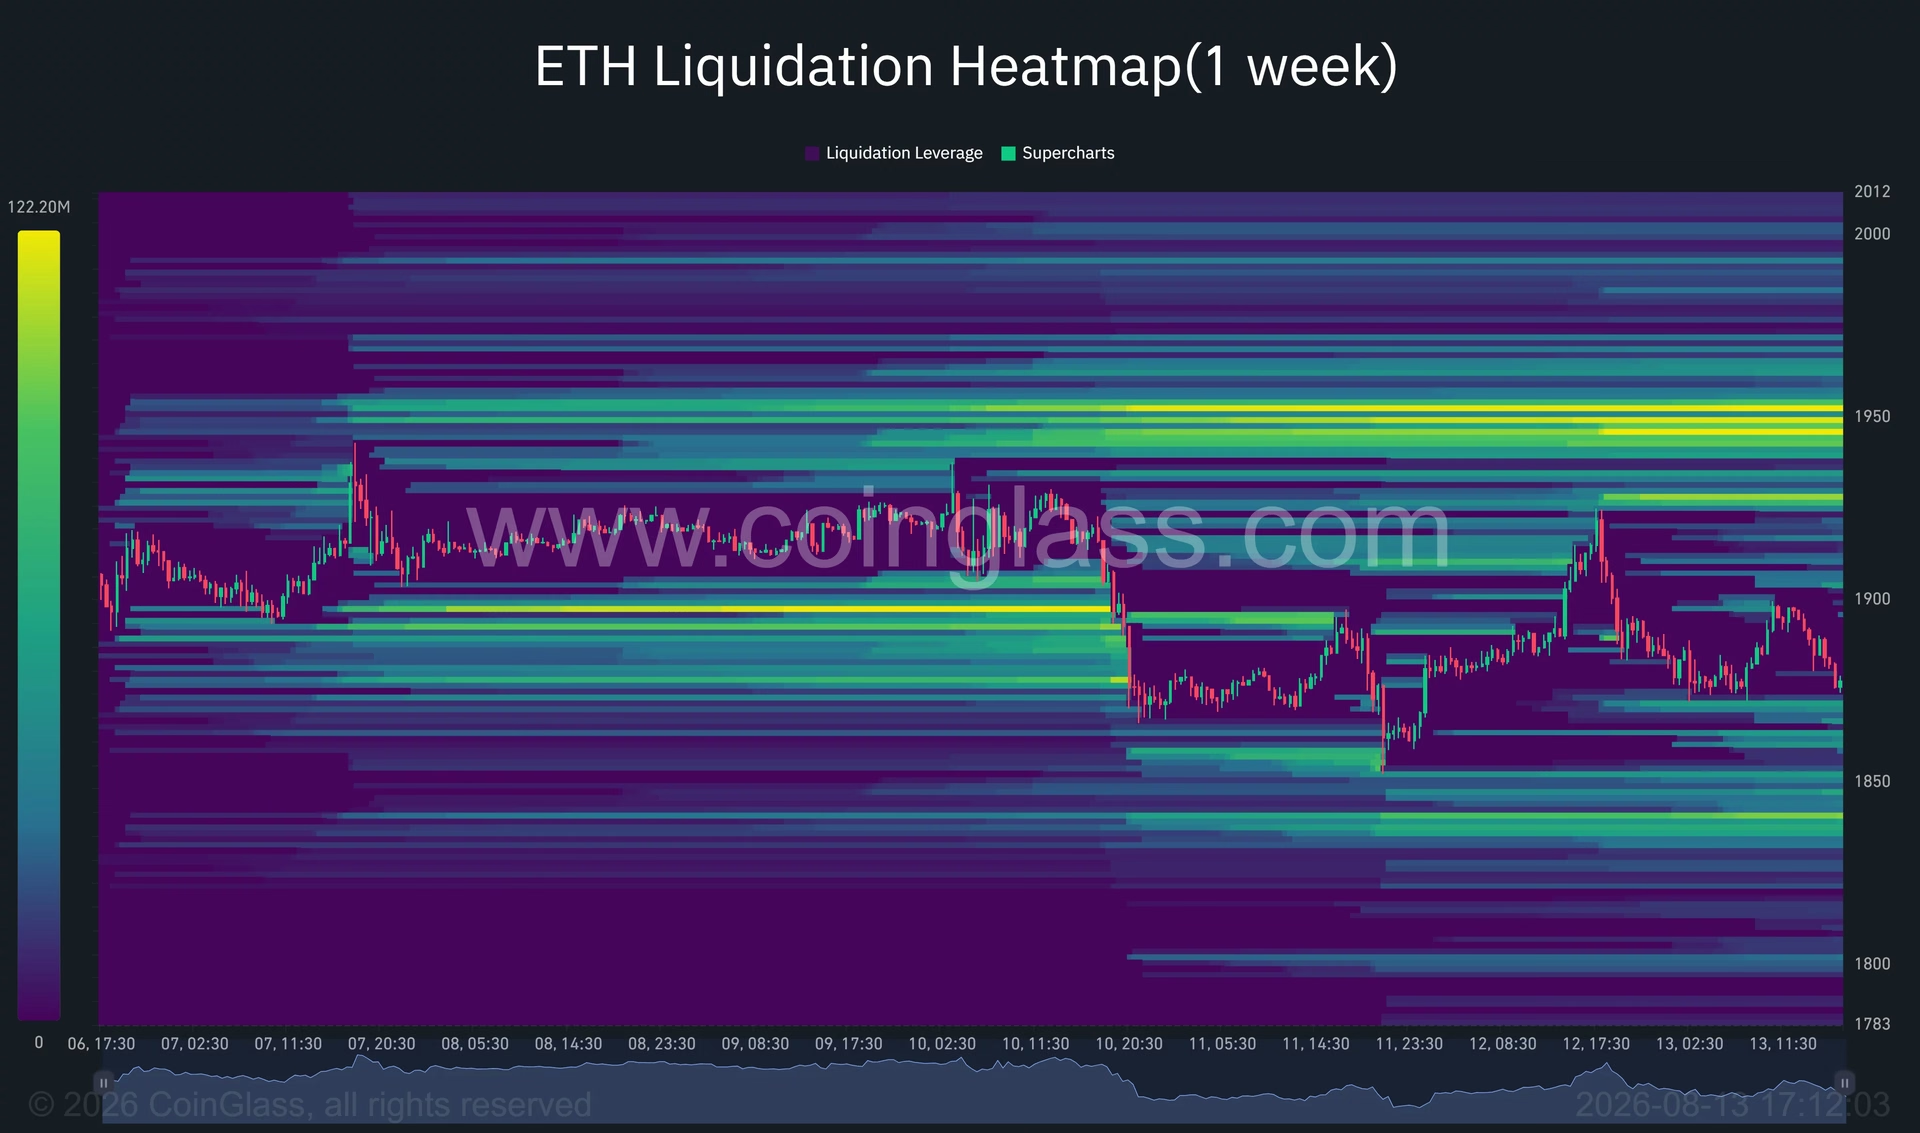
A bright cluster of liquidation liquidity extends across approximately $1,945-$1,955, with additional leveraged positions near $1,925 and $1,970. This overhead concentration creates what traders call a "price magnet"—a zone where forced liquidations could accelerate a move if Ethereum recovers above $1,920. Conversely, short positions closed in this zone could fuel upside momentum if the price reaches these levels.
Downside liquidation liquidity proves less concentrated but remains meaningful around $1,850 and $1,835-$1,840. A breakdown below the lower 4-hour Bollinger Band could send Ethereum toward these pools, forcing additional leveraged long positions into liquidation and potentially accelerating the decline.
This two-sided setup transforms the current consolidation into a critical decision point. The response around $1,875 matters more than the raw percentage decline because it determines whether Ethereum approaches the overhead liquidation cluster or the downside liquidity pools—with dramatically different implications for the next trading phase.
Resistance and Recovery Scenarios 📈
For Ethereum to stabilize and potentially recover, specific technical hurdles must be cleared in sequence. A recovery above $1,888 would represent the first signal that buyers are regaining short-term control. However, this represents only a preliminary test.
The more significant resistance emerges around $1,919-$1,925, where Ethereum has repeatedly encountered sellers since late July. The daily chart shows multiple failed attempts to establish closes above $1,925, with rallies toward $1,950 consistently producing long upper wicks or quick reversals. This resistance zone has proven remarkably durable, suggesting that overhead supply remains substantial.
Only by reclaiming the $1,919-$1,925 zone could Ethereum challenge the $1,950 supply level and potentially open a path toward the major $2,000 pivot that many traders monitor as a key psychological and technical target. Reaching $2,000 would represent a recovery of roughly 7% from current levels and would likely require new positive catalysts beyond mere technical recovery.
Market Context: Bitcoin's Muted Response 🔗
Ethereum's struggle shouldn't be viewed in isolation. Bitcoin remained anchored near $64,000 following the inflation data, indicating that the broader cryptocurrency market received minimal directional impetus from the CPI release. This synchronized weakness across major digital assets reflects how cryptocurrency markets have matured—increasingly responding to macroeconomic expectations rather than individual asset fundamentals.
When Bitcoin and Ethereum both fail to rally on an inflation report that meets expectations, it signals that the market has already priced in current Federal Reserve policy assumptions. Traders are now waiting for either policy surprises or fundamental developments specific to individual projects to drive the next directional move.
What Traders Are Watching 👀
Market participants are focused on several key technical levels and developments:
Immediate Support: The $1,875 Murrey Math level remains the critical hold point. Losing this would confirm a breakdown of the consolidation structure that has contained price action since late July.
Psychological Barriers: The $1,850 level carries both technical and psychological significance. Breaking below it would eliminate a round-number support that many traders monitor and could trigger additional selling from stop-loss orders clustered in that area.
Overhead Resistance: The $1,920-$1,950 zone continues to present formidable resistance, with liquidation liquidity concentrated around $1,945-$1,955 creating a potential price magnet if bulls regain momentum.
ETH/BTC Dynamics: Some analysts are monitoring Ethereum's performance relative to Bitcoin, watching for breakout signals that might indicate whether altcoins are gaining or losing relative strength during the current market phase.
Conclusion: A Critical Juncture Ahead 🎬
Ethereum stands at a technical and structural crossroads. The $1,850 risk level isn't merely a statistical support zone—it represents the boundary between consolidation and potential breakdown. The combination of weakening momentum indicators, modest capital outflows, and structural headwinds from the Layer 2 fee economy creates a cautious near-term backdrop.
However, the two-sided liquidation setup means that while downside risks are real, any recovery above $1,920 could accelerate quickly as short positions close and trapped bulls exit. The key for traders lies in monitoring the response around $1,875 and watching whether buyers emerge with sufficient conviction to challenge the overhead resistance zones.
The broader narrative remains constructive for Ethereum's long-term prospects—the network continues evolving, Layer 2 adoption expands, and fundamental development proceeds. However, the near-term trading setup demands respect for technical levels and caution regarding the structural shifts reshaping Ethereum's fee economy. ✨
For investors and traders, the current environment rewards disciplined risk management, clear entry and exit criteria, and patience for confirmatory signals before committing capital to directional bets.
You May Also Like

Market Analysis
XRP Price Falls 5% as Leverage Hits Seven-Month High
August 26, 2026

Market Analysis
Crypto Market Hits Extreme Greed: What This Means for Bitcoin
August 26, 2026

Market Analysis
Ethereum Price Rally Overheats Below $2,550 Resistance
August 26, 2026

Market Analysis
Hyperliquid Price Rally: HYPE Targets $97 Amid $80 Support
August 25, 2026