Category:
Market AnalysisBitcoin Falls Below $64K as CPI Data Disappoints

Bitcoin's recent price action tells a compelling story of market expectations colliding with reality. 📉 After climbing toward $65,234, the world's largest cryptocurrency retreated sharply to $63,304 following the release of July inflation data—a move that reveals much about how institutional investors are currently positioned and where the market stands in its broader recovery cycle.
The CPI Release That Changed Nothing
On a typical trading day, major economic data releases can spark significant volatility across cryptocurrency markets. However, when the U.S. Bureau of Labor Statistics announced that July headline inflation rose just 0.1% month-over-month and decelerated to 3.4% annually from 3.5% in June, Bitcoin traders responded with a collective shrug. 😐
Core inflation, which strips out volatile food and energy prices, climbed 0.2% monthly and 2.5% annually—figures that matched economist forecasts almost precisely. This alignment between expectations and reality meant there was no surprise factor to drive a significant breakout move. Instead of igniting renewed buying enthusiasm, the report demonstrated a critical market dynamic: Bitcoin price action had already priced in the inflation slowdown before the official numbers arrived.
The Treasury market responded predictably, with the 10-year yield declining slightly but remaining stubbornly elevated near 4.68%. The U.S. dollar weakened marginally, but these modest adjustments failed to provide the catalyst Bitcoin needed to sustain momentum above $65,000. This "sell-the-news" pattern has become increasingly common in mature markets where participants extensively front-run anticipated economic releases.
Why Employment Data Mattered More Than Inflation
Here's where the narrative becomes more nuanced. 🔍 While the inflation report landed exactly where markets expected, the employment situation painted a different picture entirely. U.S. nonfarm payrolls contracted by 23,000 in July—a shocking reversal compared to the anticipated gain of approximately 80,000 positions. Even more concerning, the Bureau of Labor Statistics revised downward May and June employment figures by a combined 103,000 jobs.
This employment weakness had outsized implications for interest-rate expectations. Rate futures immediately repriced the probability of a September Federal Reserve rate hike downward from roughly 57% to 44%—a significantly larger repricing than what followed the in-line CPI data. Analysts estimated the probability declined further to the low-40% range after considering all the economic signals together.
For Bitcoin investors, softer employment data theoretically supports risk assets by reducing the likelihood of aggressive monetary tightening. Yet this benefit has been muted because Treasury yields remain elevated, continuing to provide attractive alternatives to volatile cryptocurrencies. The real story isn't what happened on any single day—it's that Bitcoin remains trapped in a $62,000 to $66,000 trading range with no clear catalysts for a decisive breakout.
Institutional Flows Paint a Mixed Picture
The institutional Bitcoin narrative has shown encouraging signs recently, though these gains appear fragile. 💰 U.S. spot Bitcoin exchange-traded funds attracted approximately $850 million during the week prior to the CPI release—their strongest weekly performance since April. BlackRock's IBIT led the charge with roughly $694 million in inflows, suggesting that some institutional capital remains interested in accumulating Bitcoin exposure.
However, this institutional buying pressure faces headwinds from persistent selling by miners and corporate holders. Strategy Advisors disclosed the sale of 1,690 BTC for $108.6 million at an average price of $64,262—marking the fourth consecutive week of Bitcoin liquidations by the firm. Over a four-week period, Strategy has sold approximately 6,916 BTC valued at roughly $429.4 million, representing a consistent supply of coins hitting the market precisely at levels where institutional demand is attempting to establish positions.
This dynamic creates what analysts describe as an "absorption phase"—a period where returning institutional interest encounters existing supply, preventing the market from breaking through established resistance levels. The failure to sustain momentum above $66,000 suggests that the transition from accumulation into a more aggressive markup phase remains incomplete and uncertain.
Technical Indicators Suggest Further Downside Risk
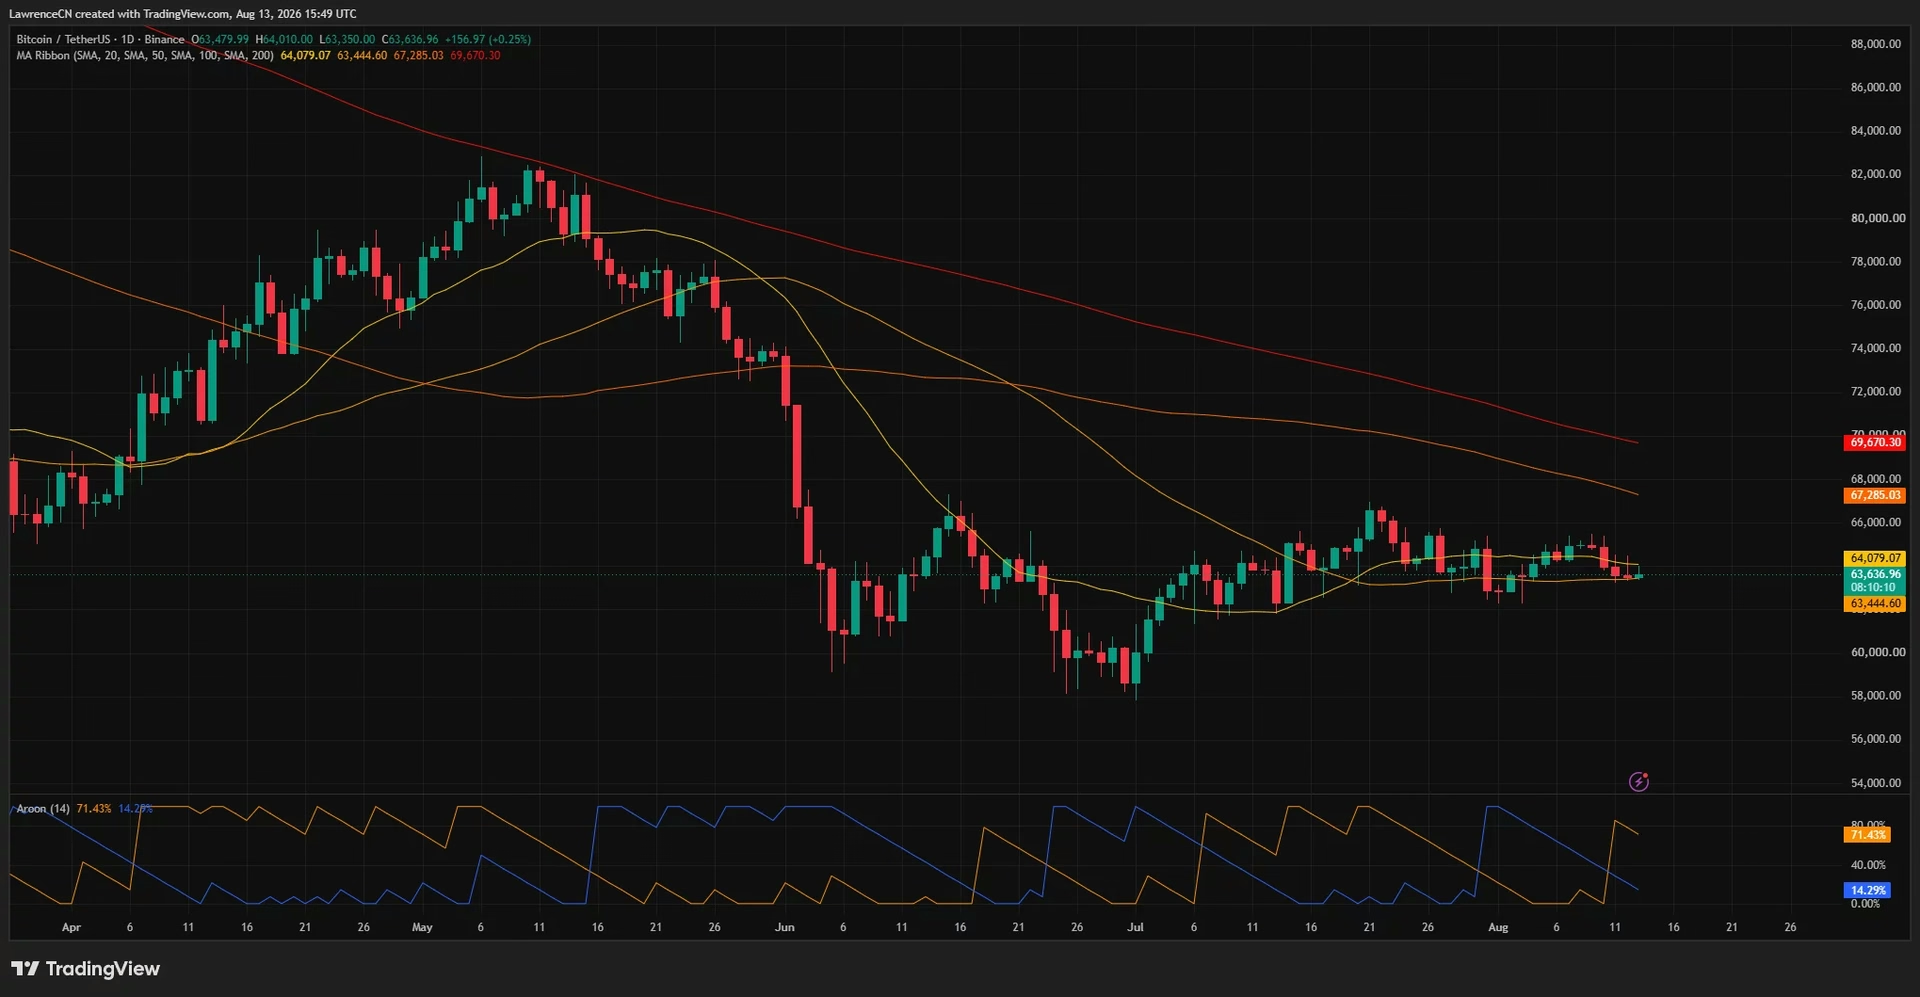
Bitcoin's technical setup has deteriorated following the CPI disappointment. 📊 On the daily timeframe, BTC trades below both the 20-day simple moving average (approximately $64,079) and significantly below the 100-day and 200-day averages near $67,285 and $69,670, respectively. The 50-day average sits near $63,445, placing Bitcoin just above a critical support zone.
Aroon indicator readings reveal concerning bearish momentum. Aroon Down stands at 71.43% compared with Aroon Up at just 14.29%, indicating that recent lows exert more influence than recent highs—a textbook bearish configuration. This suggests sellers maintain control of the narrative, at least in the short term.
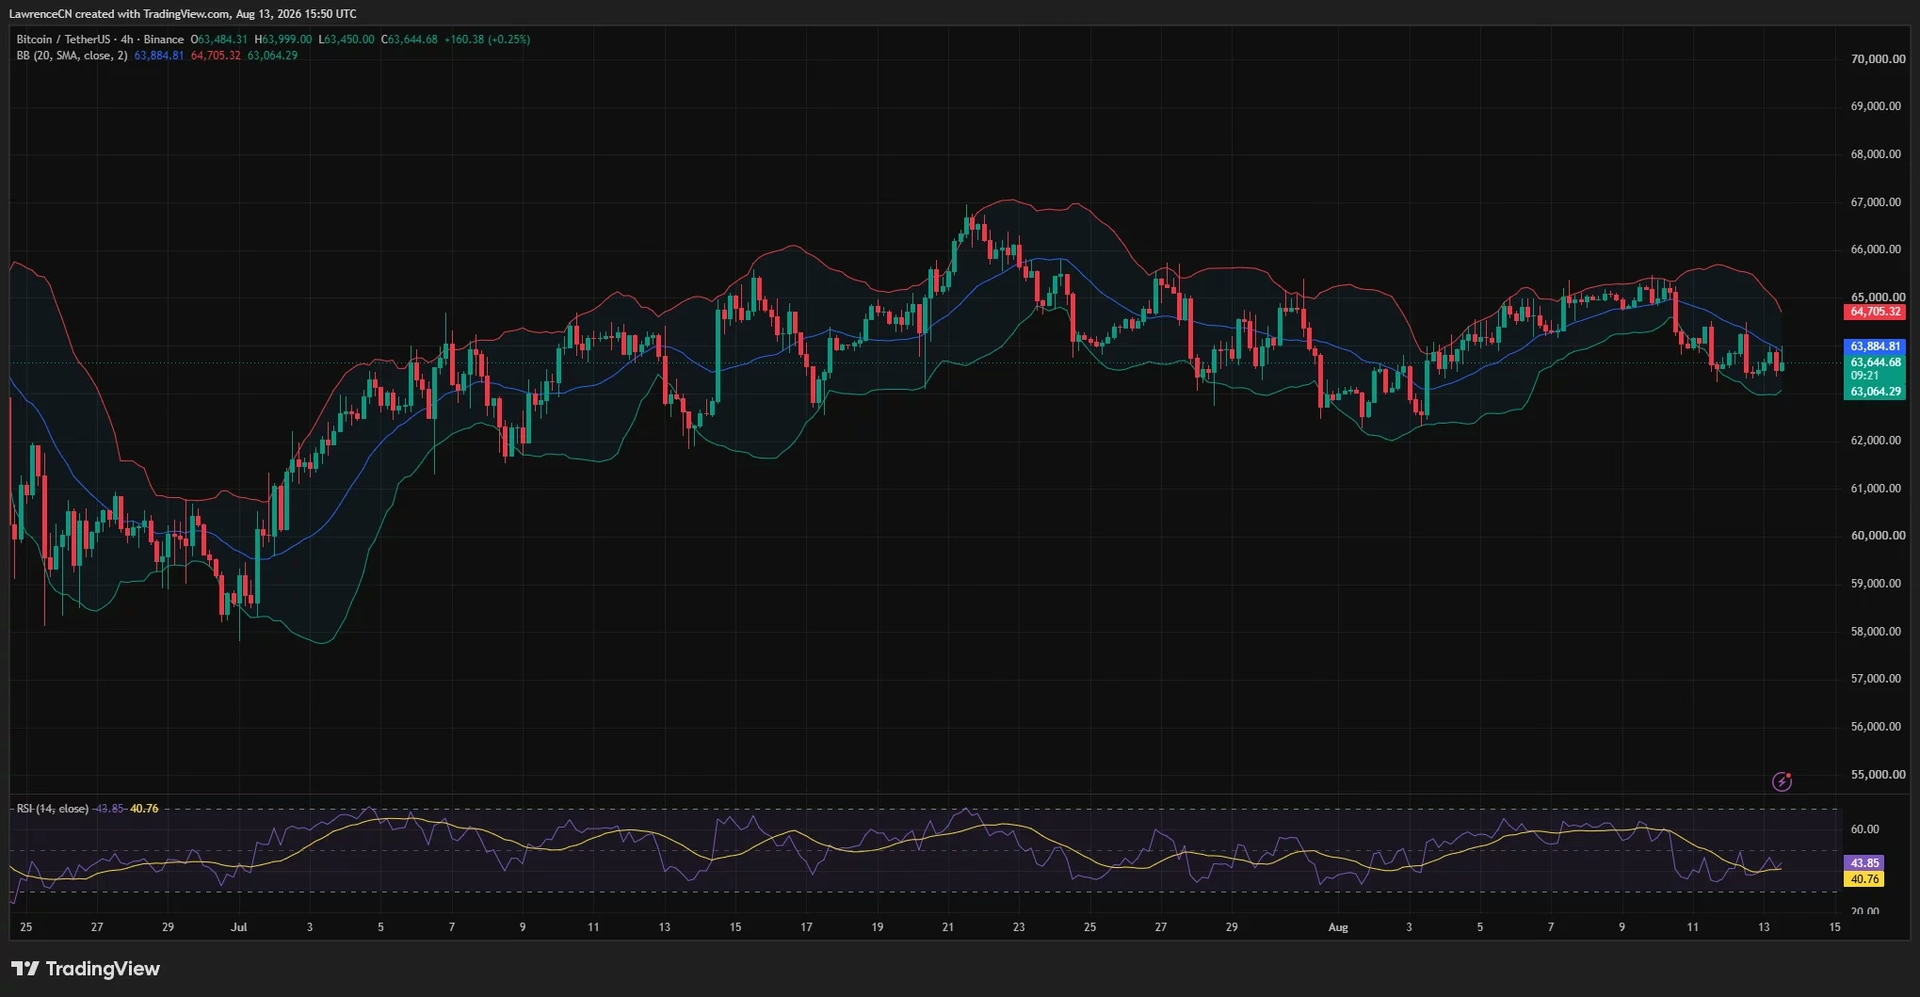
On the 4-hour chart, Bitcoin trades below the Bollinger Band midpoint at $63,885, with the lower band near $63,064 providing immediate support. The upper band around $64,705 overlaps with liquidation clusters that could influence the next directional move. The 4-hour relative strength index stands at 43.85—weak momentum that hasn't yet reached oversold territory, leaving room for additional selling pressure if support fails.
Liquidation Clusters: The Next Battleground
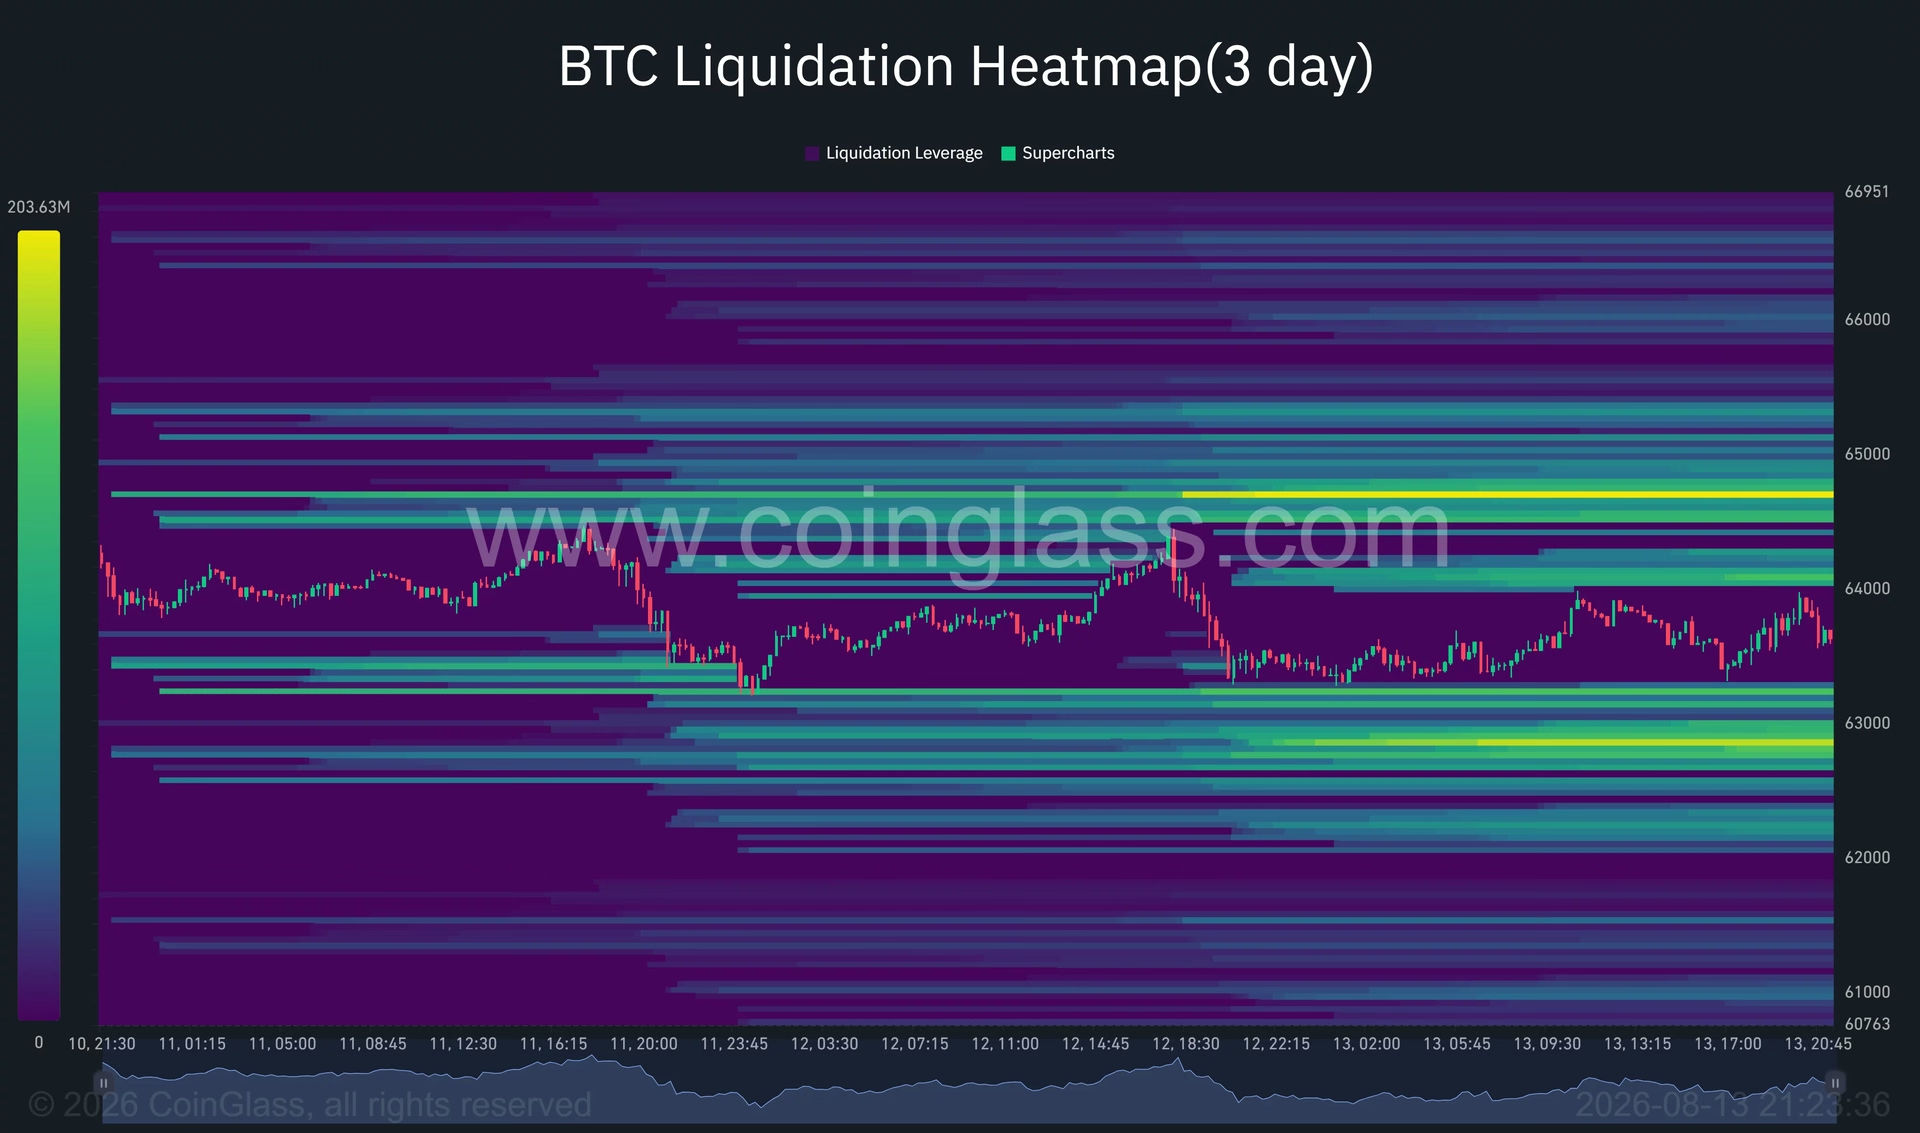
For traders attempting to predict Bitcoin's next significant move, liquidation heatmaps reveal critical price zones where algorithmic selling could accelerate. 🎯 Substantial liquidation clusters exist near $64,700 and $62,800, creating natural pressure points that could determine whether Bitcoin consolidates within its established range or breaks decisively lower.
If Bitcoin falls through the $63,000 psychological level, the psychological and technical damage could trigger cascading liquidations that accelerate the decline. Conversely, if buyers defend $62,800, the market might find stability for another consolidation period within the $62,000-$66,000 range.
What's Next: Key Catalysts Ahead
Market participants shouldn't assume current conditions will persist indefinitely. Several major catalysts lie ahead that could reshape Bitcoin's trajectory:
Near-term economic events:
- July PCE (Personal Consumption Expenditures) data release
- August CPI report
- Federal Reserve's September 15-16 policy meeting
- Continued geopolitical developments affecting oil prices and inflation expectations
It's worth noting that July inflation data largely predates the recent escalation in geopolitical tensions and oil-price volatility. Future inflation readings could reflect these developments, potentially reigniting concerns about persistent price pressures that the recent CPI report temporarily eased.
The Bigger Picture: Bitcoin's Market Maturation
Bitcoin's muted reaction to the inflation report reflects broader market maturation. 🚀 In earlier cryptocurrency market cycles, any positive macroeconomic news could spark explosive rallies. Today's response demonstrates that institutional participants have become more sophisticated in pricing information, and retail volatility has become less influential in driving directional moves.
The current consolidation phase, while frustrating for traders seeking dramatic breakouts, may actually represent healthy market development. Bitcoin price action between $62,000 and $66,000 provides institutional investors with time to accumulate positions without dramatically moving the market against themselves, while simultaneously allowing the ecosystem to develop and strengthen its infrastructure.
Key Takeaways
Bitcoin's recent price action around $63,304-$64,000 reflects a market in transition rather than one experiencing crisis:
- Expected economic data rarely drives breakouts in mature markets where participants have already priced in anticipated outcomes
- Employment weakness carries greater rate-expectation implications than inflation data that matches forecasts
- Institutional buying pressure faces persistent selling from miners and corporate holders, creating range-bound consolidation
- Technical indicators favor sellers in the near term, with critical support near $62,800 and psychological resistance around $63,000
- Future catalysts in September could provide the catalyst needed to break out of the current trading range
For Bitcoin investors and traders, patience remains essential. The cryptocurrency isn't in crisis—it's consolidating. The question isn't whether Bitcoin will eventually break higher, but whether it will establish a strong base from which to do so. The next few weeks will prove crucial in determining whether institutional accumulation can overcome persistent selling pressure and spark the next significant rally. 💪
You May Also Like

Market Analysis
XRP Price Falls 5% as Leverage Hits Seven-Month High
August 26, 2026

Market Analysis
Crypto Market Hits Extreme Greed: What This Means for Bitcoin
August 26, 2026

Market Analysis
Ethereum Price Rally Overheats Below $2,550 Resistance
August 26, 2026

Market Analysis
Hyperliquid Price Rally: HYPE Targets $97 Amid $80 Support
August 25, 2026