Category:
Market AnalysisBitcoin's Struggle Below $63K Amid Oil and CPI Concerns

Bitcoin's price has been grappling to stay above the $63,000 mark as it faces multiple headwinds from rising oil prices and looming inflation data. This dynamic landscape presents both challenges and opportunities for traders and investors alike.
Market Dynamics and Key Influencers
Bitcoin, the world's most valuable cryptocurrency, recently stalled below $63,000 after a volatile weekend that saw its price dip below $62,000. The primary catalysts for this turbulence include geopolitical tensions and economic indicators that are crucial to watch.
Geopolitical Tensions and Oil Prices
The recent announcement by former President Donald Trump regarding the re-implementation of a U.S. naval blockade on Iran has sent oil prices soaring. Brent crude has surpassed $85 per barrel, intensifying concerns about global inflation.
The Strait of Hormuz, a strategic chokepoint for global oil shipments, is at the center of these tensions. Such geopolitical dynamics are known to affect broader financial markets, including cryptocurrencies, due to increased risk aversion among investors.
Inflation and Economic Indicators
The U.S. Consumer Price Index (CPI) report, scheduled for release shortly, is another critical factor. A higher-than-expected CPI could signal stronger inflation, potentially leading to tighter monetary policy by the Federal Reserve. This scenario could increase bond yields, making Bitcoin less attractive as an inflation hedge.
Technical Analysis: Understanding Resistance and Support Levels
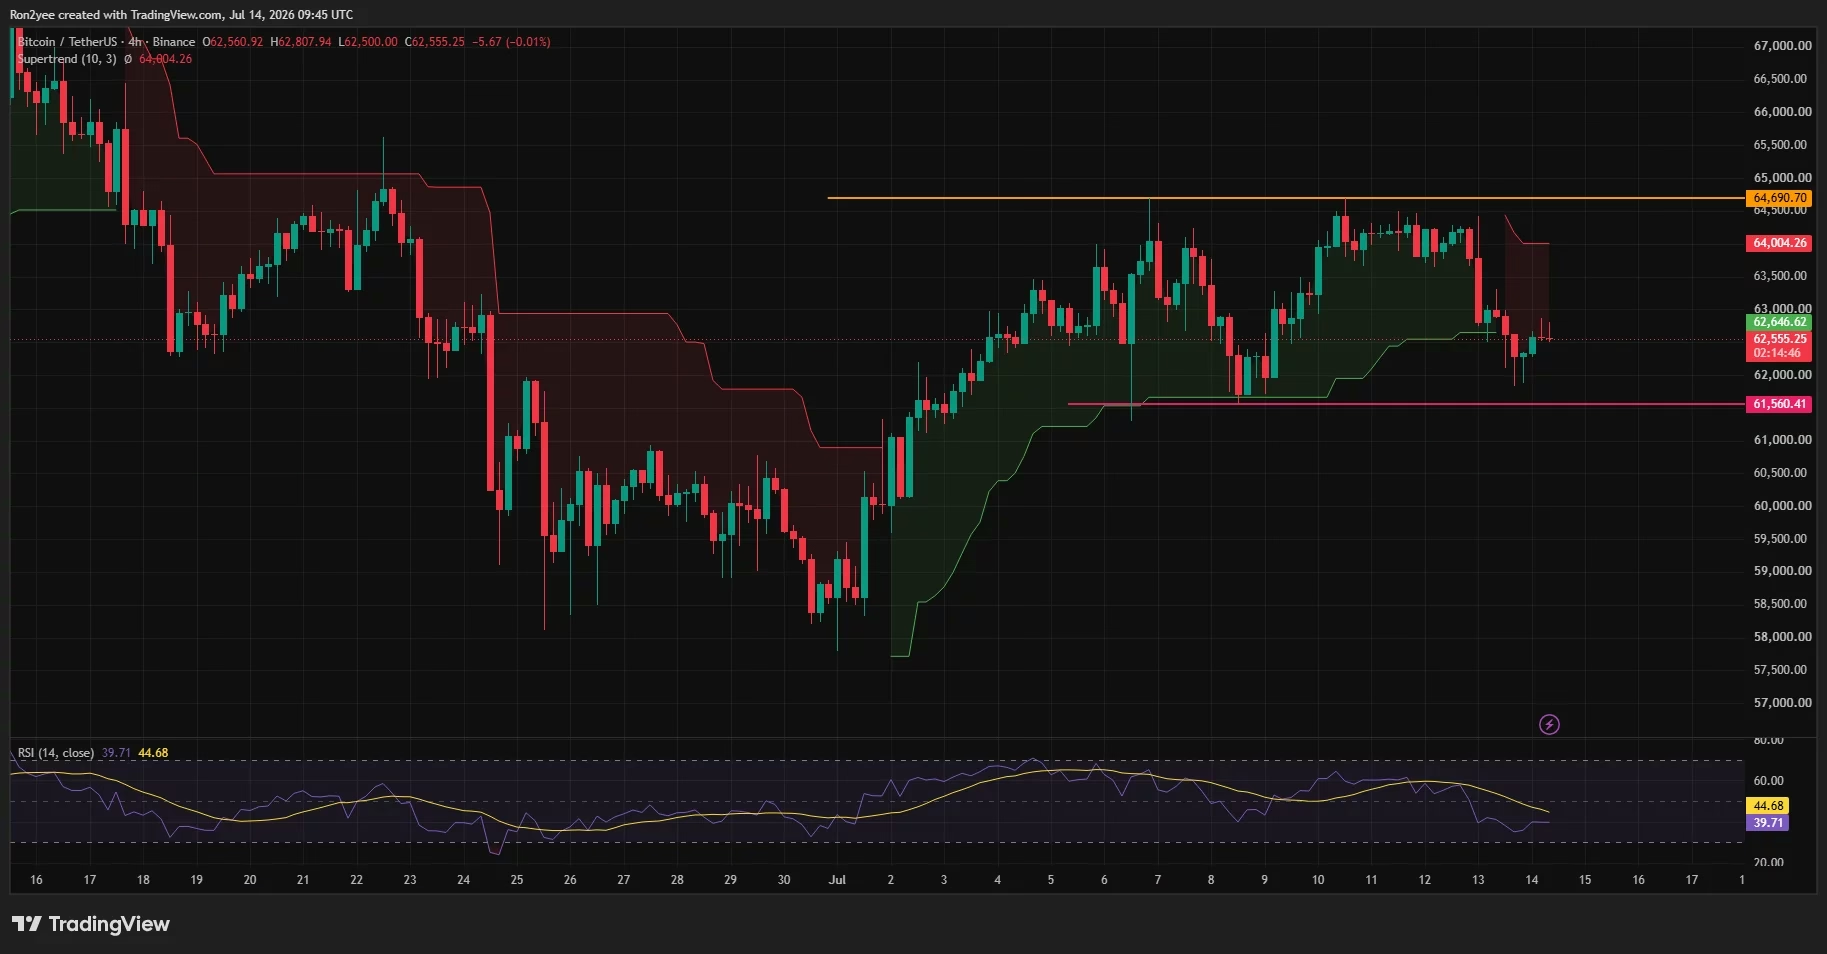
Bitcoin's technical indicators suggest a resistance range between $63,100 and $64,700. Analysts caution that a dip below $62,000 could lead to further losses, setting the stage for a challenging trading environment.
Key Resistance and Support Levels
- Resistance: $63,100 – $64,700
- Support: $61,560
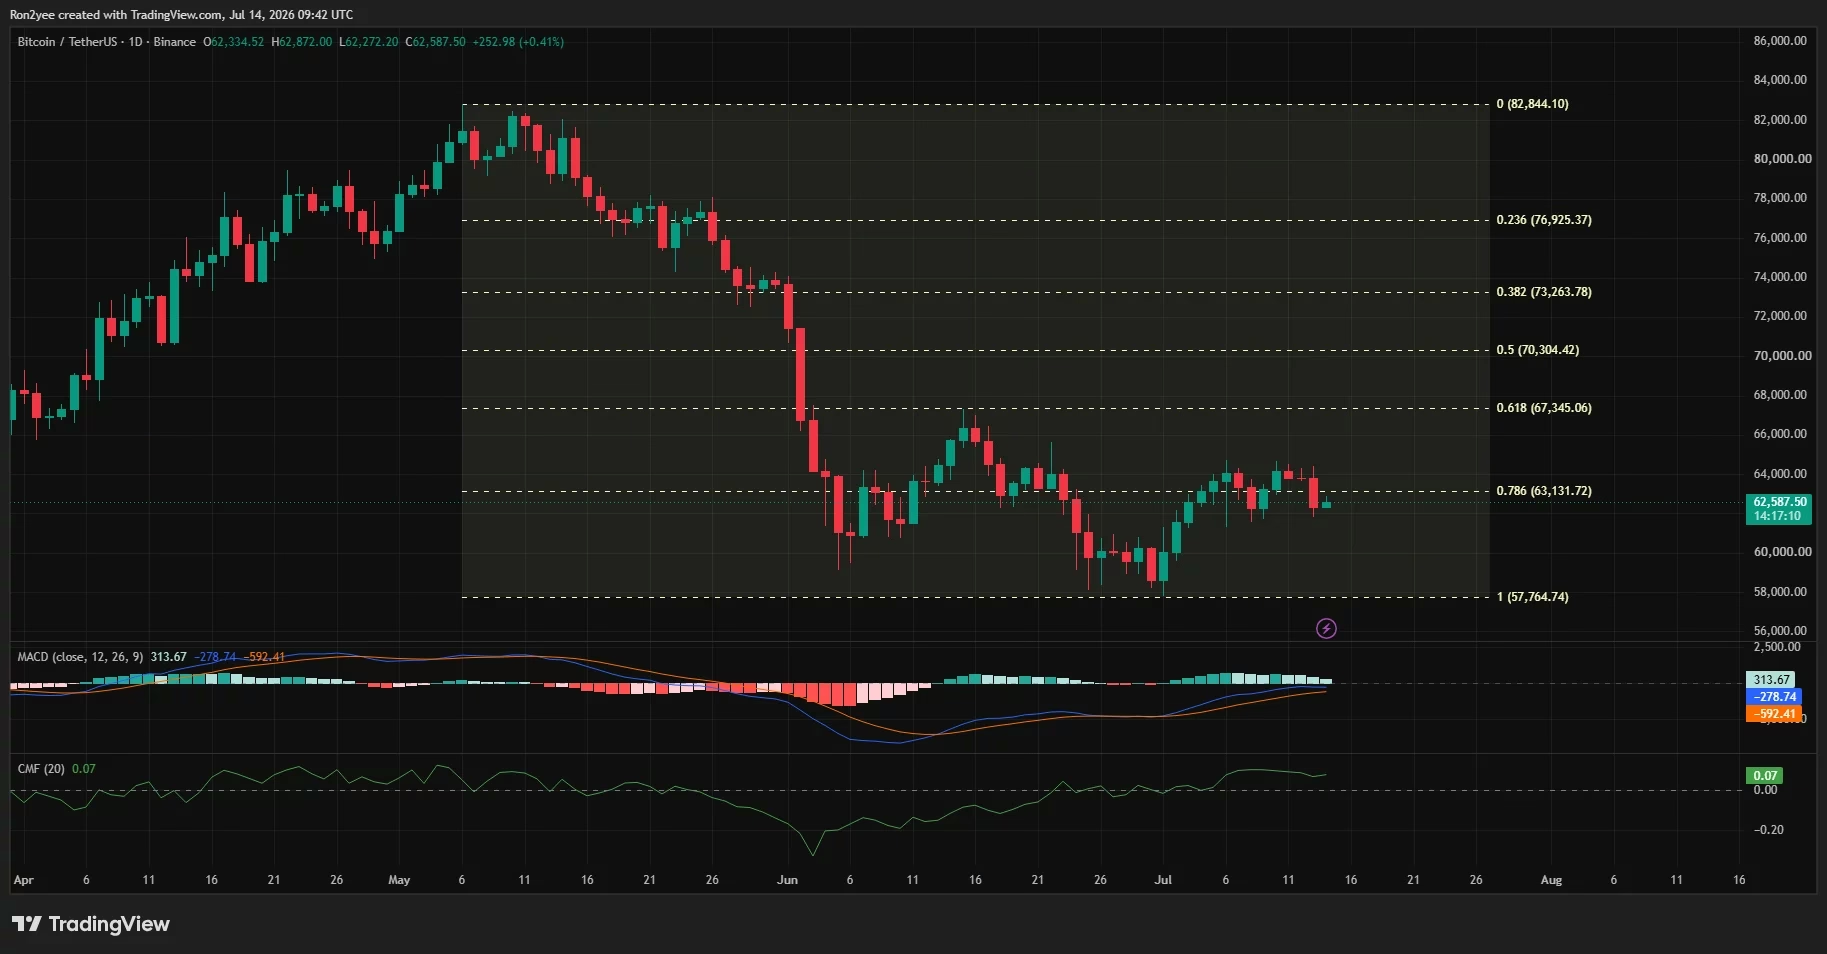
The 0.786 Fibonacci retracement from the May peak of approximately $82,844 to the June low near $57,765 marks a pivotal technical threshold. A close above this retracement could signal a bullish reversal.
Market Sentiment and Liquidity Concerns
ETF outflows have added to the bearish sentiment, with significant withdrawals recorded from major funds like BlackRock’s IBIT and Fidelity’s FBTC. This has reduced a vital source of demand for Bitcoin.
Liquidity and Leverage
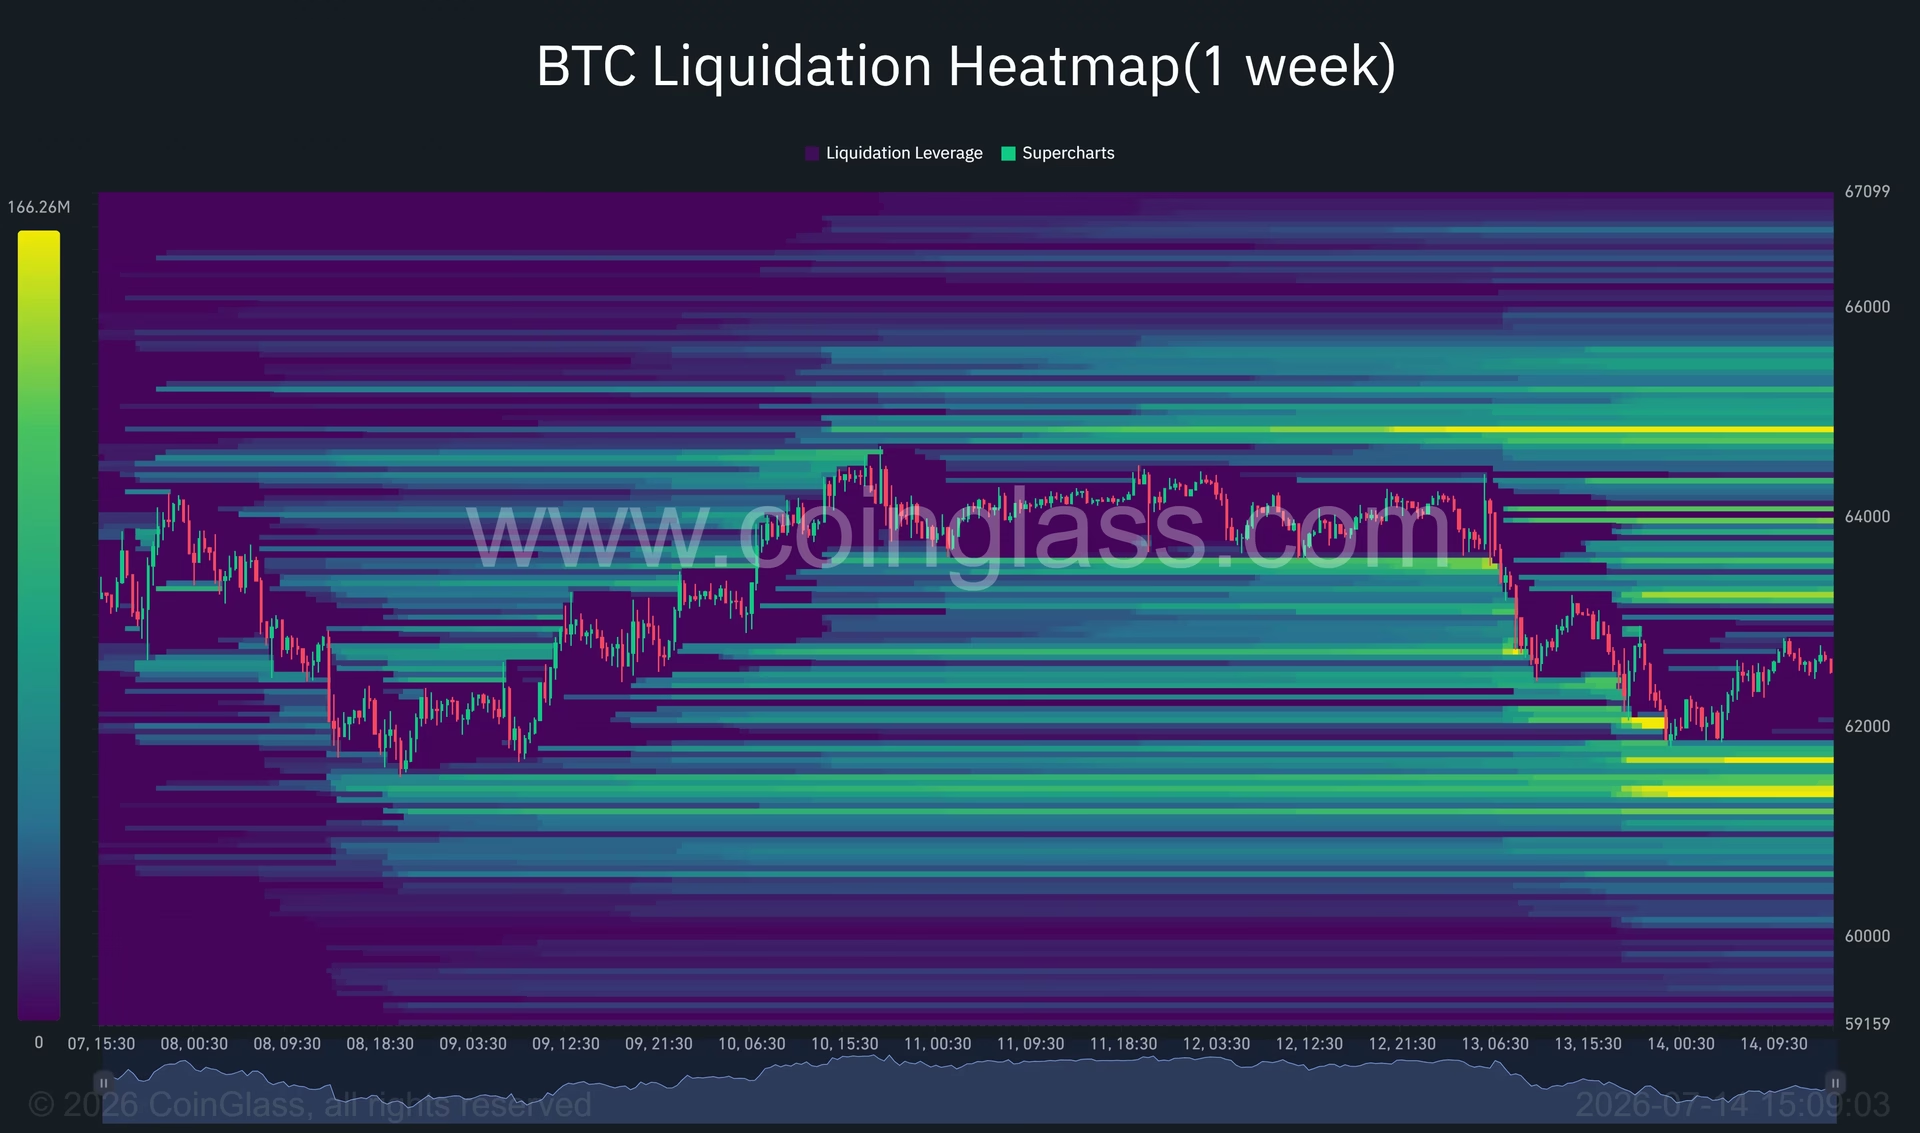
CoinGlass's one-week liquidation heatmap reveals substantial leverage positions around $61,000-$61,500, suggesting high risk of liquidation if prices fall. Similarly, clusters near $64,800-$65,000 indicate potential selling pressure.
Expert Opinions and Strategic Insights
Crypto analysts like Lennaert Snyder and Ted Pillows emphasize the importance of key levels such as $62,500 and $63,131. A breach of these levels could dictate Bitcoin's near-term trajectory. Snyder mentions, "A close below $62,000 would expose $60,400," hinting at the potential for a deeper correction.
Strategic Considerations
- Monitor CPI data and Federal Reserve remarks for market impact.
- Consider potential geopolitical developments that could affect oil prices.
- Balance risk with potential upside by tracking key resistance levels.
Conclusion: Navigating the Current Market Landscape
Bitcoin's price stall below $63,000 amid rising oil prices and inflation concerns paints a complex picture for investors. While technical and macroeconomic factors pose challenges, they also present opportunities for strategic positioning. Market participants must stay vigilant, considering both short-term volatility and long-term trends in their investment strategies.
You May Also Like

Market Analysis
XRP Price Falls 5% as Leverage Hits Seven-Month High
August 26, 2026

Market Analysis
Crypto Market Hits Extreme Greed: What This Means for Bitcoin
August 26, 2026

Market Analysis
Ethereum Price Rally Overheats Below $2,550 Resistance
August 26, 2026

Market Analysis
Hyperliquid Price Rally: HYPE Targets $97 Amid $80 Support
August 25, 2026