Category:
Market AnalysisCardano Price Surges 22% as Whale Accumulation Reaches 240M ADA

The cryptocurrency market witnessed a compelling rally in Cardano (ADA) as institutional investors and large holders demonstrated significant confidence in the asset's near-term prospects. 🚀 This surge reflects broader patterns of whale activity that often precede substantial price movements in the digital asset space.
Cardano's Impressive 22% Recovery Rally 📈
Cardano experienced a remarkable recovery from its July lows, climbing approximately 22% as the token touched an intraday high of $0.190 before experiencing some profit-taking pressure. The asset traded near $0.186 on August 3, maintaining most of its gains from the July 8 floor positioned around $0.154.
This recovery demonstrates resilience in a market that had previously struggled with consolidation patterns. The price action pushed ADA decisively above the Bollinger Bands' 20-day moving average at $0.1688, a technical level that had consistently capped recovery attempts throughout July. Breaking above this resistance point signals a potential shift in market sentiment and buying pressure.
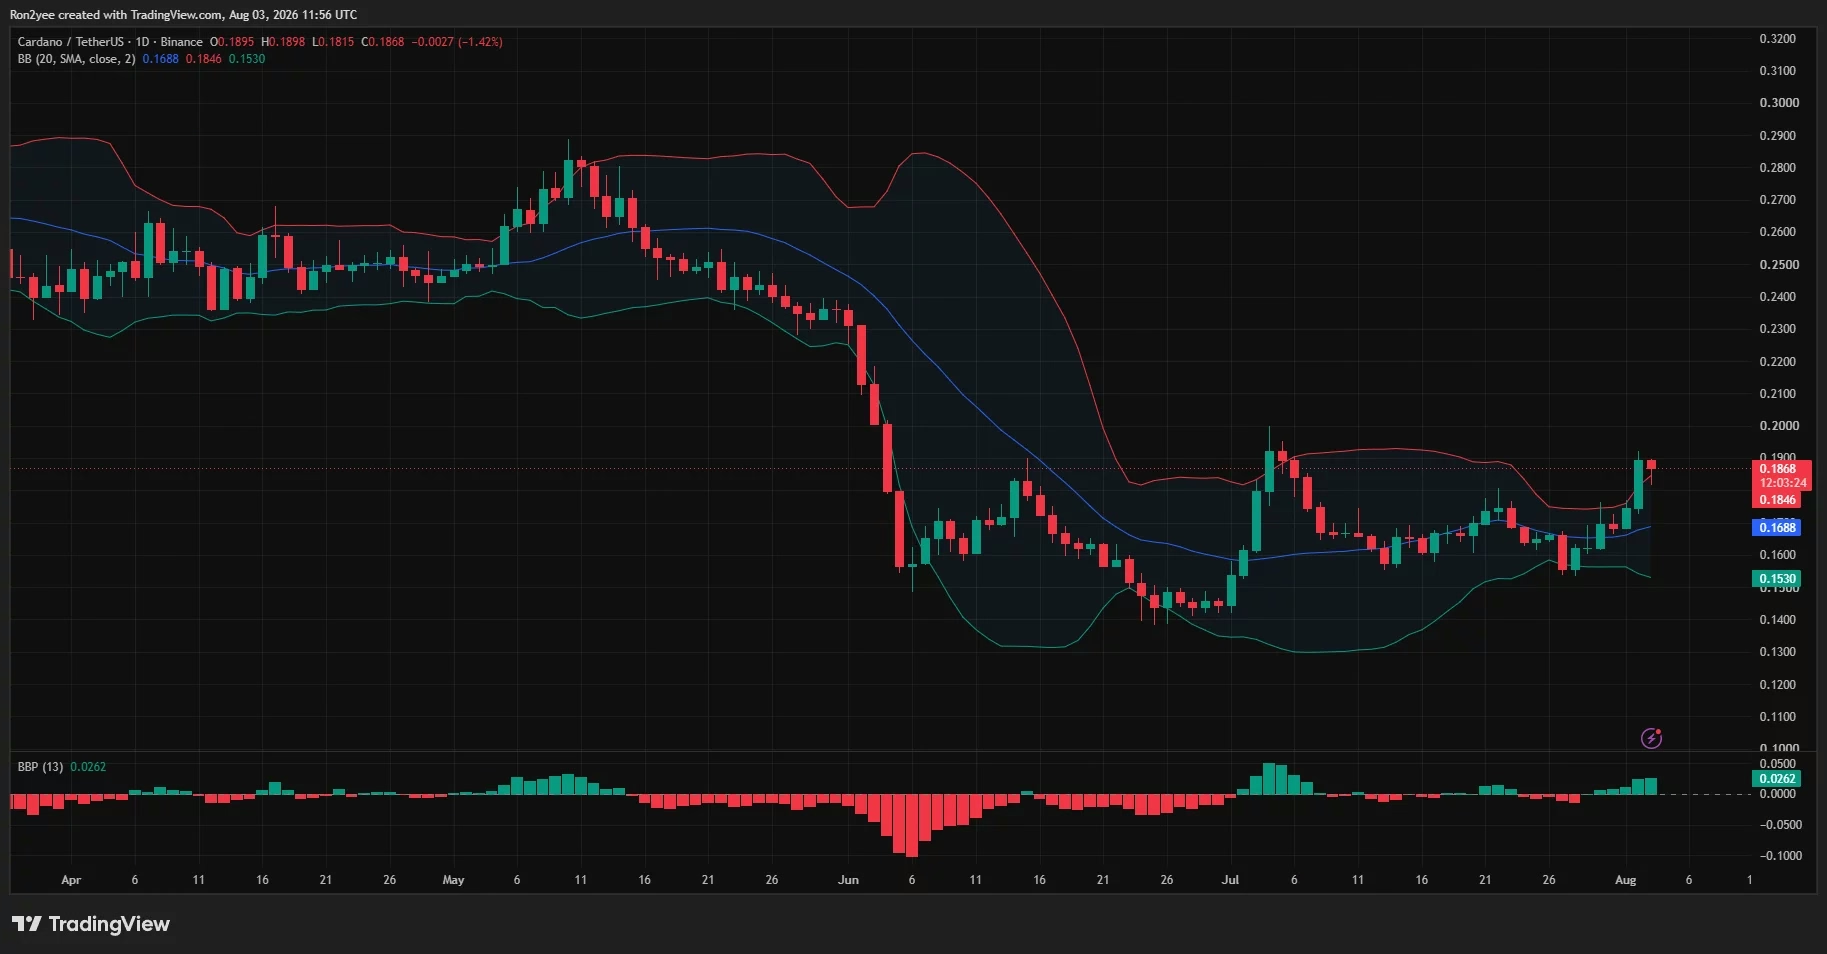
The token briefly ventured into overbought territory by trading above the upper Bollinger Band near $0.1846, indicating strong momentum had entered the market. While trading outside the bands traditionally suggests stretched conditions, it simultaneously confirms that buyers have overwhelming control of price direction.
The Whale Accumulation Story Behind the Rally 🐋
Large holders emerged as the primary catalysts driving Cardano's impressive advance. On-chain analysis from Santiment revealed that whale investors accumulated more than 240 million ADA tokens over a five-day period—a substantial position that underscores institutional confidence in the asset's fundamentals.
These major stakeholders increased their collective holdings from approximately 14.1 billion ADA to over 14.3 billion ADA during the accumulation window. The timing of this whale activity directly coincided with the 22% price appreciation, suggesting that sophisticated investors strategically absorbed available supply while prices remained relatively attractive.
This pattern of whale accumulation often precedes sustained rallies because large holders typically conduct extensive research before committing significant capital. Their confidence in Cardano's prospects may signal that they anticipate positive developments or recognize undervaluation relative to fundamental metrics.
Technical Catalysts Supporting the Upside 🔧
Beyond whale activity, several technical and fundamental factors combined to create favorable conditions for Cardano's recovery. The network underwent a significant protocol upgrade on July 18, marking an important milestone in its development roadmap. This upgrade positioned Cardano for its next evolution phase, with particular emphasis on scaling solutions including the anticipated Ouroboros Leios implementation.
These technological enhancements carry meaningful implications for the ecosystem's long-term viability and transaction throughput capacity. Markets typically respond positively to tangible progress on development timelines, especially when upgrades address known limitations.
Additionally, Cardano approached a six-month milestone in CME futures trading by August 9—a threshold that could influence future regulatory considerations. The establishment of a robust futures market demonstrates institutional interest and creates infrastructure that regulators often view favorably when evaluating spot exchange-traded fund applications. While futures market maturity doesn't guarantee ETF approval, it strengthens the argument for regulated investment products among US-based investors.
Inverse Head-and-Shoulders Pattern Targets $0.208 🎯
The technical picture reveals a compelling bullish formation that technical analysts identified on the 4-hour timeframe. An inverse head-and-shoulders pattern emerged between July 10 and August 2, featuring two rounded shoulders near $0.160 and a deeper head positioned around $0.154.
ADA successfully broke above the pattern's neckline at $0.1808 on August 2, validating the bullish structure. The measured distance between the head and neckline spans approximately $0.0274, which when added to the breakout point produces an upside target near $0.2083—roughly 12% above the current trading level.
For this target to materialize, ADA must establish a sustained 4-hour close above $0.190, effectively converting resistance into support. The Chaikin Money Flow indicator at 0.16 suggests that buying pressure continues to outweigh selling pressure despite recent pullbacks, providing encouragement for bulls.
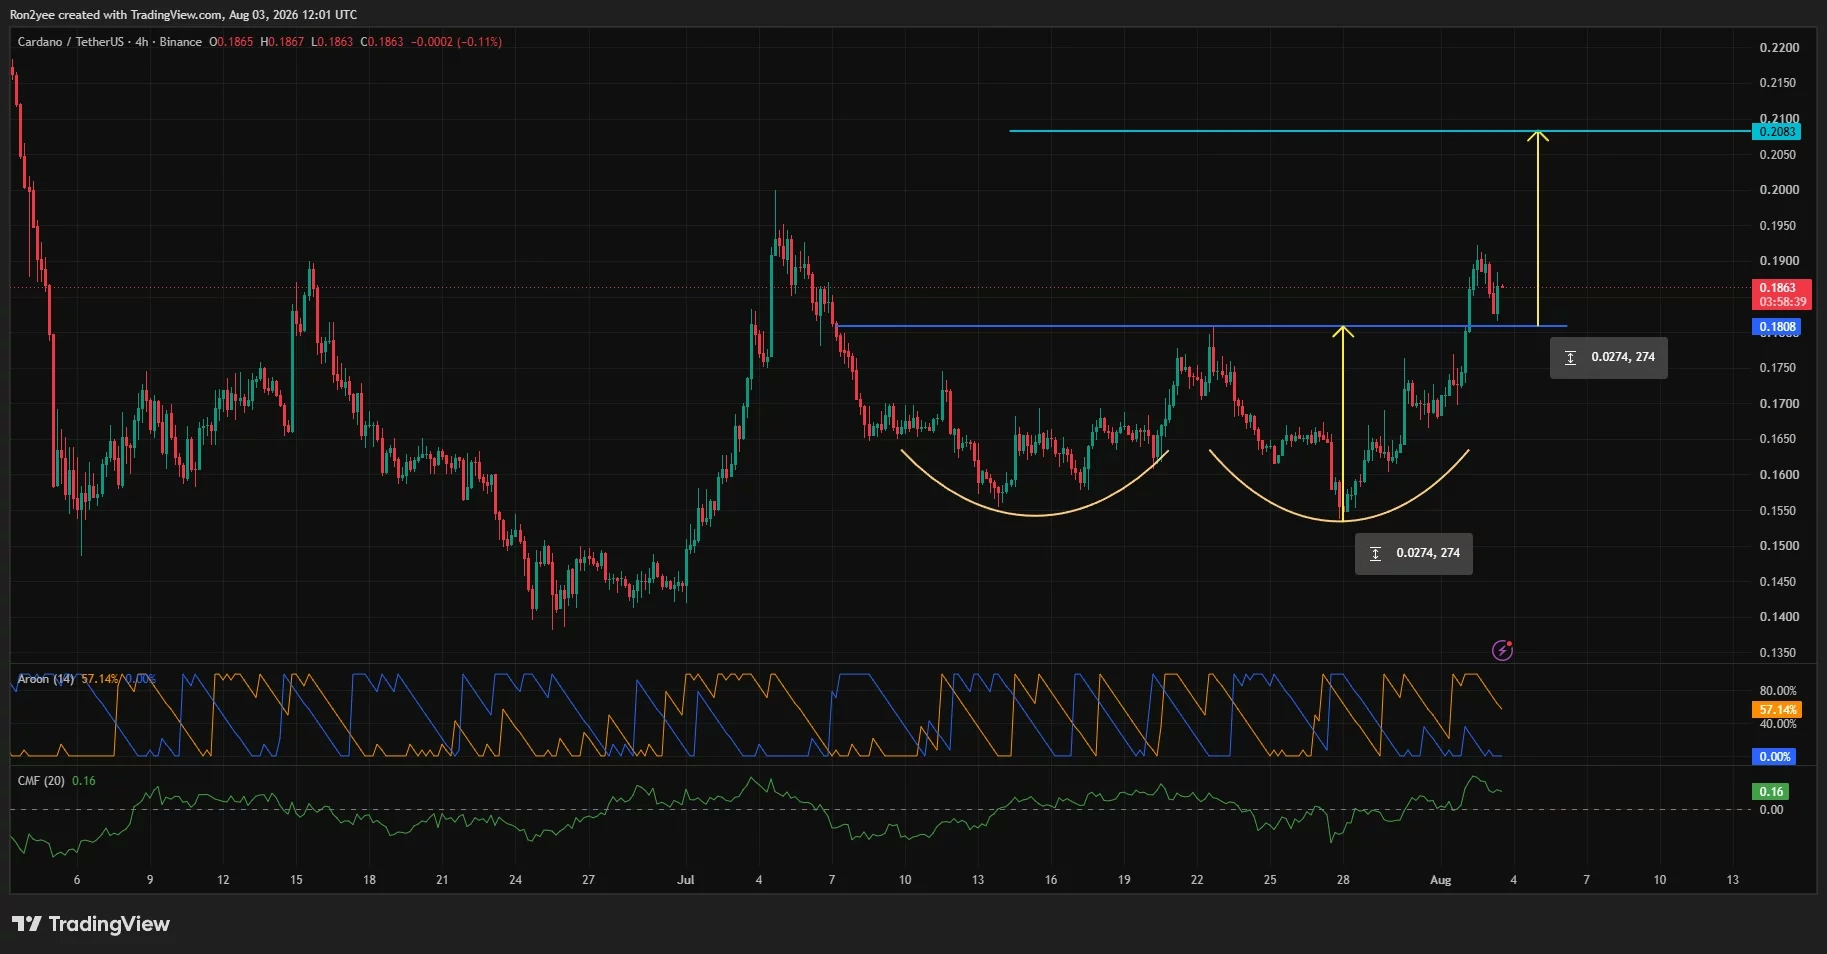
However, the Aroon indicator presents a more cautious perspective on near-term momentum. Aroon Down stood at 57.14% while Aroon Up had fallen to zero, suggesting that the immediate upward momentum from the breakout may be cooling. This divergence warrants attention, as it could indicate that the current rally phase is entering consolidation before the next leg higher.
Analysts also identified a similar inverse head-and-shoulders formation on the daily timeframe, accompanied by a bullish RSI divergence. This multi-timeframe confirmation strengthens the case for further upside, though it positions the immediate resistance zone between $0.190 and $0.195.
Liquidation Levels as Price Magnets 💥
Understanding leveraged liquidation clusters proves essential for anticipating potential price movements in the current environment. The 3-day liquidation heatmap reveals dense concentrations of leveraged positions on both sides of the current price, creating conditions for heightened volatility.
Downside liquidity clusters near $0.181–$0.183, positioned close to the inverse head-and-shoulders neckline. Should ADA decline into this zone, long liquidations could trigger cascading selling pressure before buyers mount another defensive effort. Conversely, substantial liquidation pools sit above current levels between $0.193 and $0.195.
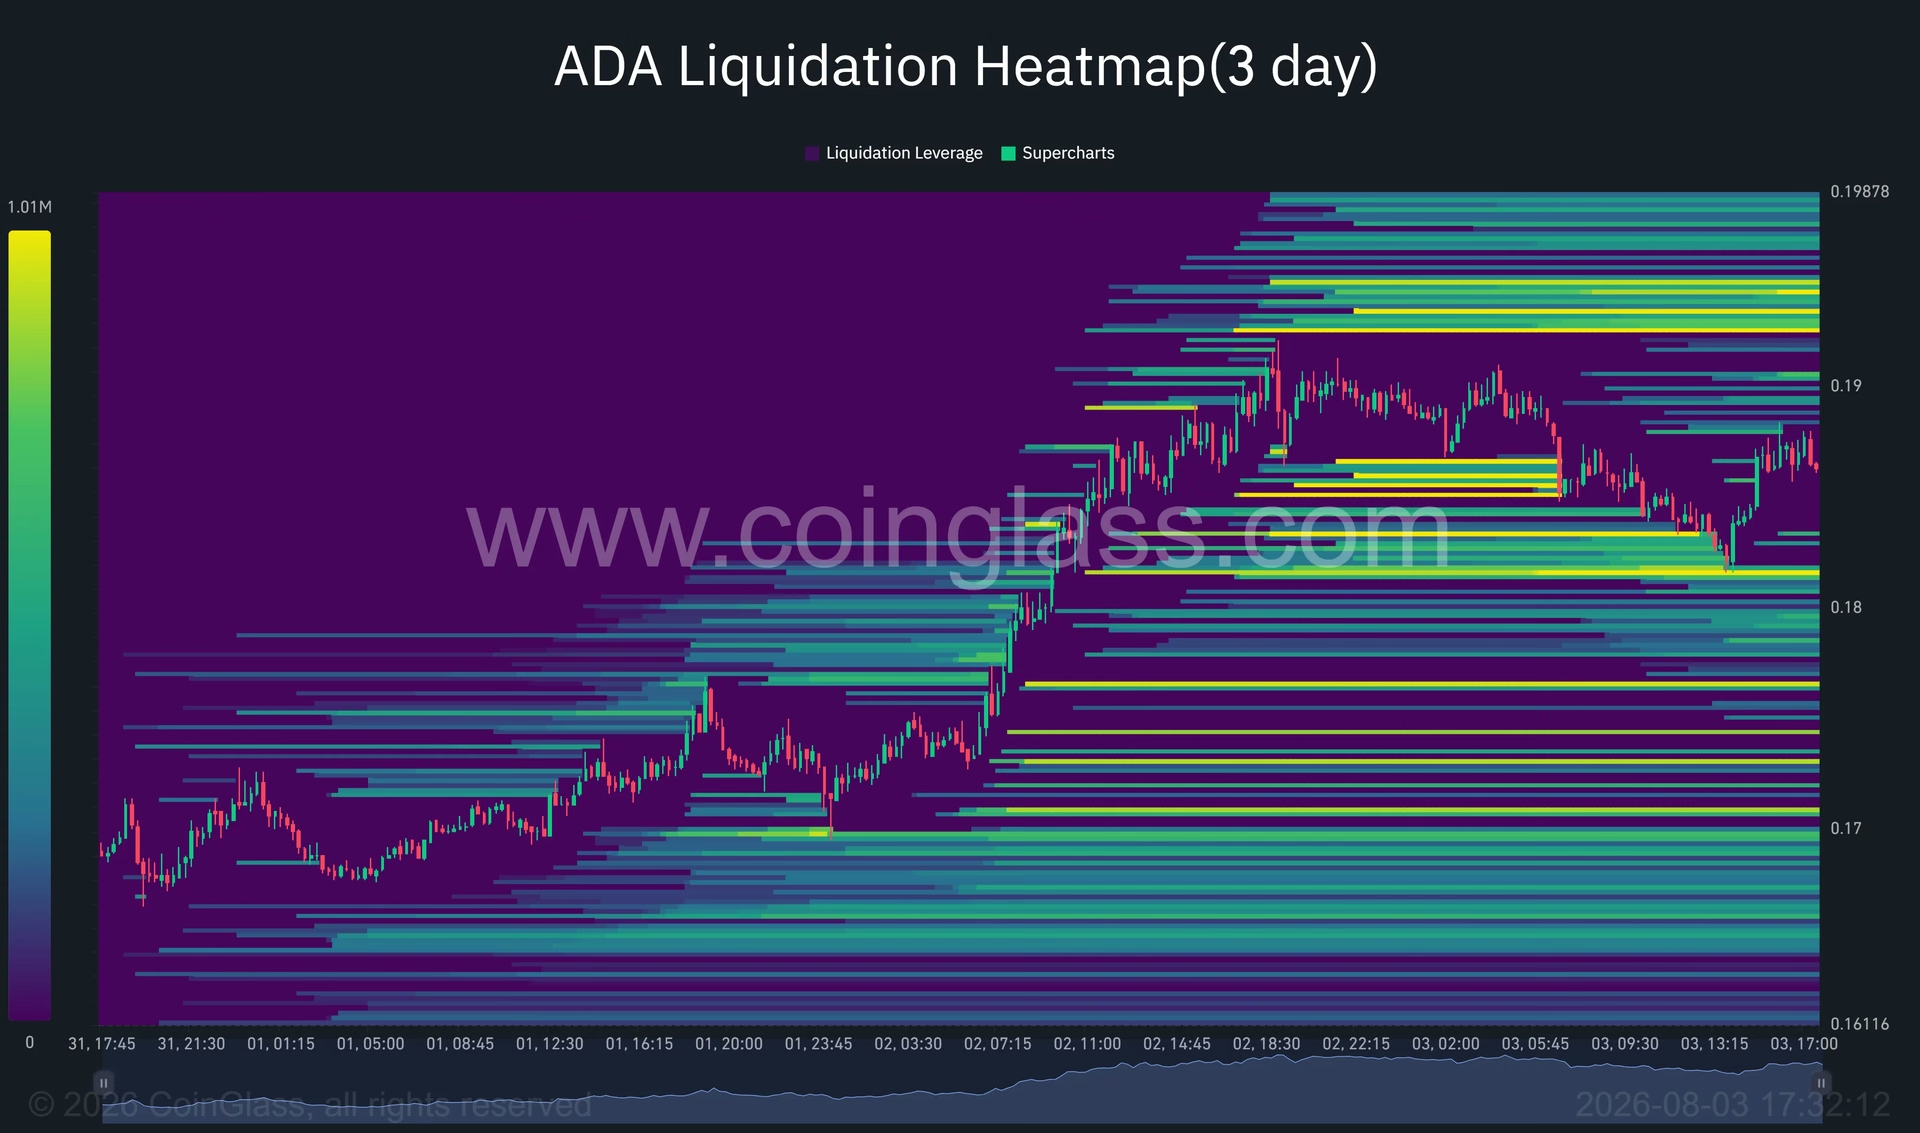
These upper-level liquidation clusters could attract price if ADA successfully retakes and holds $0.190, but they simultaneously represent resistance where short positions may be closed and traders harvest profits. Additional overhead liquidity extends toward $0.198, while lower clusters appear near $0.176 and $0.170.
This broad leveraged range suggests that sharp moves could materialize once price breaks decisively through key liquidation zones. Traders should monitor these levels carefully, as they often determine whether rallies extend or reverse.
Bullish Scenario vs. Downside Risks ⚖️
For the optimistic case to unfold, ADA must accomplish several technical milestones. The asset needs to remain decisively above the $0.1808 neckline while closing decisively above $0.195 on the 4-hour timeframe. Achievement of these targets would open a clear path toward the measured move target at $0.2083, representing substantial upside from current levels.
Conversely, a close below $0.1808 would signal that the breakout is losing strength and conviction. In such a scenario, the 20-day moving average at $0.1688 becomes the primary support level, followed by the lower Bollinger Band near $0.153. A breakdown below these levels would invalidate the bullish technical setup and potentially expose Cardano to deeper corrections.
Volatility Expansion Signals Market Conviction 📊
Bollinger Bandwidth expanded to 0.0262, confirming that volatility has returned after several weeks of consolidation. While this expansion supports the breakout thesis, it simultaneously raises the risk of larger intraday reversals. Markets transitioning from low-volatility environments to high-volatility regimes often experience whipsaw movements that shake out traders on both sides.
This volatility expansion, however, typically accompanies genuine trend changes rather than false breakouts. The combination of whale accumulation, technical pattern completion, and volatility expansion creates a compelling case for directional conviction.
What's Next for Cardano? 🔮
The coming weeks will prove critical for determining whether Cardano can sustain its recovery or faces renewed selling pressure. Key events to monitor include the CME futures six-month milestone, any announcements regarding ETF applications, and further developments on the Ouroboros Leios scaling roadmap.
Market participants should watch for potential regulatory clarity, as US approval for spot ADA ETFs would dramatically expand institutional accessibility and likely drive sustained demand. Meanwhile, continued whale accumulation would reinforce the bullish narrative, while significant selling from large holders could signal that insiders are taking profits.
The technical setup remains constructive, but execution matters. ADA must prove that it can hold above support levels and convert resistance zones into support. Traders employing risk management strategies should respect the liquidation levels identified on the heatmap, as these zones often determine whether moves extend or reverse.
Key Takeaways 🎁
The Cardano price surge reflects genuine market strength driven by multiple converging factors:
- Whale confidence: 240 million ADA accumulation signals that sophisticated investors see value at current levels
- Technical validation: Inverse head-and-shoulders pattern on multiple timeframes targets $0.2083
- Fundamental catalysts: Recent protocol upgrades and CME futures milestone support longer-term bullish narratives
- Risk management: Dense liquidation clusters require careful attention to determine breakout sustainability
- Volatility expansion: Increased bandwidth confirms trend change but also raises reversal risk
Cardano's 22% recovery demonstrates that patient accumulation during consolidation periods can reward investors who maintain conviction in an asset's fundamentals. Whether this rally extends to the measured move target or faces renewed pressure will depend on whether ADA can maintain support above key technical levels while continuing to attract institutional capital. 💡
You May Also Like

Market Analysis
XRP Price Falls 5% as Leverage Hits Seven-Month High
August 26, 2026

Market Analysis
Crypto Market Hits Extreme Greed: What This Means for Bitcoin
August 26, 2026

Market Analysis
Ethereum Price Rally Overheats Below $2,550 Resistance
August 26, 2026

Market Analysis
Hyperliquid Price Rally: HYPE Targets $97 Amid $80 Support
August 25, 2026