Category:
Market AnalysisEthereum Price Risks $1,700 as Support Weakens

Ethereum is navigating treacherous technical waters as bearish pressure intensifies and critical support levels face renewed testing. 📉 The second-largest cryptocurrency has retreated from its late-July highs, leaving traders and investors grappling with increasingly difficult questions about where the next major floor might emerge.
Ethereum's Technical Breakdown: A Closer Look 🔍
Ethereum's price action has deteriorated significantly in recent trading sessions. The token declined 2.04% to approximately $1,847, marking another failed attempt to sustain momentum above key resistance zones. What makes this particularly concerning for bullish traders is the consistent pattern of rejection near important moving averages that typically serve as trend indicators.
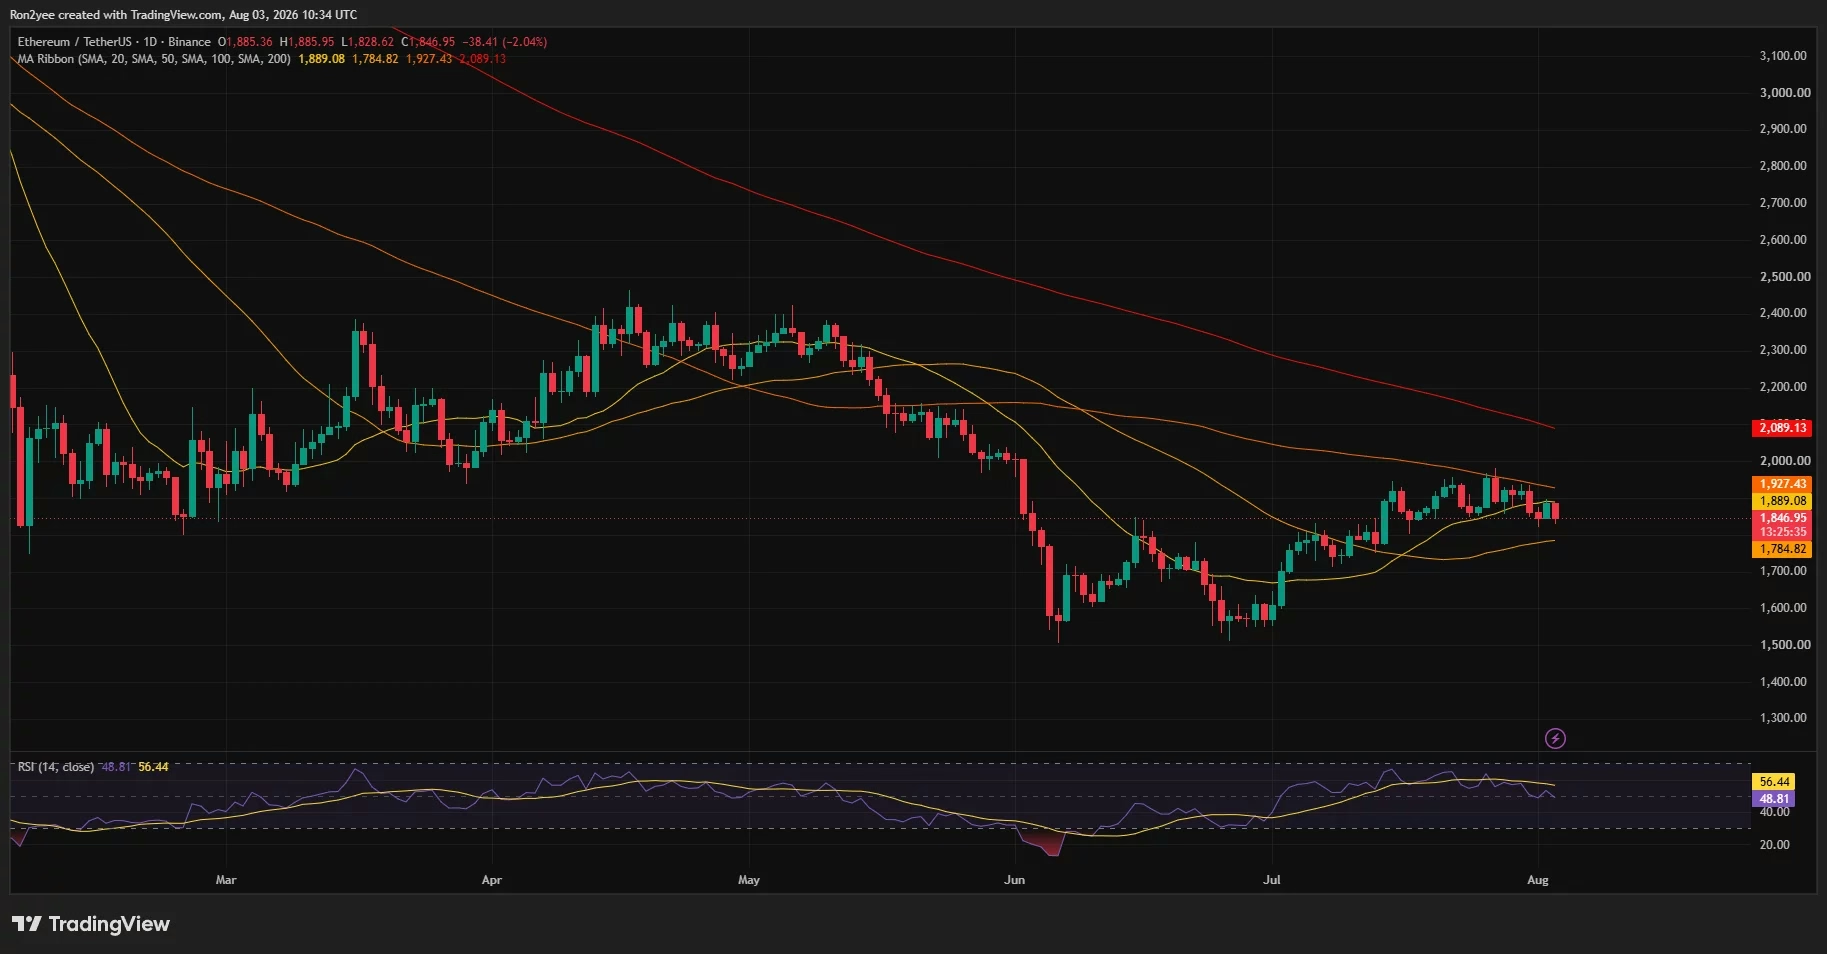
The 50-day simple moving average currently sits at $1,889, while the 100-day SMA stands at $1,927. Ethereum's inability to close above these levels has become increasingly problematic, as these averages traditionally provide support during uptrends and resistance during downtrends. The fact that ETH trades below all three major moving averages—including the 200-day SMA at $2,089—suggests the intermediate-term trend has shifted decidedly negative.
The Critical $1,800 Support Zone ⚠️
The $1,800 to $1,850 range has emerged as the battleground for Ethereum's near-term direction. This support zone represents more than just a round number; it encompasses multiple layers of technical significance that accumulated over months of price discovery. Traders have been watching this area intensely, knowing that a breakdown could trigger cascading liquidations and accelerate selling pressure.
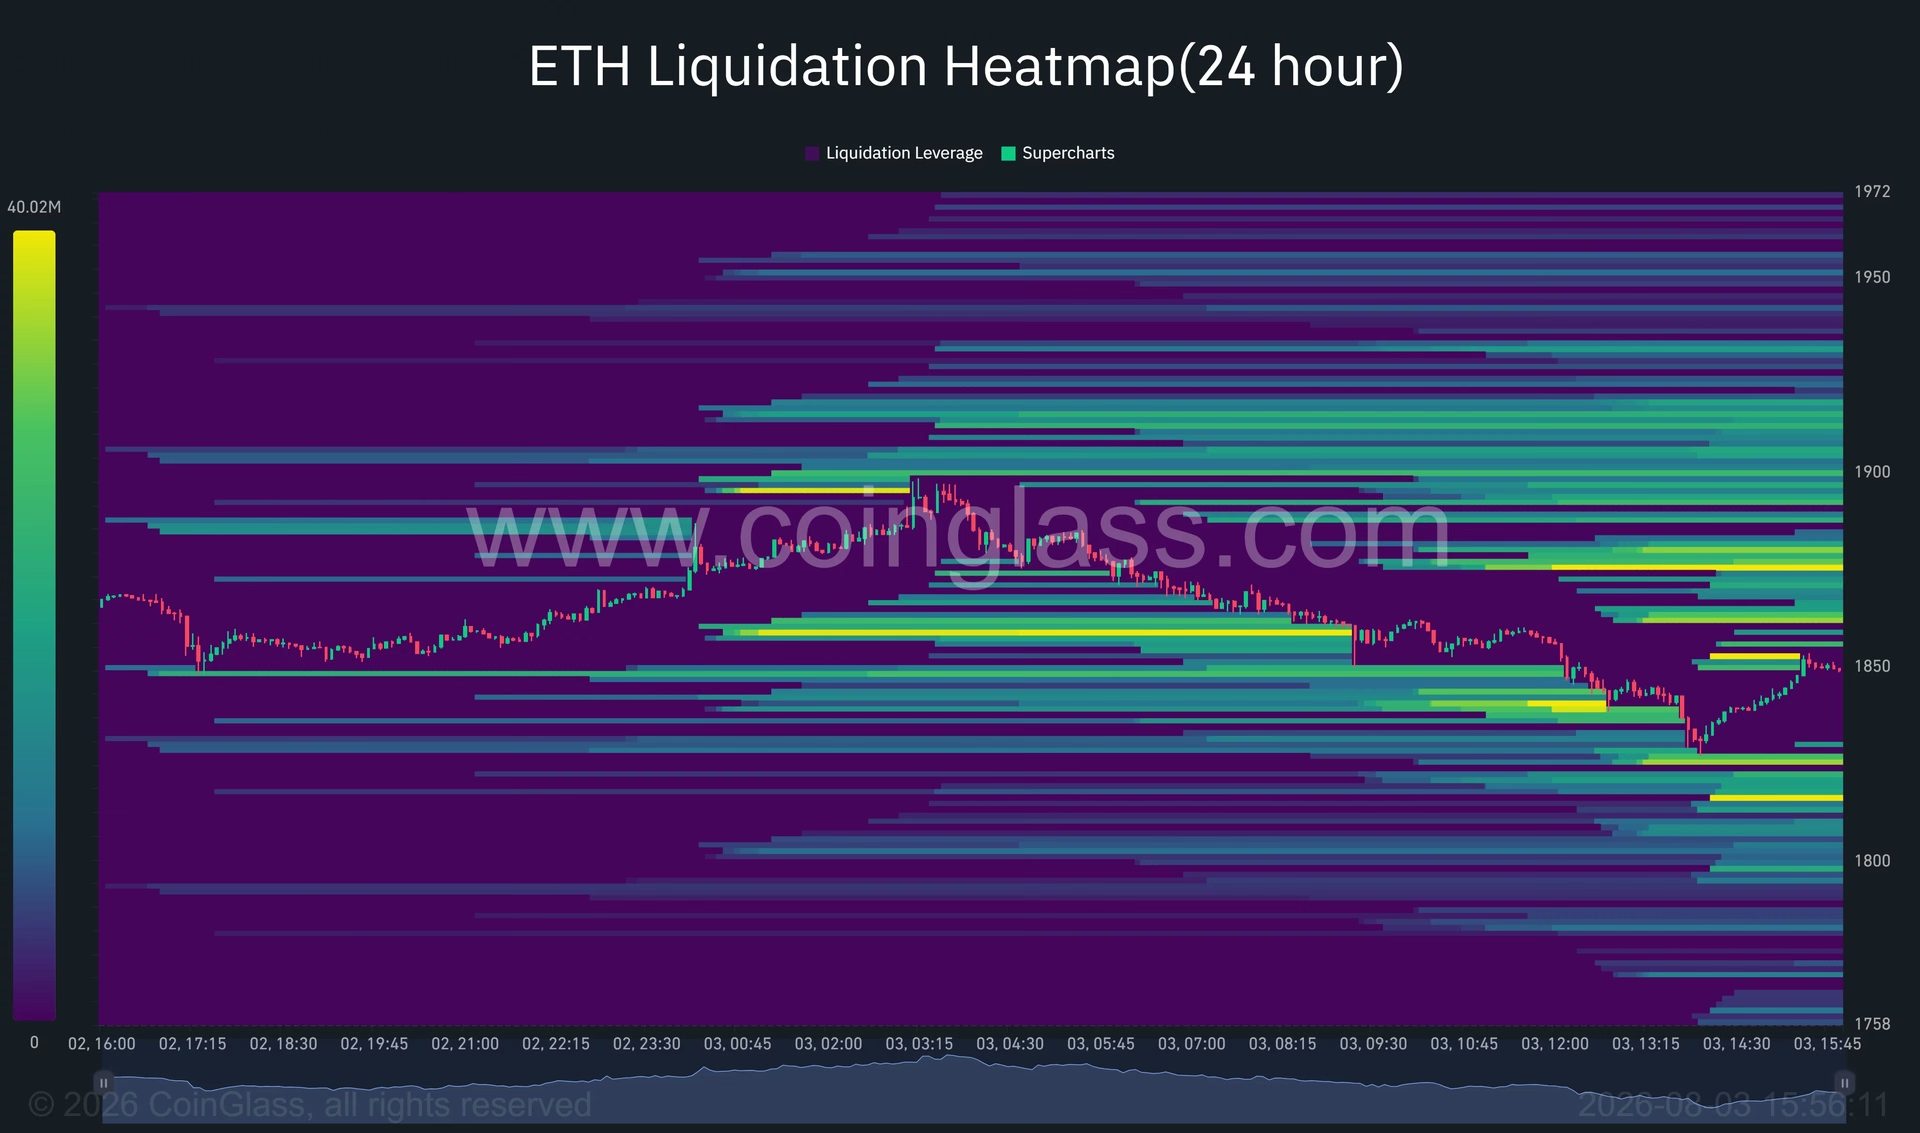
The liquidation heatmap reveals a concerning concentration of leveraged long positions clustered around $1,840, $1,820, and $1,810. This clustering creates a dangerous scenario where a swift move through these levels could trigger a cascade of forced liquidations, potentially accelerating the downward momentum. Such events, known as "cascading liquidations," have historically amplified price declines beyond what fundamental factors alone would suggest.
Momentum Indicators Flash Warning Signs 📊
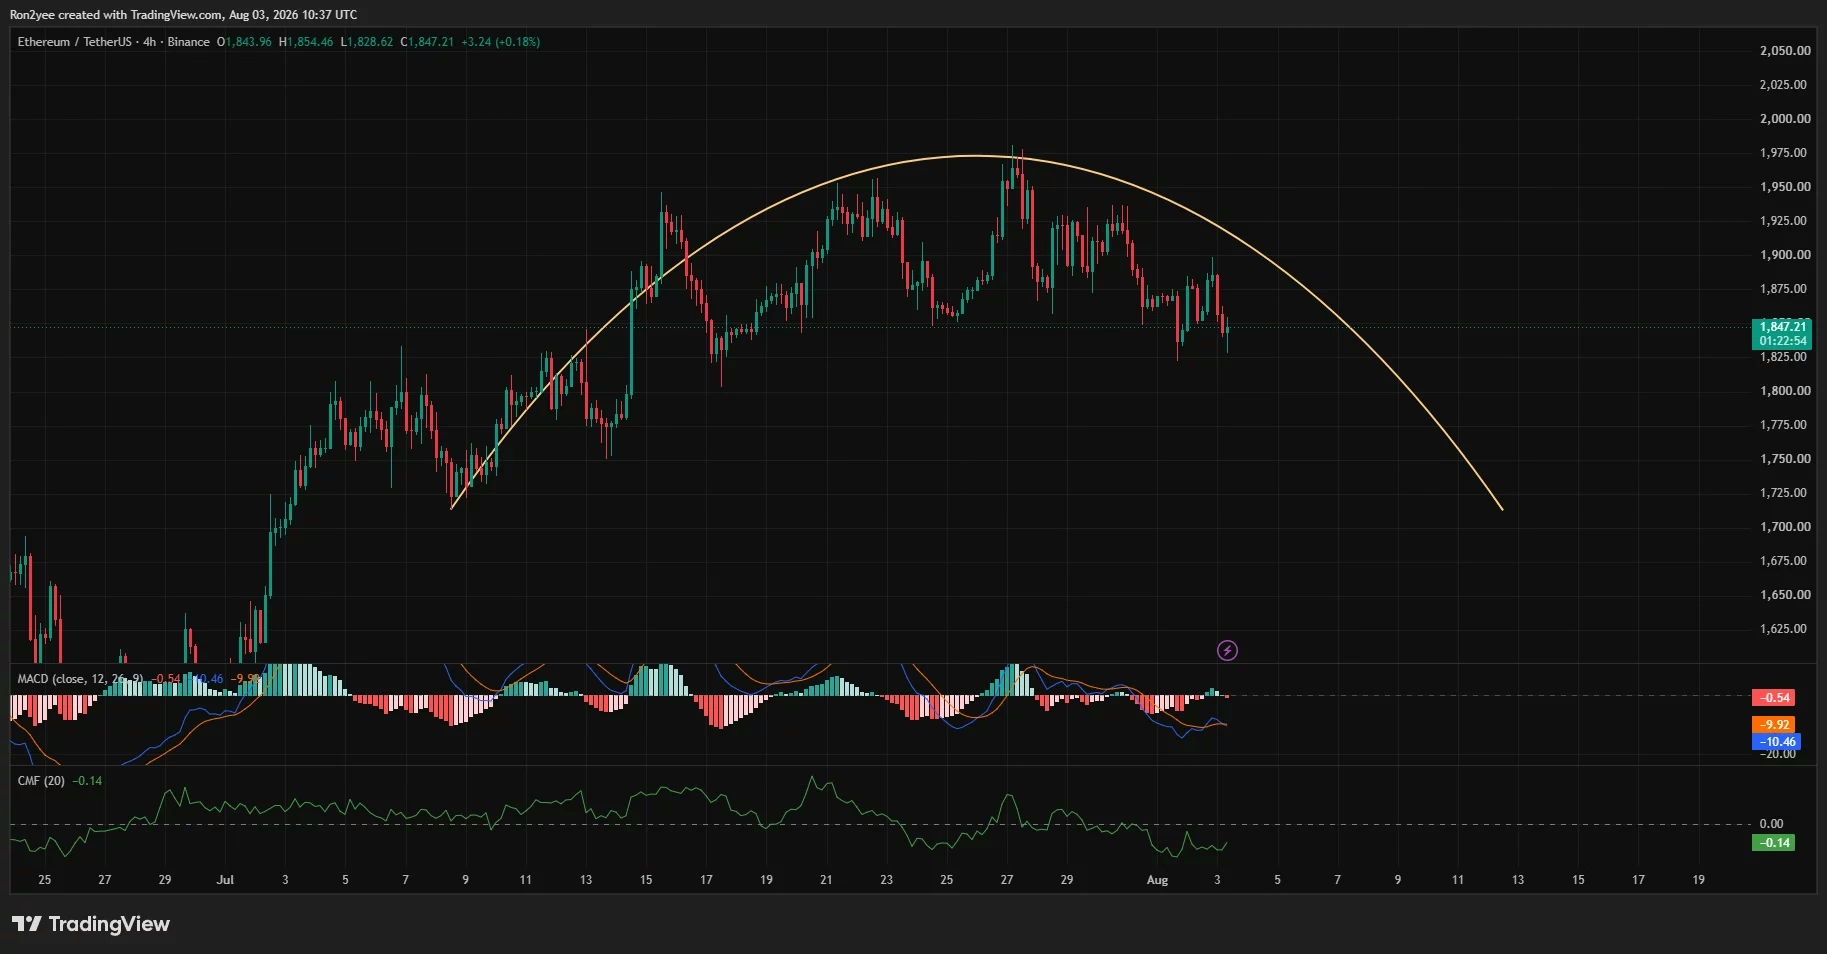
Beyond price action, the technical indicators painting a troubling picture. The 4-hour Moving Average Convergence Divergence (MACD) remains firmly in negative territory, with the MACD line near -10.46 and the signal line at approximately -9.92. This persistent negative reading indicates that bearish momentum continues to dominate shorter timeframes, even if Ethereum hasn't reached oversold conditions.
The Chaikin Money Flow indicator presents an equally concerning signal at -0.14, demonstrating that selling volume has consistently outweighed buying volume throughout the measurement period. When money flow turns negative, it suggests institutional and retail sellers are maintaining control, making it difficult for buyers to establish a foothold.
The Path Lower: Where Could ETH Head? 📍
Should Ethereum lose the $1,800 support level, the technical picture becomes considerably more bearish. The next significant support zone emerges around $1,785, where Ethereum's lower daily moving-average ribbon is positioned. A daily close below this level would substantially strengthen the bearish setup and expose the $1,700 level—a psychologically significant round number that many traders have marked on their charts.
Breaking below $1,700 would represent a particularly significant capitulation, as it would open the door to the June accumulation region spanning $1,550 to $1,600. This lower zone represents where significant buying interest emerged during previous market stress periods, suggesting it could provide eventual support—but only after considerable further downside.
Liquidity Concerns Compound the Pressure 💧
Beyond technical factors, Ethereum faces headwinds from deteriorating liquidity conditions. Data reveals a sharp weekly decline in Binance stablecoin netflows, indicating that less fresh capital is currently flowing into exchanges. This reduction in available buy-side liquidity makes it more difficult for buyers to absorb selling pressure and establish support at key levels.
While exchange flow data can be volatile and doesn't singularly determine price direction, the pattern of declining inflows combined with selling pressure creates an unfavorable environment for bullish traders. When buying interest is weak and selling pressure persists, prices tend to drift lower until they reach levels compelling enough to attract new buyers.
Structural Headwinds Beyond Charts 🏗️
The technical weakness reflects broader challenges facing Ethereum's investment narrative. Institutional demand for Ethereum products has lagged relative to Bitcoin, as evidenced by spot exchange-traded product flows favoring Bitcoin over Ethereum alternatives. Additionally, mainnet fee revenue has declined as activity increasingly migrates toward Layer-2 scaling solutions like Arbitrum and Optimism.
While these Layer-2 developments represent genuine technological progress, they reduce the direct economic benefits accruing to the Ethereum mainnet itself. This structural shift has prompted some institutional investors to reassess their Ethereum allocations, potentially contributing to the weakness in demand.
The Macro Backdrop: Fed Policy and Risk Appetite 🌍
Macroeconomic factors add another layer of complexity to Ethereum's technical challenges. Expectations surrounding Federal Reserve monetary policy remain fluid, with implications for broader risk appetite. If the Fed maintains higher interest rates for longer than markets currently price in, Treasury yields could remain elevated, making dollar-denominated assets more attractive relative to speculative investments like cryptocurrency.
A stronger US dollar environment, driven by higher yields and tighter monetary policy, historically creates headwinds for cryptocurrency prices. Ethereum, as a speculative asset with no cash flows, becomes particularly vulnerable when real interest rates rise and investors shift toward safer, yield-bearing alternatives.
Potential Recovery Scenarios 📈
While the near-term setup appears challenging, recovery scenarios do exist. Ethereum must first reclaim its 50-day SMA at $1,889 to establish any meaningful upside momentum. A daily close above the 100-day SMA at $1,927 would further improve the technical picture, signaling that the intermediate-term downtrend may be losing force.
A breakout above the $1,975 resistance zone would invalidate the current pattern of lower highs and potentially place $2,000 back in focus. However, such a move would require a meaningful shift in momentum indicators and a return of buying interest—conditions that currently appear unlikely absent a catalyst.
What Traders Should Watch 👀
The immediate focus remains on whether Ethereum can defend the $1,800 level. Key technical levels to monitor include:
- $1,850–$1,875: Overhead liquidity zone; a break above could spark short liquidations
- $1,800–$1,850: Critical support zone; loss would suggest further downside
- $1,785: Lower moving-average ribbon; daily close below would strengthen bearish setup
- $1,700: Psychological round number and major support target
- $1,550–$1,600: June accumulation region offering potential support on larger declines
The liquidation heatmap suggests that moves through $1,840, $1,820, and $1,810 could trigger accelerated selling due to leveraged position liquidations. Conversely, a rebound above $1,860–$1,875 could spark short liquidations that push prices toward $1,890 and $1,920.
The Relative Strength Index Tells a Nuanced Story 📉
The daily Relative Strength Index currently stands at 48.81, below its signal average of 56.44. This reading indicates weakening momentum but importantly remains well above oversold territory (typically 30 or below). The RSI positioning suggests that while buying interest has diminished, the market hasn't reached a point of extreme capitulation that would typically precede significant reversals.
This leaves room for further selling if support breaks, but it also means that a reversal could occur without requiring an extreme oversold condition—potentially making the $1,800 level a critical inflection point.
Expert Perspectives on the Outlook 🎯
Technical analysts have increasingly focused on the $1,800–$1,850 zone as decisive for Ethereum's next major move. The consensus suggests this support range is crucial for maintaining bullish positioning. A confirmed breakdown could accelerate selling toward $1,700, while a successful defense could allow recovery toward $1,950 and potentially $2,050.
However, such recovery scenarios require a meaningful shift in both technical conditions and macro sentiment. Until momentum indicators improve and buying volume returns, the path of least resistance remains downward.
Key Takeaways 💡
Ethereum's current technical setup presents a challenging environment for bullish traders while offering potential opportunities for those positioned for further weakness. The convergence of weak momentum, deteriorating liquidity, and structural headwinds creates a bearish bias that shouldn't be ignored.
The $1,800 support level represents a critical juncture—its loss would likely accelerate selling toward $1,700 and beyond. Conversely, a successful defense combined with a break above $1,927 could signal that buyers are regaining control. Until macro conditions improve and institutional interest returns, Ethereum traders should remain cautious about assuming support holds at any particular level.
For US investors particularly, monitoring Fed policy signals and Treasury yield movements remains essential, as these factors significantly influence risk appetite for speculative assets like Ethereum. The coming weeks will likely prove decisive in determining whether Ethereum can stabilize or if lower support levels will be tested.
You May Also Like

Market Analysis
XRP Price Falls 5% as Leverage Hits Seven-Month High
August 26, 2026

Market Analysis
Crypto Market Hits Extreme Greed: What This Means for Bitcoin
August 26, 2026

Market Analysis
Ethereum Price Rally Overheats Below $2,550 Resistance
August 26, 2026

Market Analysis
Hyperliquid Price Rally: HYPE Targets $97 Amid $80 Support
August 25, 2026