Category:
Market AnalysisBitcoin Approaches $64K Amid 32,000 BTC Exchange Inflow

Bitcoin's Resilience at Critical Price Levels 🚀
The cryptocurrency market is witnessing a pivotal moment as Bitcoin navigates volatile trading conditions near the $64,000 threshold. After experiencing a sharp pullback to $62,300, the leading digital asset has demonstrated renewed strength, trading around $63,894 and signaling potential momentum for the weeks ahead. This recovery, however, masks underlying market pressures that traders and investors must carefully monitor.
The recent price action reveals a market caught between competing forces—institutional accumulation versus short-term holder capitulation. Understanding these dynamics is crucial for anyone seeking to comprehend Bitcoin's current trajectory and what may lie ahead for cryptocurrency markets.
The Recovery That Tells Two Stories 📊
Bitcoin's bounce from its intraday low presents a complex narrative. While the price recovery appears positive on the surface, the technical foundation supporting this move remains questionable. The asset has stabilized just above the 78.6% Fibonacci retracement level at $63,183, an area that has served as a critical pivot point since early July.
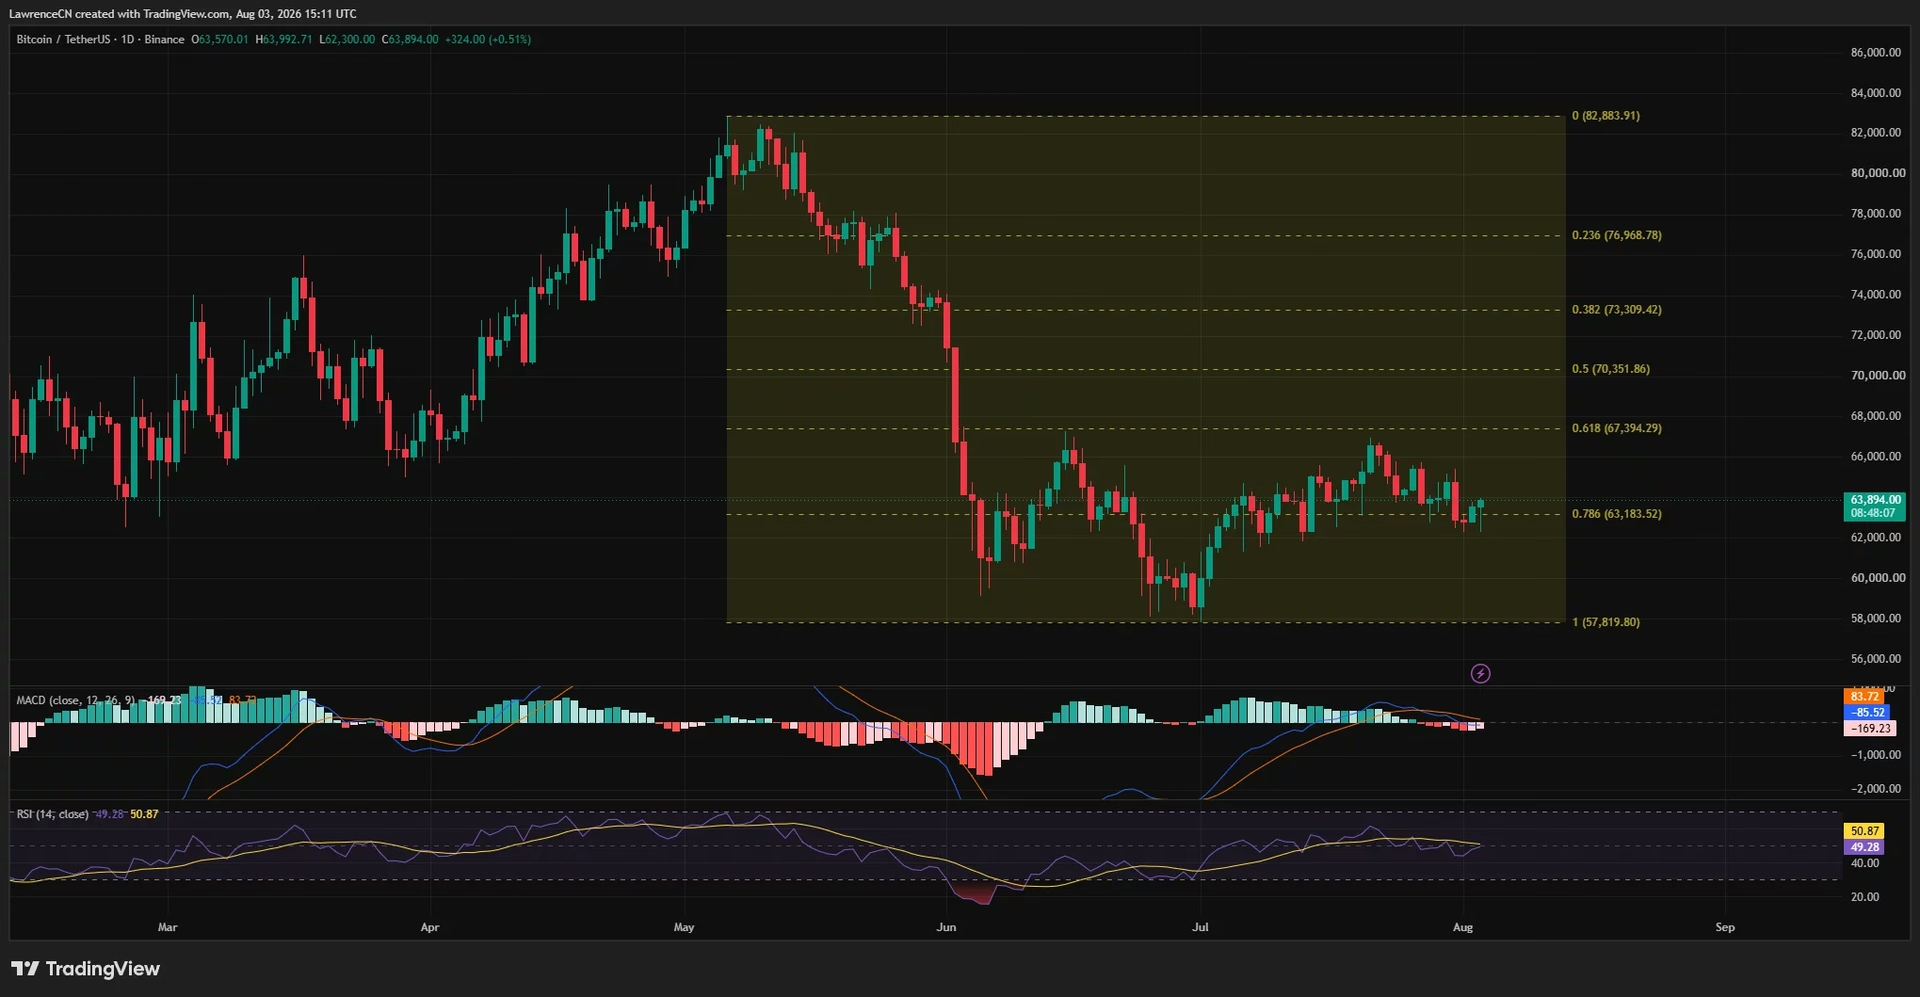
This technical support zone has repeatedly attracted buyers throughout the month, yet each bounce has failed to generate sufficient momentum to break through the $66,000 resistance zone established in July. The current recovery, while welcome, remains constrained by weak spot market demand—a concerning indicator for bulls seeking a more decisive move higher.
Market analysts point to several headwinds limiting Bitcoin's upward trajectory:
- Weak institutional demand in spot markets despite some ETF inflow improvements
- Persistent net selling pressure keeping the market in consolidation
- Proximity to major resistance at $66,000-$67,394 that has proven difficult to overcome
- Deteriorating market profitability affecting investor sentiment
Short-Term Holders Capitulating Under Pressure 😰
One of the most telling indicators of current market stress is the behavior of short-term Bitcoin holders. Within a single 24-hour period, approximately 32,000 BTC moved to cryptocurrency exchanges—representing the largest short-term holder capitulation event in 30 days. This exodus of coins, transferred at a loss, signals defensive positioning and potential panic selling among less experienced market participants.
The significance of this move cannot be overstated. When short-term holders move their positions to exchanges at a loss, it typically indicates they're either liquidating positions to cover losses elsewhere or protecting against further downside. This behavior often precedes either capitulation lows or extended consolidation periods.
Glassnode's market analysis reinforces this bearish signal through additional metrics:
- The proportion of Bitcoin's supply held in profit is approaching cyclical lows
- Investor spending patterns increasingly reflect stop-loss activity
- The ratio of short-term to long-term holder supply remains near historical lows
However, there's a silver lining: long-term holders have remained remarkably resilient, showing no signs of panic selling. This divergence between short-term and long-term holder behavior is historically significant, often preceding market reversals once short-term weakness is exhausted.
Liquidation Clusters Define the Trading Boundaries 🎯
The concentration of leveraged positions surrounding Bitcoin's current price creates distinct zones of volatility risk. These liquidation clusters act like invisible walls that can either accelerate price moves or create resistance.
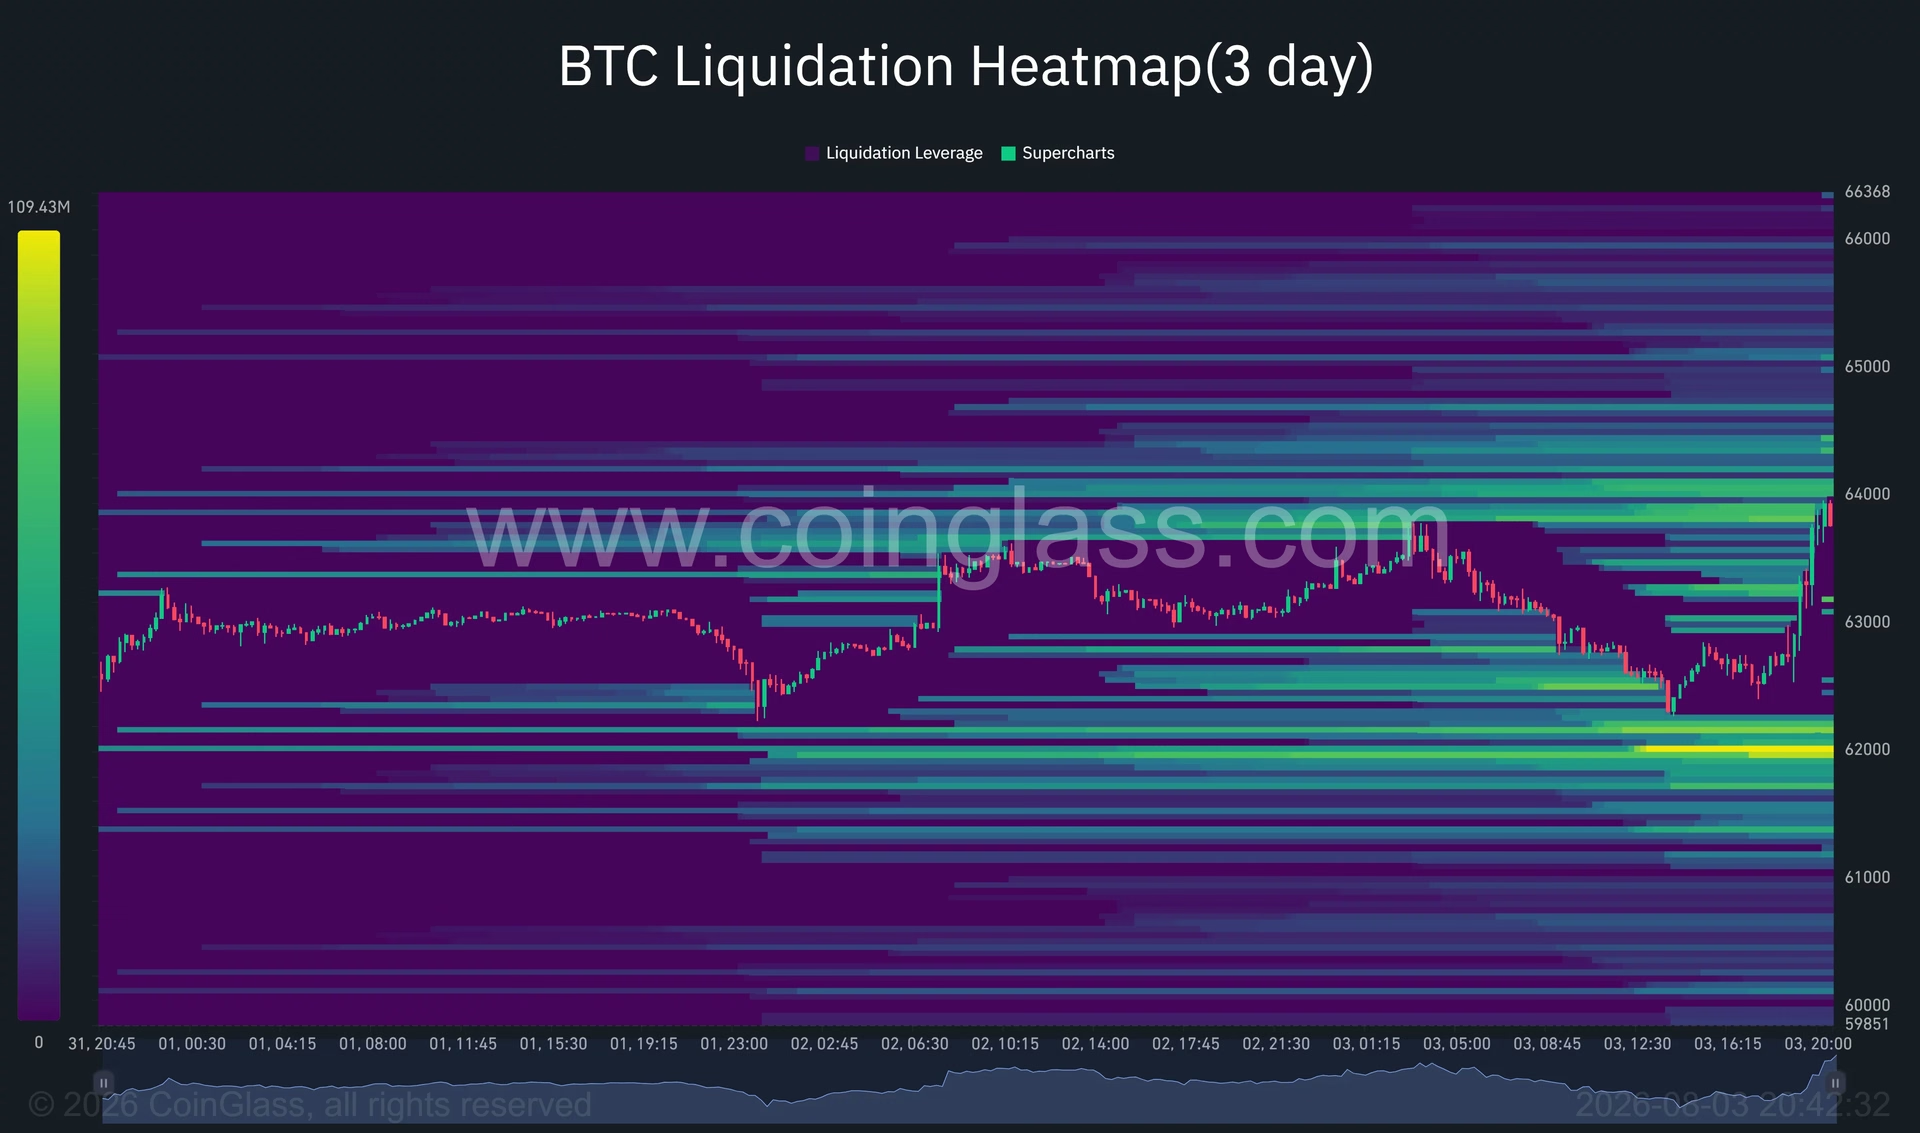
The upside liquidation zone is concentrated between $63,800 and $64,100, with Bitcoin already trading in this area. A decisive break above $64,100 could trigger a cascade of short-position closures, potentially accelerating the price toward $65,000 and beyond. Additional liquidation pools exist near $64,300, $64,800, and $65,000, creating potential resistance at each level.
Conversely, the downside liquidation cluster sits between $61,900 and $62,200—precisely where Bitcoin tested its intraday low. This concentration of long positions creates a floor that could support the price if the recovery loses steam.
These liquidation dynamics present both opportunities and risks:
Bullish Scenario: A break above $64,100 could trigger short squeezes, with targets at $65,000 and potentially toward the July resistance zone at $66,000-$67,394.
Bearish Scenario: A failure to hold $63,183 would expose Bitcoin to another test of $62,000, with the broader range floor near $57,820 coming into focus if support breaks.
Technical Momentum Shows Signs of Fatigue ⚡
Bitcoin's daily technical indicators reveal a market struggling to generate conviction. The Relative Strength Index (RSI) stands at 49.28, indicating balanced momentum rather than a clear directional advantage. This neutral reading suggests neither buyers nor sellers have achieved dominance.
More concerning is the MACD indicator, which shows weakening momentum. The MACD histogram has turned negative while the MACD line remains below its signal line—a configuration that typically precedes further consolidation or downside pressure. Despite the recent recovery from late June lows, the technical picture lacks the strength needed for a decisive bullish reversal.
For Bitcoin to establish a stronger uptrend, it would need to achieve several technical milestones:
- Reclaim $64,000 with conviction and volume
- Clear the July resistance zone at $66,000-$67,394
- Break above the 61.8% Fibonacci level at $67,394
- Target Fibonacci extensions at $70,352 and $73,309
Without these confirmations, the current recovery remains vulnerable to reversal.
Institutional Flows Provide Modest Support 💼
While spot market demand remains weak, there's been a slight improvement in institutional activity through Bitcoin spot ETFs. Recent data shows improved ETF inflows and trading volumes over the past week, suggesting some institutional buyers are cautiously re-entering the market despite broader weakness.
This institutional interest, though modest, provides a counterbalance to the capitulation seen among retail short-term holders. The divergence between institutional accumulation and retail capitulation is a classic market pattern that often precedes significant reversals.
US-based investors particularly watch these ETF flows as a barometer of institutional sentiment. The recent uptick in activity, even amid spot market weakness, suggests some sophisticated players believe current prices offer value—a perspective that conflicts with the pessimism evident in short-term holder behavior.
Network Activity Signals Increased Engagement 🔗
Beyond price action and liquidation data, on-chain metrics provide valuable context. Daily active addresses and adjusted transfer volume have moved above recent statistical ranges, indicating that Bitcoin's latest volatility has been accompanied by greater network usage.
This increased on-chain activity suggests genuine market engagement rather than mere price manipulation. When volatility correlates with increased network usage, it typically indicates real economic activity and decision-making by market participants—a healthier indicator than volatility driven purely by leverage.
The Path Forward: Key Levels to Watch 🔮
Bitcoin's immediate future hinges on its ability to navigate the liquidation clusters that define its current trading range. The $62,000-$64,100 band represents the critical battleground for the next directional move.
For Bulls: A sustained move above $64,100 with volume could accelerate toward $65,000 and the July resistance zone. This would represent a genuine shift in momentum and potentially attract fresh institutional capital.
For Bears: A close below $63,183 followed by a break of $62,000 would increase downside risks significantly, with $60,000 and the broader range floor near $57,820 coming into focus.
The concentration of leverage on both sides of the price ensures that whichever direction Bitcoin breaks will likely be accompanied by significant volatility—a characteristic that defines consolidation phases.
Conclusion: Patience Amid Uncertainty ✨
Bitcoin's current position near $64,000 represents a critical inflection point rather than a definitive trend reversal. The recent recovery has defended near-term support but has not resolved the broader consolidation pattern that has defined the market since July.
Short-term holders have capitulated, transferring 32,000 BTC to exchanges at a loss—a typically bearish signal that often precedes capitulation lows. Yet long-term holders remain steadfast, and institutional flows have shown modest improvement. These competing dynamics suggest the market is searching for direction rather than committing to a clear trend.
For traders and investors, the key takeaway is clear: remain vigilant at the $62,000 and $64,100 liquidation clusters. These levels will determine whether Bitcoin continues its recovery toward $66,000+ or experiences another decline toward the broader range floor. The coming days will likely provide clarity on which scenario unfolds, but until then, volatility should be expected.
The cryptocurrency market rewards patience and disciplined risk management during these transitional periods. Whether you're bullish or bearish, the technical setup demands respect for the levels that matter most.
You May Also Like

Market Analysis
XRP Price Falls 5% as Leverage Hits Seven-Month High
August 26, 2026

Market Analysis
Crypto Market Hits Extreme Greed: What This Means for Bitcoin
August 26, 2026

Market Analysis
Ethereum Price Rally Overheats Below $2,550 Resistance
August 26, 2026

Market Analysis
Hyperliquid Price Rally: HYPE Targets $97 Amid $80 Support
August 25, 2026