Category:
Market AnalysisBitcoin Breaks $64K While Altcoins Face Headwinds

The cryptocurrency market painted a mixed picture on Tuesday as Bitcoin surged above the $64,000 threshold, demonstrating relative strength while major altcoins struggled with significant downward pressure. 💪 This divergence highlights the ongoing tension between Bitcoin's dominance and the broader altcoin ecosystem's vulnerability to market shifts.
Bitcoin's Strong Recovery: Breaking Through Key Resistance 🚀
Bitcoin climbed to $64,262 on Tuesday, posting a modest 1.2% gain over 24 hours and maintaining a 0.5% weekly advance. With a market capitalization hovering near $1.29 trillion and daily trading volume reaching approximately $21.6 billion, the leading cryptocurrency demonstrated resilience despite broader market uncertainties. The recovery followed a volatile trading week where sellers had repeatedly tested the $64,400 to $65,400 resistance zone.
The price action tells an important story: buyers successfully defended the $62,750 support level on Monday, propelling Bitcoin back above the $64,000 mark. This rebound came after the asset had dipped to approximately $62,500 on Friday, briefly revisiting $62,600 on Monday before mounting its recovery.
Understanding Bitcoin's Consolidation Range 📊
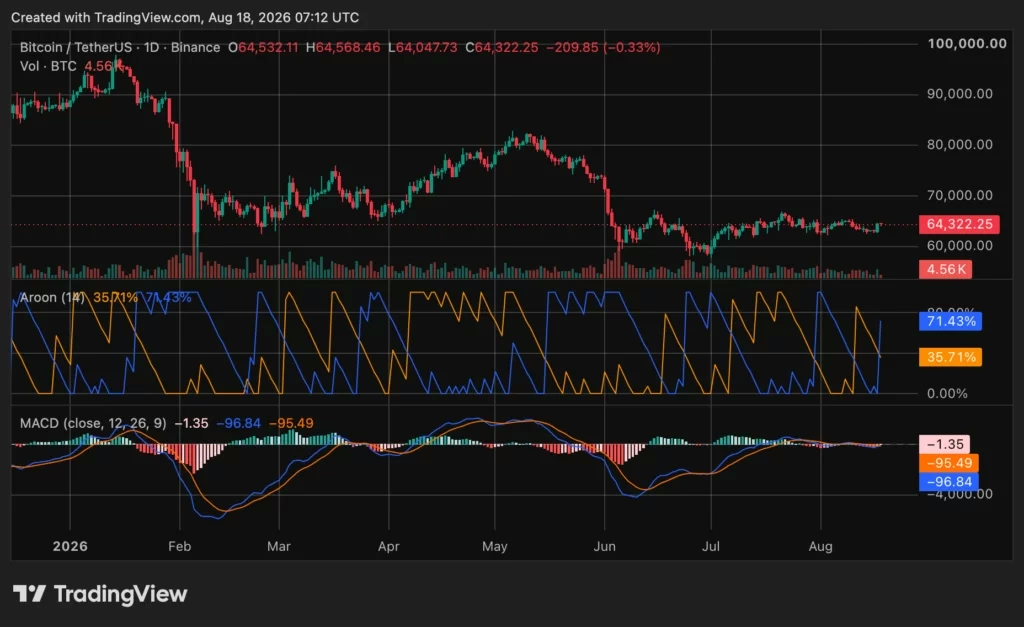
Since the sharp selloff in June, Bitcoin has remained trapped within a $60,000 to $66,000 consolidation range. Tuesday's recovery pushed the price toward the upper half of this band, yet failed to establish a definitive breakout. This containment pattern reflects the ongoing uncertainty in traditional markets and macroeconomic headwinds affecting risk assets globally.
The technical structure reveals several critical levels that traders are monitoring:
Resistance Levels:
- Primary resistance sits between $65,000 and $66,000
- Buyers have made multiple unsuccessful attempts to establish support above $65,000 since early August
- Sellers have repeatedly defended the area immediately above $65,000 during previous recovery attempts
Support Levels:
- Secondary support exists around $63,000
- Recent lows between $62,000 and $62,600 provide additional support
- The broader consolidation floor remains anchored near $60,000
For Bitcoin to improve its short-term technical structure, the price would need to decisively clear the $65,000-$66,000 resistance zone and maintain that level. Such a breakout would signal renewed buying momentum and potentially attract fresh capital into the market.
Altcoin Divergence: Winners and Losers 📉
While Bitcoin held its ground, the altcoin sector experienced pronounced divergence. Bitcoin's market dominance remained below 57%, indicating that altcoins collectively represented more than two-fifths of the total cryptocurrency market capitalization. However, this aggregate figure masks dramatic performance variations within the group.
Leading Gainers:
- HYPE (Hyperliquid): Rose 1.9% to $59.90, gaining 8.2% over seven days
- Venice Token: Led the top 100 gainers with a 12.5% daily surge, reaching approximately $13.70
- POL (Polygon): Climbed 5.9% to $0.0795
- Sky: Advanced 4.5% to $0.0548
- Morpho: Gained 3.4% to $2.11
- Zcash: Added 3% to approximately $508.94
Interestingly, Venice Token's strong performance was accompanied by claims that its annualized revenue had surpassed $100 million. Investors should note that such figures typically represent company run-rate claims rather than audited annual revenue, warranting careful scrutiny.
Notable Decliners:
- Worldcoin: Recorded the largest decline among top 100 assets, plummeting 10.8% to approximately $0.324
- Filecoin: Dropped 6.5% to $0.627
- Bitway: Fell 6.1% to $0.353
- OKB: Declined 5.5%
- Sui and Ether.fi: Each lost 4.1%
- Cosmos: Fell 3.9%
Ether, the second-largest cryptocurrency, traded near $1,901, posting modest gains of 0.2% over 24 hours and 1.5% weekly. Solana gained 0.7% to approximately $75.95, while Chainlink added 0.3% to $9.43, demonstrating relative stability compared to struggling assets like Worldcoin.
Weekly Performance Reveals Stark Contrasts 📈📉
Expanding the timeframe to weekly performance reveals even more dramatic divergence across the altcoin landscape. Some assets demonstrated impressive resilience, while others faced significant headwinds.
Weekly Winners:
- Chainlink surged 12.3%
- HYPE gained 8.2%
- Monero added 6.4%
Weekly Losers:
- Uniswap plummeted 18%
- Filecoin and Pyth Network each fell approximately 11%
This dispersion suggests that market participants are increasingly selective about which projects merit capital allocation. The concentration of gains in specific tokens while others face sustained selling pressure indicates that broader sentiment toward the altcoin sector remains cautious.
Technical Indicators Point to Weak Momentum ⚙️
Bitcoin's technical setup reveals limited momentum despite the price recovery. Analysis of the BTC/USDT daily chart shows the cryptocurrency trading near $64,300, firmly within its established consolidation range and significantly weaker than the May highs near $80,000.
Key technical indicators paint a nuanced picture:
Aroon Indicator:
- Aroon Up: 71.43%
- Aroon Down: 35.71%
- Interpretation: Recent highs carry more weight than recent lows, offering limited support for buyers. However, the indicator has shifted frequently and does not confirm a durable trend.
MACD Analysis:
- MACD line: Near minus 96.84
- Signal line: Around minus 95.49
- Histogram: Near minus 1.35
- Reading: Points to weak bearish momentum rather than accelerating decline
These readings suggest that a decisive move outside the current price range would provide clearer evidence regarding the next directional move. Traders and analysts are particularly watching Bitcoin's 200-week simple moving average, recently estimated near $63,700. Some market observers have noted that losing this level would resemble the 2022 structure, potentially signaling deeper downside risks.
Macroeconomic Headwinds: Oil Prices and Market Dynamics 🛢️
Broader market conditions continue to influence cryptocurrency price action. Brent crude oil rose to approximately $91.76 per barrel on Tuesday as fading hopes for an extended U.S. and Iran ceasefire increased concerns about supply through the Strait of Hormuz. Higher energy prices complicate the inflation and interest rate outlook, creating headwinds for risk assets generally.
Asian equities and bonds weakened as investors grappled with the implications of rising oil costs and elevated government borrowing. Interestingly, Bitcoin moved higher during this session, demonstrating short-term relative strength against traditional risk markets. This divergence suggests that some market participants view Bitcoin as a hedge against macroeconomic uncertainty, despite ongoing correlation with equities during major market dislocations.
What's Next for Bitcoin Price Action? 🔮
The path forward for Bitcoin depends on whether buyers can establish and maintain support above $65,000. The cryptocurrency remains at a critical juncture, with multiple resistance attempts having failed since early August. A breakout above the $65,000-$66,000 zone would suggest renewed institutional interest and potentially attract fresh capital into the market.
Conversely, failure to break above resistance could result in a retest of the $62,000-$62,600 support zone or even the broader consolidation floor near $60,000. The 200-week moving average near $63,700 represents an important psychological level that warrants close monitoring.
Key Takeaways 💡
The cryptocurrency market's current structure highlights several important realities for investors:
- Bitcoin's Relative Strength: Despite altcoin weakness, Bitcoin's ability to hold above $64,000 demonstrates its position as the market's anchor asset
- Altcoin Selectivity: Capital is increasingly concentrated in specific projects, with clear winners and losers emerging
- Technical Uncertainty: Bitcoin's consolidation pattern and neutral momentum indicators suggest the market awaits a catalyst for directional clarity
- Macroeconomic Sensitivity: Broader economic conditions, particularly oil prices and inflation expectations, continue influencing cryptocurrency valuations
- Risk Management: The divergence between Bitcoin and altcoin performance underscores the importance of diversification and careful position sizing
As the market continues to digest macroeconomic signals and technical developments, traders and investors should remain vigilant about key support and resistance levels. The next significant move in Bitcoin price action could trigger substantial shifts across the broader cryptocurrency ecosystem, making technical analysis and fundamental research essential tools for navigating this dynamic market environment. ✨
You May Also Like

Market Analysis
XRP Price Falls 5% as Leverage Hits Seven-Month High
August 26, 2026

Market Analysis
Crypto Market Hits Extreme Greed: What This Means for Bitcoin
August 26, 2026

Market Analysis
Ethereum Price Rally Overheats Below $2,550 Resistance
August 26, 2026

Market Analysis
Hyperliquid Price Rally: HYPE Targets $97 Amid $80 Support
August 25, 2026