Category:
Market AnalysisBitcoin Breaks $68K as $1B Short Squeeze Triggers Rally 🚀

The cryptocurrency market witnessed a dramatic turning point as Bitcoin surged decisively past the $68,000 milestone, igniting one of the most explosive price movements in recent weeks. What began as a gradual recovery transformed into a powerful rally when the leading digital asset breached critical liquidation levels, forcing short sellers into a capitulation event that reverberated across global exchanges. 💥
This wasn't merely a routine price movement—it was a textbook example of how technical levels and leveraged positioning can create explosive volatility in cryptocurrency markets.
The $1 Billion Short Squeeze That Shook Markets 📊
Within a single hour on Wednesday evening, over $1 billion in cryptocurrency short positions were forcibly liquidated as Bitcoin's price action accelerated upward. The sequence of events unfolded with remarkable speed: Bitcoin climbed from below $65,000 to an intraday peak near $69,500, representing a stunning 4% gain in just one minute—a move that dwarfed the magnitude of any complete daily candle seen in recent months.
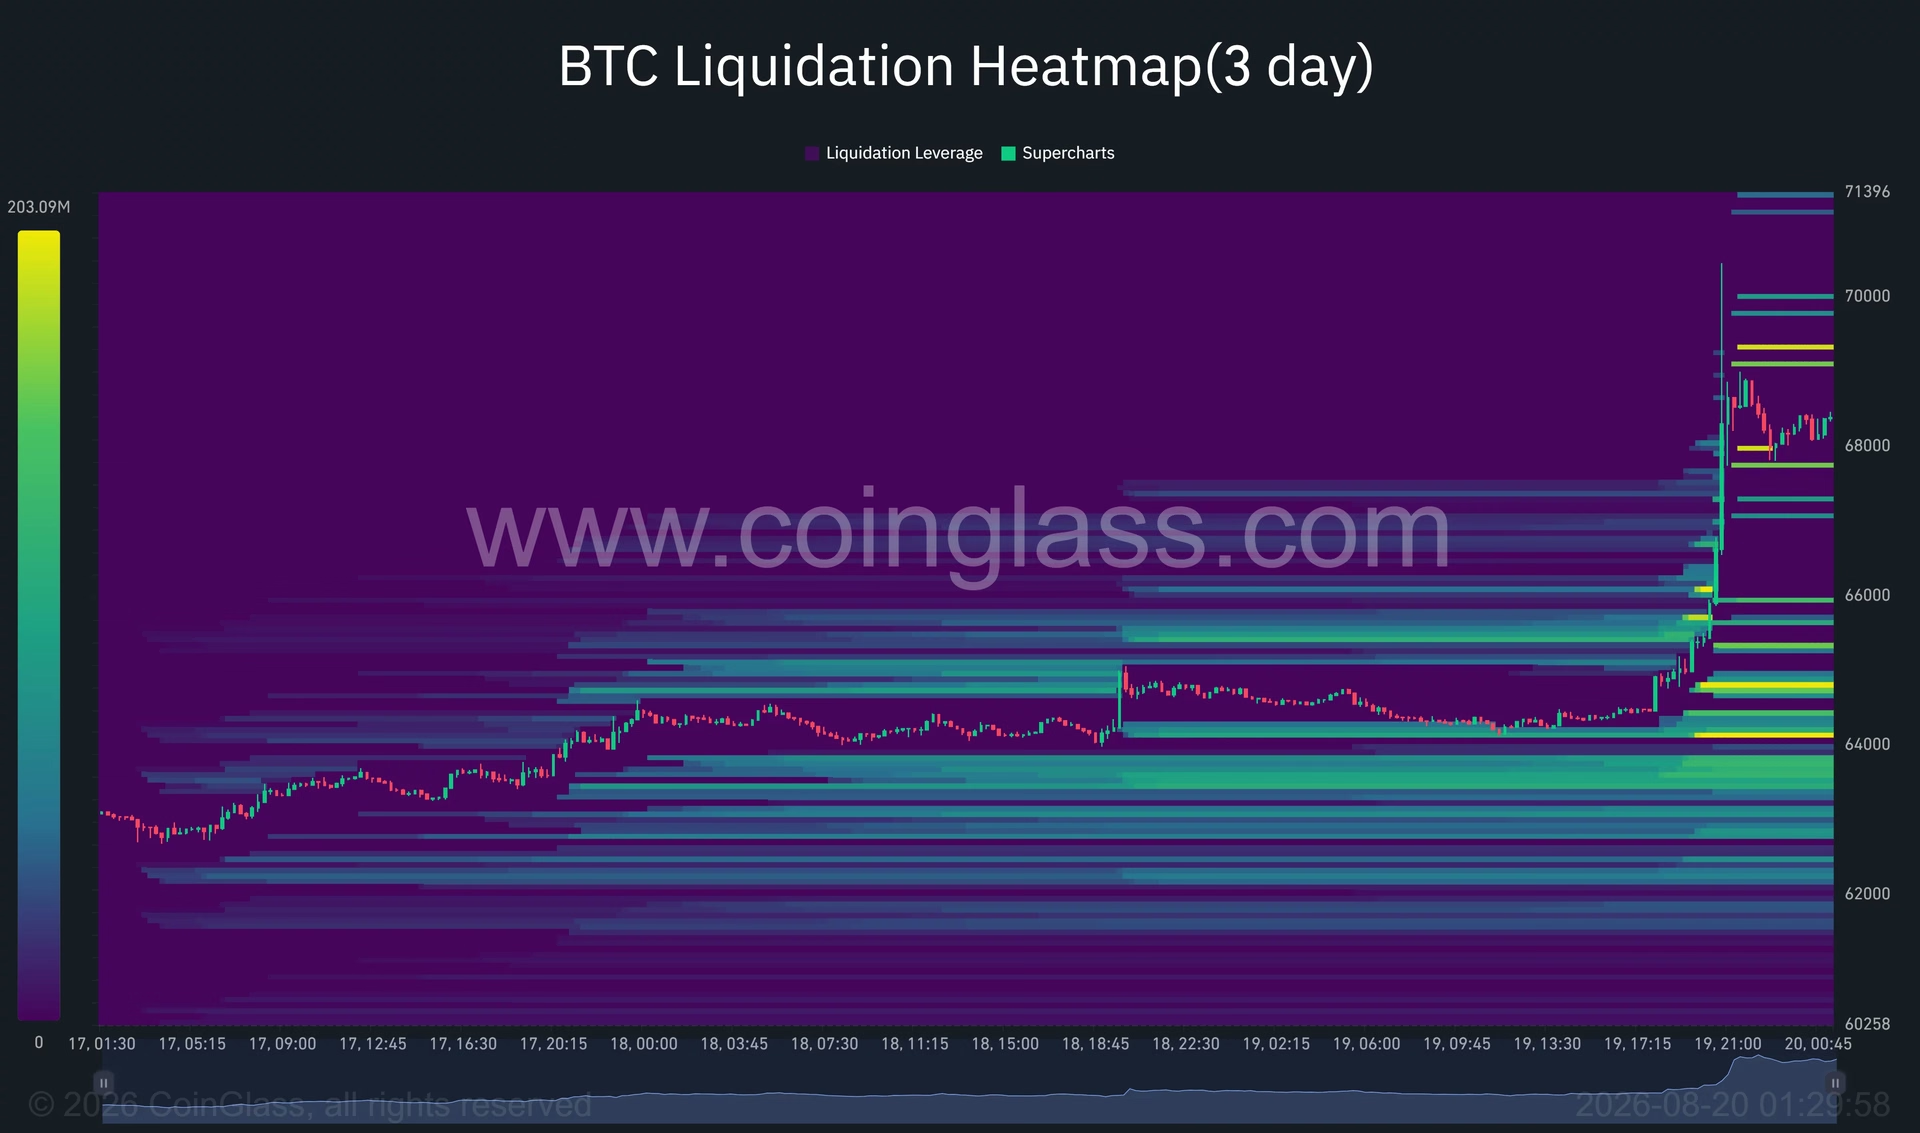
The broader liquidation picture proved even more dramatic. As Bitcoin continued climbing through resistance zones, the total value of liquidated shorts eventually reached $1.79 billion—a staggering amount that underscored how overleveraged the market had become at those price levels. Market participants who had accumulated short positions during the previous weeks of consolidation found themselves caught in a vicious cycle: as prices rose and collateral values declined, automated liquidation systems forced their positions to close, requiring them to buy Bitcoin at increasingly higher prices.
This forced buying created a self-reinforcing feedback loop that accelerated the rally beyond what organic buying pressure alone could have achieved. Traders who had positioned themselves for continued weakness were instead forced to become unwilling buyers, adding fuel to the upward momentum.
Breaking Through Two Months of Consolidation 📈
Bitcoin's breakthrough proved significant because it decisively cleared a two-month trading range that had frustrated both bulls and bears. For weeks, the asset had oscillated between approximately $62,000 and $66,000, with buyers repeatedly failing to establish positions above $65,000. This repeated rejection at the upper boundary had created an attractive setup for short sellers, who accumulated leveraged positions betting on continued weakness.
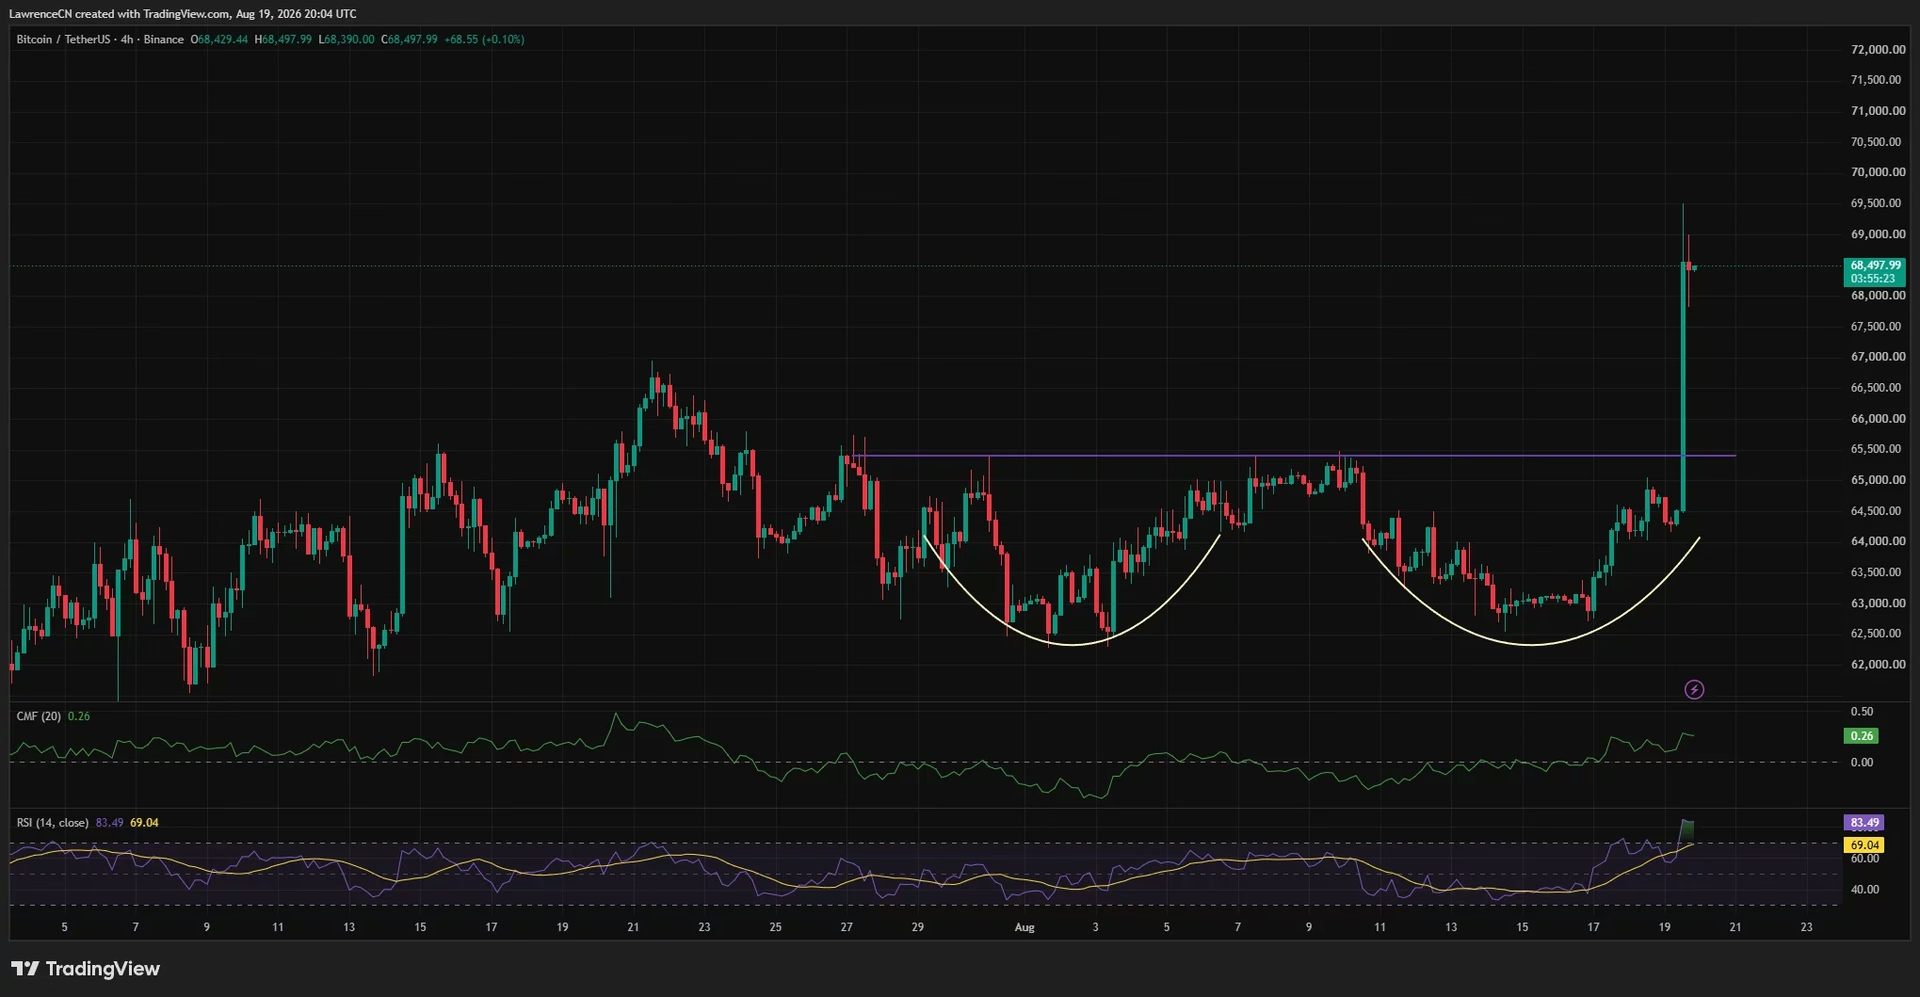
The technical structure that formed during this consolidation period was particularly important. A double-bottom pattern emerged, with both lows forming near $62,200 during late July and mid-August. The neckline of this pattern—the level connecting the two peaks between the bottoms—sat around $65,400. When Bitcoin decisively broke above this neckline on Wednesday, it activated the pattern's measured move objective, which pointed toward the $68,500–$69,000 region where the price action ultimately settled.
This breakout wasn't subtle. The move shattered through the neckline with a single powerful candle, propelling Bitcoin roughly $3,000 above what had previously been formidable resistance. The speed and conviction of the move signaled that the consolidation phase had ended and a new directional bias had established itself.
Capital Flow Confirms Bullish Momentum 💹
Technical indicators validated the strength of the breakout beyond mere price action. The 4-hour Chaikin Money Flow indicator, which measures the relationship between buying and selling pressure, surged to 0.26—a reading that clearly demonstrated buying pressure had overwhelmed selling pressure during the move. This divergence between price momentum and volume-weighted capital flows is particularly significant because it suggests the rally had genuine underlying support rather than representing merely a technical bounce.
Bitcoin also reclaimed its 100-day simple moving average near $66,288 on the daily timeframe, a psychological level that often serves as an indicator of medium-term trend direction. However, the asset remained slightly below the 200-day average near $69,031, positioning the $69,000–$70,000 zone as the next critical test for the recovery's sustainability.
Overbought Conditions and Short-Term Risks ⚠️
The explosive nature of the rally created stretched conditions that warrant careful monitoring. The 4-hour relative strength index (RSI) rocketed to 83.49—well above the 70 level conventionally associated with overbought conditions. The RSI average hovered near 69, illustrating the remarkable speed at which momentum had accelerated. While overbought readings don't necessarily require immediate pullbacks, especially during squeeze-driven rallies, they do elevate the risk of profit-taking or a retest of the breakout level.
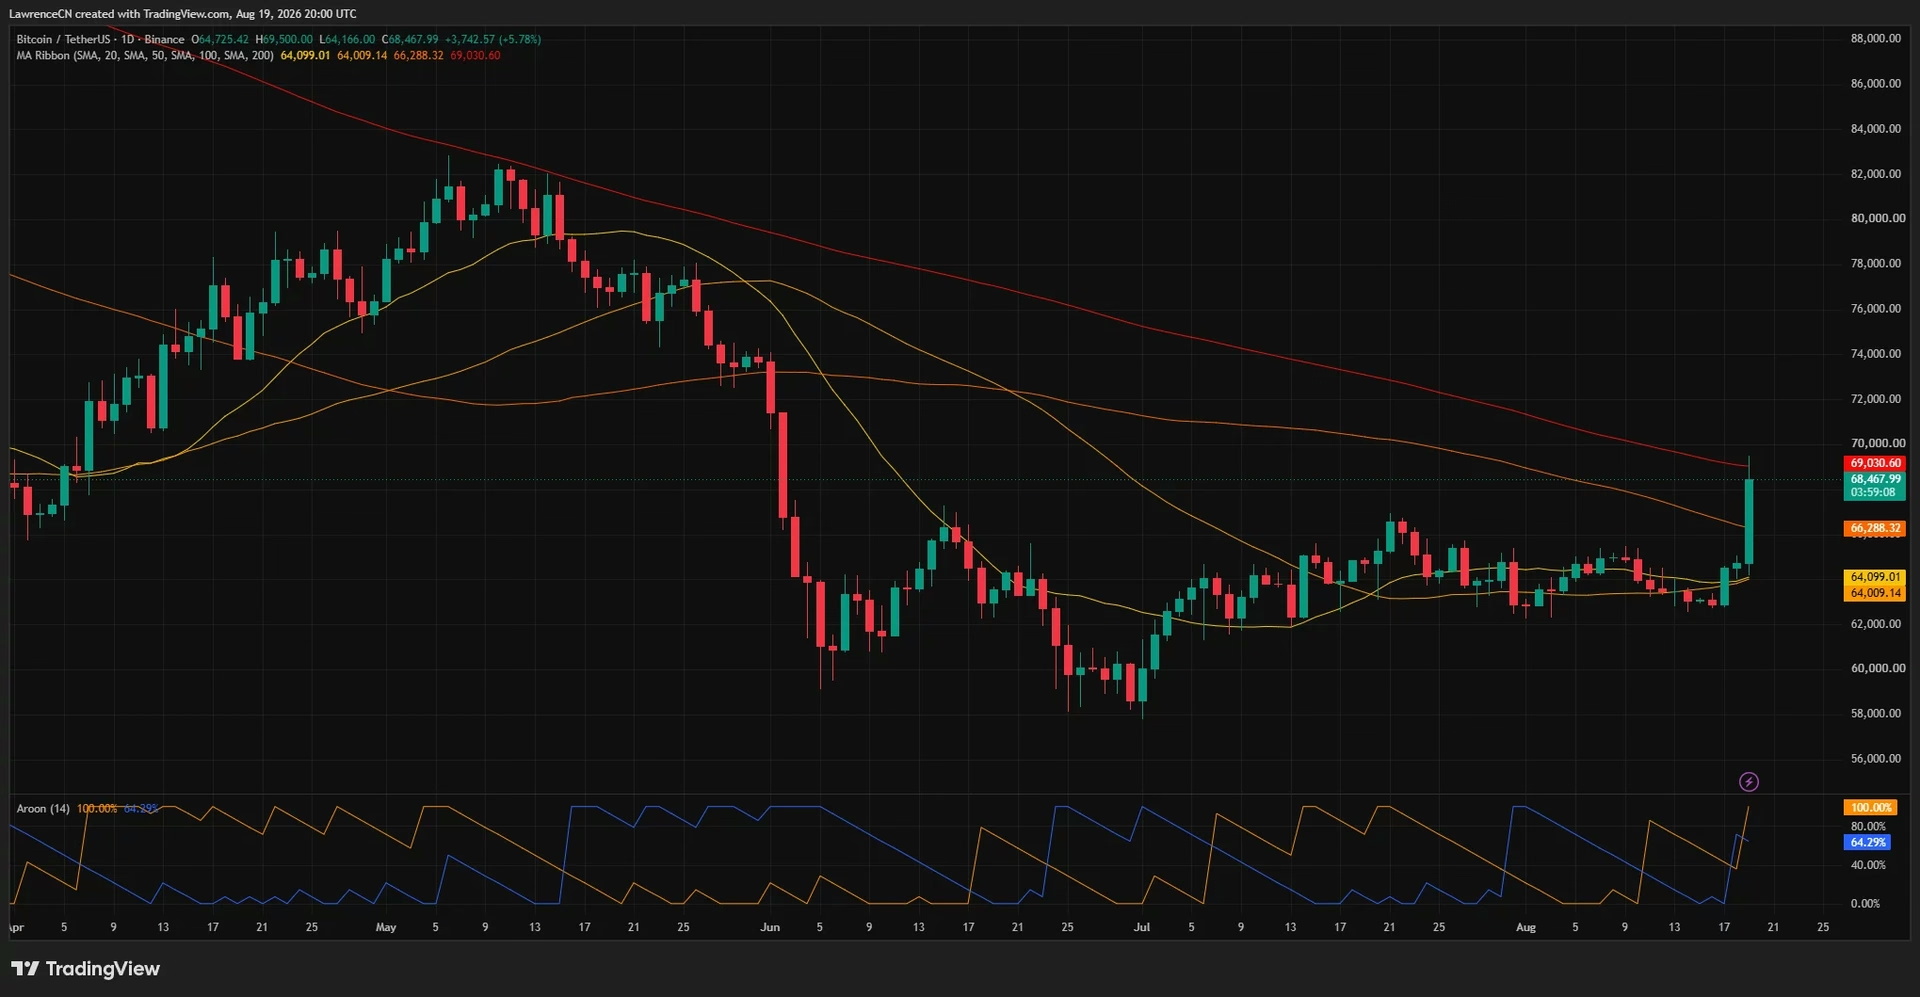
Evidence of selling pressure already emerged near the $69,500 peak, where a long upper wick formed on the 4-hour chart. This rejection above $69,000 suggested that sellers had begun defending this level, introducing a potential near-term ceiling for the rally. Market participants should monitor whether Bitcoin can establish a daily close above the $69,000–$70,000 resistance zone—such a close would significantly improve the case for an extended move toward $72,000 or beyond.
Regulatory Tailwinds and Macro Support 🏛️
Beyond technical factors, the Bitcoin rally benefited from favorable developments in the regulatory and macroeconomic landscape. The U.S. Securities and Exchange Commission published a new "Regulation Crypto Assets" framework on August 18, which proposed tailored registration exemptions for certain crypto-related investment contracts. This framework would permit eligible startups to raise up to $5 million over four years, while qualifying issuers could access as much as $75 million in a 12-month period, subject to appropriate disclosures.
While the proposal remains subject to public feedback and potential modifications before implementation, its mere publication signaled a meaningful shift toward clearer fundraising rules for U.S. crypto companies. This regulatory clarity reduces uncertainty and potentially opens pathways for institutional participation and capital formation in the digital asset space.
Simultaneously, the U.S. Treasury announced plans to at least double the maximum size of liquidity-support buybacks for longer-dated government bonds, effective September 9. The maximum purchase size for 10- to 30-year securities would increase from $2 billion to at least $4 billion per operation. While the Treasury characterized these purchases as liquidity-support measures rather than monetary stimulus, the announcement nevertheless resulted in lower long-term Treasury yields and a weaker dollar—both factors that typically improve demand for risk assets like Bitcoin.
Supply Dynamics and ETF Demand 🔄
Before the Wednesday evening breakout, spot Bitcoin exchange-traded funds had experienced renewed demand, according to market analysts. This capital inflow into regulated investment vehicles provided a structural bid for Bitcoin that complemented the technical setup. Additionally, the market had begun experiencing fading profit-taking pressure, creating a more supportive supply environment.
Notably, Bitcoin's rally broke from the cross-asset correlation pattern that had dominated markets since the Iran-U.S. conflict disrupted typical relationships in early March. On Wednesday evening, Bitcoin rose while U.S. equities fell—a decoupling that suggested the cryptocurrency was responding to its own fundamental and technical drivers rather than simply following broader risk sentiment.
What Lies Ahead: Key Levels and Scenarios 🎯
The path forward presents several critical decision points. A daily close above the $69,000–$70,000 resistance zone would substantially strengthen the bullish case and potentially open the door to a move toward $72,000. Some analysts have identified $74,000 as a more significant weekly-level resistance, arguing that reclaiming this level would meaningfully reduce the probability of Bitcoin falling below $55,000 in subsequent months.
Conversely, failure to hold the breakout could return focus to $67,000 as initial support, followed by the former neckline around $65,400. The liquidation heatmap reveals the strongest nearby support cluster sits between approximately $64,000 and $65,500, providing a floor for any near-term pullback.
The Bigger Picture: Market Maturation and Leverage Risks 🌐
The $1 billion short squeeze highlights both the growing sophistication of cryptocurrency markets and the inherent risks created by leverage. As institutional capital has entered the space, so too have more complex trading strategies and derivative products. The sheer volume of liquidations suggests that significant leverage had accumulated at these price levels—a reminder that while leverage can amplify gains, it can equally accelerate losses and create destabilizing feedback loops.
This event demonstrates why proper risk management remains paramount in cryptocurrency trading. Positions sized without appropriate consideration for liquidation risk can turn profitable setups into devastating losses within minutes. The speed of the move—from $65,000 to $69,500 in approximately one hour—left minimal time for traders to adjust positions or hedge exposure.
Key Takeaways 🎬
Bitcoin's breakthrough above $68,000 represents a genuine technical breakout that cleared two months of consolidation and activated measured move objectives. The $1 billion short squeeze that accompanied this move underscores the dangers of overleveraged positioning and demonstrates how technical levels can create explosive volatility when leveraged traders are forced to capitulate.
The rally benefited from favorable regulatory signals and macroeconomic developments, including the SEC's new crypto assets framework and the Treasury's bond buyback expansion. These tailwinds suggest that the broader environment for risk assets has improved.
Near-term conditions remain stretched, with RSI readings deep in overbought territory and sellers already defending the $69,000–$70,000 zone. Traders should monitor whether Bitcoin can establish a daily close above this level, as such confirmation would strengthen the case for an extended rally toward $72,000 and beyond.
The strongest support cluster below the breakout sits between $64,000 and $65,500, providing a floor for any pullback while also representing the zone where short sellers might attempt to rebuild positions at more favorable prices.
As cryptocurrency markets continue maturing, events like this short squeeze serve as reminders that technical analysis, leverage dynamics, and macroeconomic factors remain intertwined in driving price action. Traders and investors who understand these relationships position themselves to navigate the inevitable volatility that characterizes digital asset markets. 🚀✨
You May Also Like

Market Analysis
XRP Price Falls 5% as Leverage Hits Seven-Month High
August 26, 2026

Market Analysis
Crypto Market Hits Extreme Greed: What This Means for Bitcoin
August 26, 2026

Market Analysis
Ethereum Price Rally Overheats Below $2,550 Resistance
August 26, 2026

Market Analysis
Hyperliquid Price Rally: HYPE Targets $97 Amid $80 Support
August 25, 2026