Category:
Market AnalysisBitcoin Price Falls 2% as CPI Uncertainty Threatens $63.9K Support

Bitcoin's recent price movement has captured the attention of traders and investors worldwide, as macroeconomic headwinds continue to weigh on the leading cryptocurrency. 📉 The digital asset experienced a notable pullback, trading as low as $63,852 before recovering to approximately $64,281, leaving market participants questioning whether key support levels can hold firm in the face of mounting economic uncertainty.
Understanding Bitcoin's Current Market Pressure 🔍
The cryptocurrency markets faced significant headwinds on August 11, driven by a confluence of factors that extended beyond the crypto space itself. Rising crude oil prices, driven by deteriorating U.S.-Iran negotiations over the Strait of Hormuz, created broader macroeconomic concerns that rippled through risk assets globally. Brent crude surged above $89 per barrel, reigniting inflation worries that directly impact how the Federal Reserve approaches monetary policy.
This energy price spike matters considerably for Bitcoin's trajectory. Higher oil prices translate into increased transportation and production costs across the economy, which can complicate inflation data and influence central bank decision-making. When energy becomes more expensive, the entire cost structure of goods and services shifts, potentially pushing inflation metrics higher than expected.
The CPI Report: A Critical Catalyst for Bitcoin Direction 📊
The upcoming Consumer Price Index report loomed large over trading activity, creating an environment where risk appetite contracted sharply. U.S. spot Bitcoin exchange-traded funds recorded $144.6 million in net outflows on August 10, marking a reversal after five consecutive sessions of positive capital inflows. This shift in institutional demand represented a significant change in market sentiment, particularly among sophisticated investors who typically provide stability during volatile periods.
The institutional pullback underscored a broader truth about Bitcoin's current market dynamics: the cryptocurrency remains highly sensitive to macroeconomic data and Federal Reserve policy expectations. When inflation reports approach, traders typically reduce risk exposure, preferring to wait for clarity before committing fresh capital. This cautious stance is rational, given that inflation data can dramatically shift interest rate expectations and bond yields, which inversely affects risk asset valuations.
Bitcoin's Technical Structure: Consolidation or Capitulation? 📈
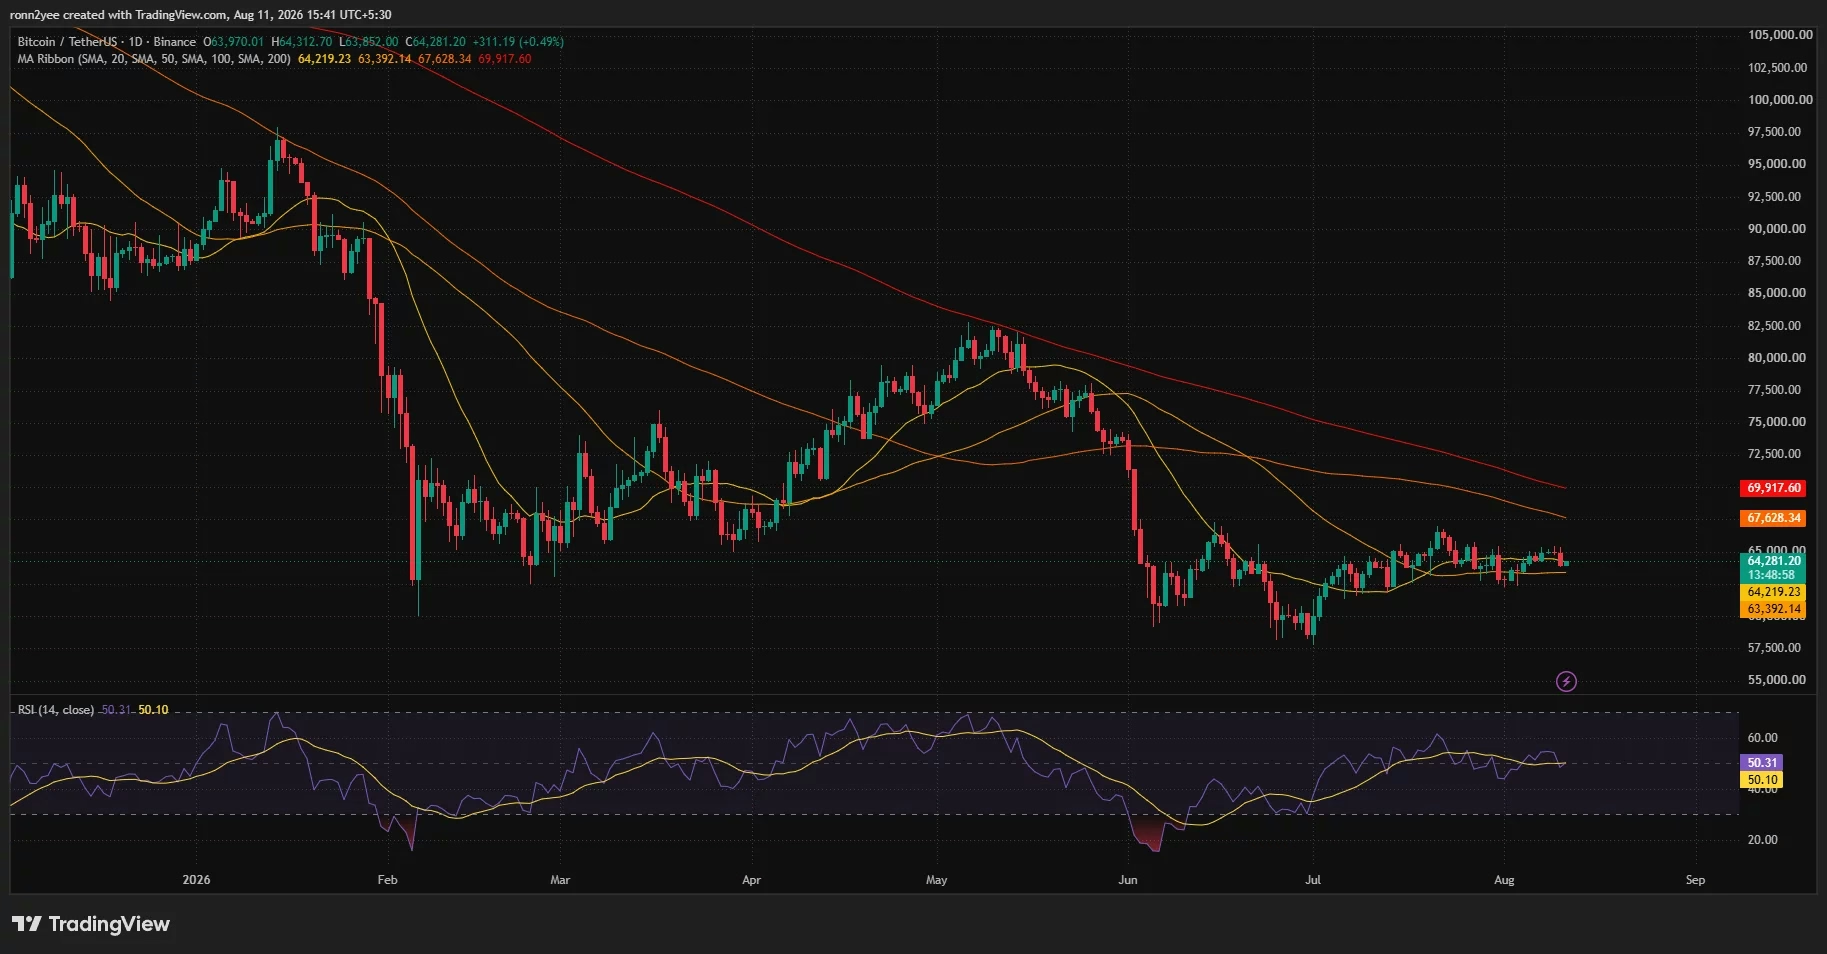
From a technical perspective, Bitcoin has established a consolidation pattern following the June decline, with repeated attempts to establish sustained recovery above $65,000 meeting resistance. The cryptocurrency has found consistent buyer support in the $60,000–$63,000 range, creating a trading corridor that has defined market behavior for weeks.
The daily chart reveals several important technical markers:
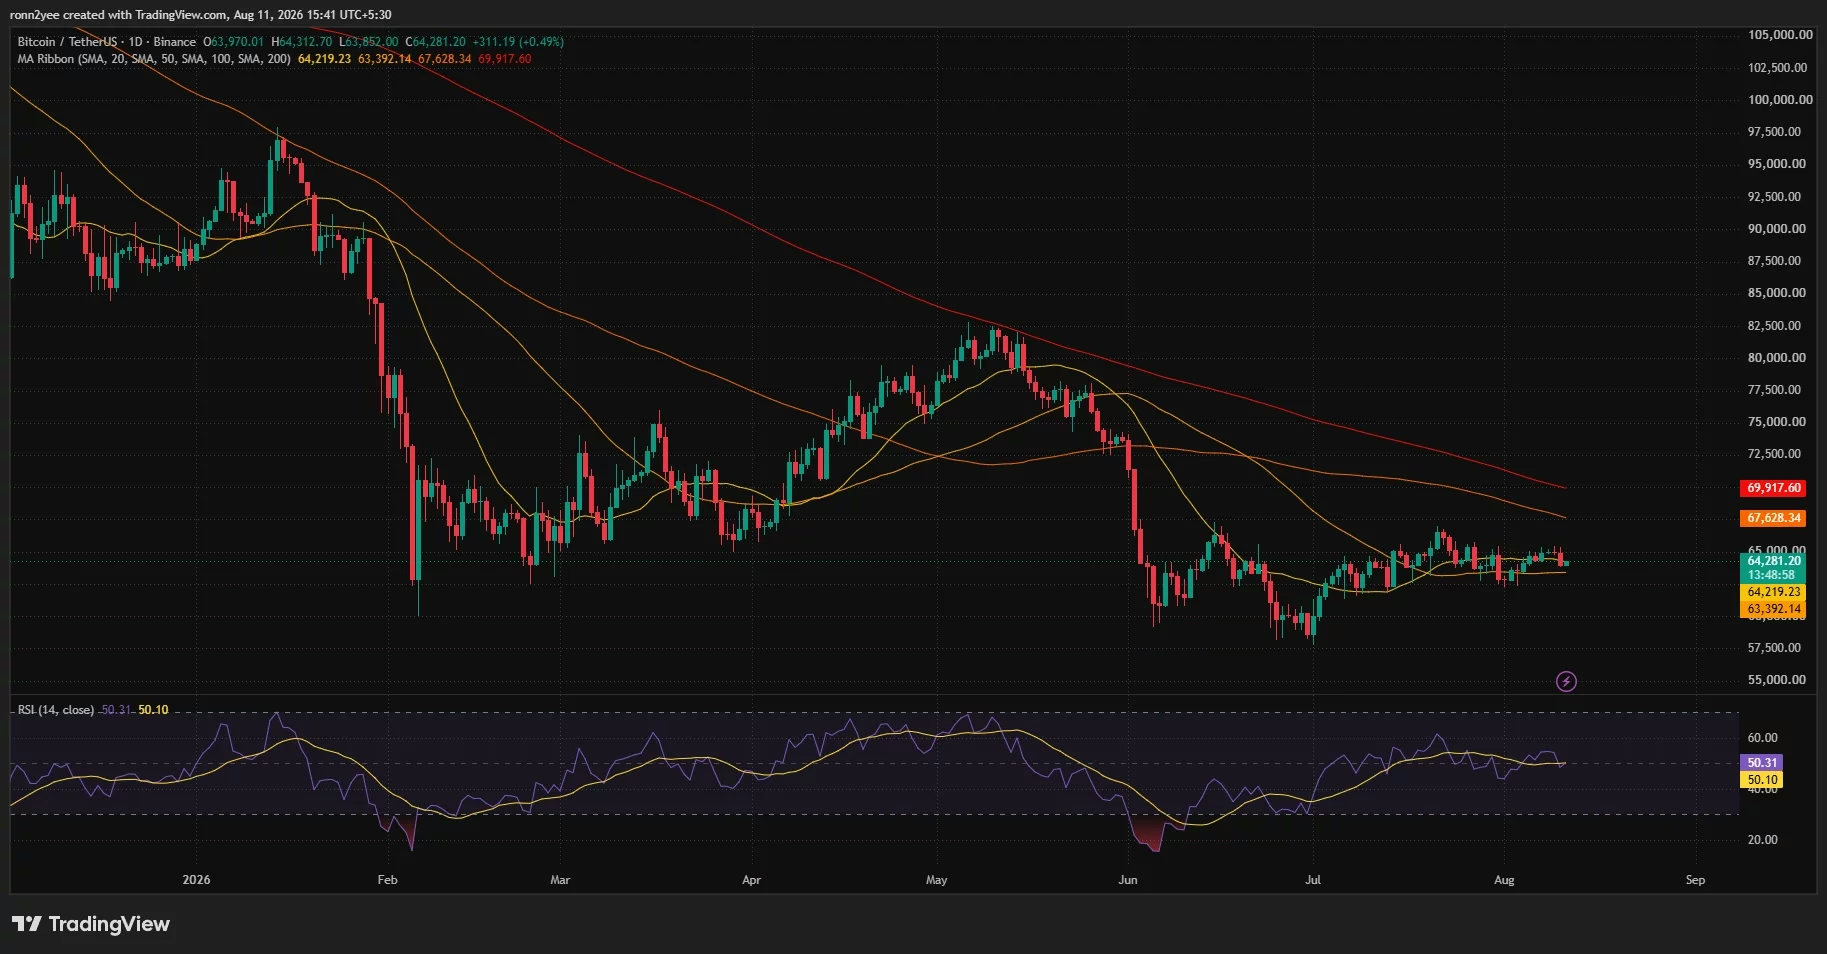
- 20-day Simple Moving Average: Trading at $64,219, providing short-term support
- 50-day Simple Moving Average: Located at $63,392, critical for maintaining recovery structure
- 100-day Simple Moving Average: Positioned at $67,628, representing significant overhead resistance
- 200-day Simple Moving Average: Sitting at $69,918, marking the longer-term bearish trend
Bitcoin's position relative to these moving averages tells a compelling story. The cryptocurrency trades below both the 100-day and 200-day averages, which are sloping downward—a technical configuration that suggests the broader trend remains under pressure. This creates a substantial resistance zone between $67,600 and $70,000 that must be overcome for a confirmed trend reversal.
The $63,900 Level: Where Bears and Bulls Battle 🎯
Traders have zeroed in on the $63,900–$64,000 region as the critical pivot point for near-term price action. This level holds significance beyond simple round-number psychology. According to technical analysis from leading traders, $63,900 represents the 50% retracement mark of the previous weekly candle, making it a mathematically important level where institutional orders often cluster.
The importance of this support cannot be overstated. Bitcoin briefly dipped below $63,900 during the recent sell-off but found buyers willing to defend the level. This defensive action suggests that market participants view this region as a line in the sand—a point where the risk-reward calculation becomes attractive enough to warrant fresh long positions.
What happens if $63,900 breaks? The next meaningful support zone emerges at $63,200, followed by a broader demand area between $57,500 and $60,000 from the June-July period. Conversely, if buyers maintain control above $63,900, another leg toward the previous weekly high around $65,500 becomes possible.
Momentum Indicators: A Neutral Zone 🔄
The daily Relative Strength Index (RSI) stands at 50.31, virtually touching its signal line at 50.10. This neutral reading indicates that neither buyers nor sellers currently possess decisive momentum—a situation that typically precedes significant directional moves. RSI readings at the 50 level suggest the market is in equilibrium, waiting for a catalyst to break the stalemate.
This neutrality extends to the broader technical picture. The absence of extreme readings in momentum indicators suggests that capitulation conditions have not yet emerged, meaning the potential for further downside exists if support levels fail to hold. Conversely, the lack of overbought conditions means there's room for a sustained rally if buyers regain control.
Liquidation Heatmap: Where Forced Selling Lurks 🌡️
The liquidation landscape reveals critical information about leveraged positions that could accelerate price moves in either direction. Large concentrations of liquidations cluster at specific price levels, and understanding these zones helps traders anticipate potential volatility.
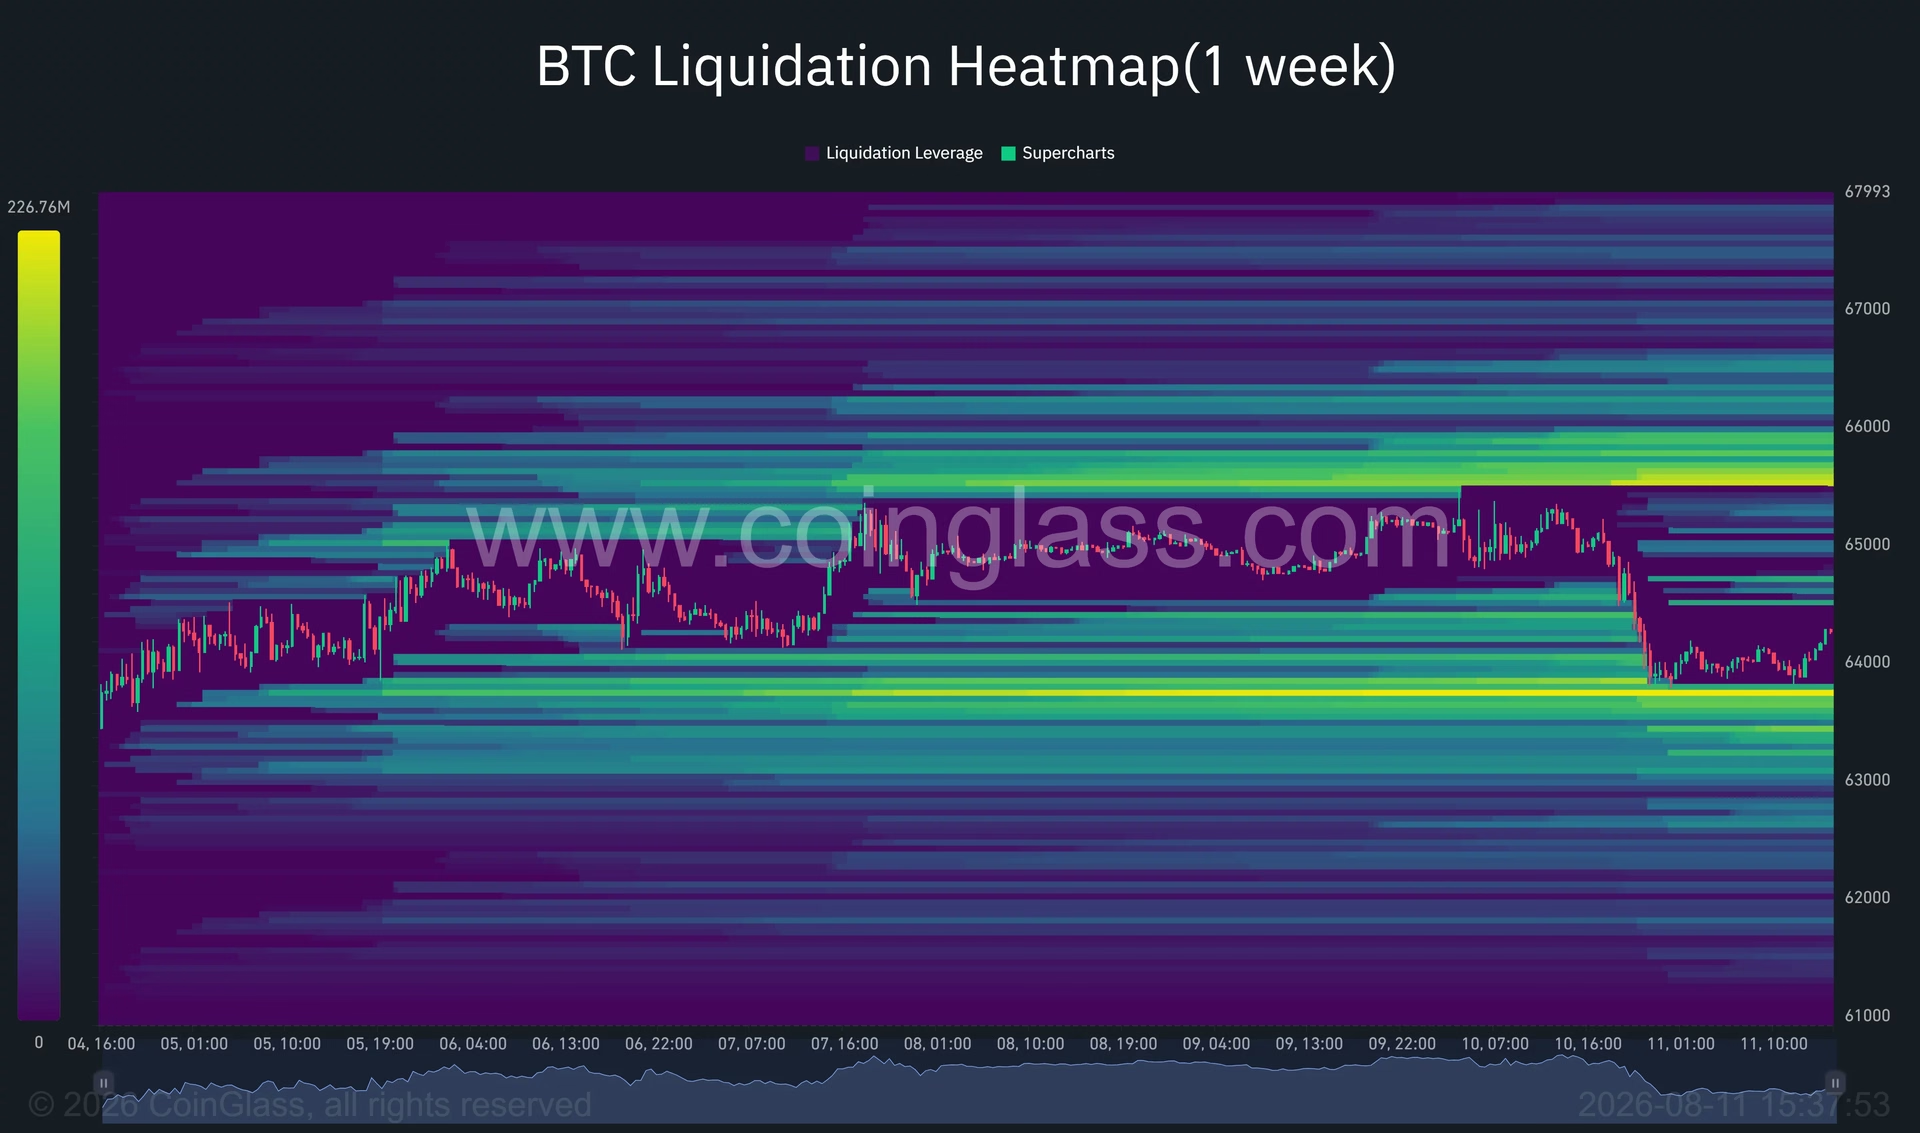
Downside liquidation clusters:
- $63,600–$63,800: The most immediate concern, where leveraged long positions would face forced selling
- $63,200–$63,400: A secondary cluster that could accelerate selling if the first level breaks
Upside liquidation opportunities:
- $65,500–$65,700: The largest nearby concentration that could attract short liquidations during a rebound
- $66,200 and $67,000: Additional liquidity zones requiring a confirmed breakout
These liquidation clusters act as magnetic points for price action. When Bitcoin approaches these levels during volatile moves, algorithmic traders and liquidation hunters often participate, creating self-reinforcing price movements. Understanding this dynamic helps explain why certain price levels attract disproportionate volatility.
The Broader Altcoin Picture 🌐
Bitcoin's weakness rippled through the broader cryptocurrency market. Ethereum and XRP both declined more than 2%, following Bitcoin's lead lower. This synchronized weakness across major cryptocurrencies indicates that the selling pressure stemmed from macro concerns rather than asset-specific issues. When entire market segments move together, it typically signals that external factors—like macroeconomic data or risk sentiment shifts—are driving the action rather than individual project fundamentals.
Historical Context: Bitcoin's Relationship with Inflation Data 📚
Bitcoin's sensitivity to inflation reports reflects its evolving role in modern markets. Originally designed as a hedge against currency debasement and inflation, Bitcoin paradoxically has become more correlated with risk assets in recent years. During periods of heightened inflation concerns, investors often reduce risk exposure across all asset classes, including Bitcoin, as they await clarity on central bank responses.
This dynamic has become more pronounced since Bitcoin's emergence as a tradeable asset class with significant institutional participation. When inflation data approaches, the entire investment community recalibrates expectations around interest rates, bond yields, and equity valuations. Bitcoin, lacking cash flows or dividends, becomes particularly vulnerable during these recalibration periods, as investors retreat to safer assets.
Looking Ahead: Key Levels to Monitor 👀
The path forward depends critically on whether Bitcoin can maintain support above $63,900. A daily close below the 50-day simple moving average at $63,392 would weaken the recovery structure and expose $62,000. Conversely, a close above $65,500 would provide bulls with another opportunity to challenge the 100-day simple moving average and potentially establish a higher trading range.
The 4-hour Supertrend indicator has turned bearish, placing resistance at $65,210. Bitcoin must reclaim both the $64,344 level and the $65,210 resistance before the short-term trend can be considered bullish again. Bull-bear power remains negative at -612, confirming that sellers retain short-term control, though the magnitude suggests capitulation conditions have not yet been reached.
What Traders Should Watch For 🎬
Several developments warrant close monitoring in the coming days:
- CPI Data Release: The actual inflation report could serve as a major catalyst for directional movement
- Oil Price Stability: Continued strength in crude could maintain macro headwinds
- Institutional Fund Flows: Watch for reversal signals in spot Bitcoin ETF flows
- Support Level Holds: Whether $63,900 and $63,200 remain intact
- Moving Average Crossovers: Daily closes relative to the 50-day and 100-day moving averages
The Bottom Line: Patience Remains Essential ✨
Bitcoin's current positioning reflects the broader uncertainty gripping financial markets. The cryptocurrency remains locked in a consolidation pattern, with neither buyers nor sellers demonstrating decisive control. The $63,900 support level represents the immediate battleground, and whether this level holds or breaks will determine the trajectory for the remainder of the week.
Investors and traders should recognize that periods of consolidation, while frustrating, often precede significant directional moves. The neutral momentum readings and balanced liquidation landscape suggest that a catalyst—likely the inflation report—will eventually break the current stalemate. Until that catalyst arrives, patience and disciplined risk management remain the most valuable tools in any trader's arsenal.
The cryptocurrency market has demonstrated remarkable resilience through numerous cycles of boom and bust. Bitcoin's ability to recover above $64,000 despite macroeconomic headwinds suggests that underlying demand remains intact, even if it's temporarily suppressed by near-term uncertainty. For long-term investors, these periods of weakness often present compelling opportunities, while short-term traders must respect the technical levels and liquidation clusters that could trigger rapid moves in either direction.
You May Also Like

Market Analysis
XRP Price Falls 5% as Leverage Hits Seven-Month High
August 26, 2026

Market Analysis
Crypto Market Hits Extreme Greed: What This Means for Bitcoin
August 26, 2026

Market Analysis
Ethereum Price Rally Overheats Below $2,550 Resistance
August 26, 2026

Market Analysis
Hyperliquid Price Rally: HYPE Targets $97 Amid $80 Support
August 25, 2026