Category:
Market AnalysisBitcoin Price Falls to $64,300 After $65K Rejection

Bitcoin's recent price action has left traders questioning whether the leading cryptocurrency can maintain its current support levels. 📉 After a promising rally toward the $65,000 mark, BTC encountered significant selling pressure and retreated to approximately $64,300, signaling renewed uncertainty in the market.
Understanding the Current Bitcoin Price Dynamics 🎯
The cryptocurrency market witnessed a familiar pattern this week as Bitcoin struggled to establish momentum above the $65,000 resistance level. The digital asset had climbed from the $62,700 support zone earlier in the week, generating optimism among bulls who anticipated a sustained breakout. However, weak spot demand and technical resistance proved too formidable for buyers to overcome.
On August 19, Bitcoin trading on major exchanges like Binance showed the asset hovering around $64,390, representing a modest 0.5% daily decline. The intraday high reached $64,736 before encountering selling pressure that pushed prices lower throughout the session. This pattern reflects the broader struggle between bulls and bears as Bitcoin remains trapped within a constrained trading range.
The Compression Range: Bitcoin's Current Prison 🔐
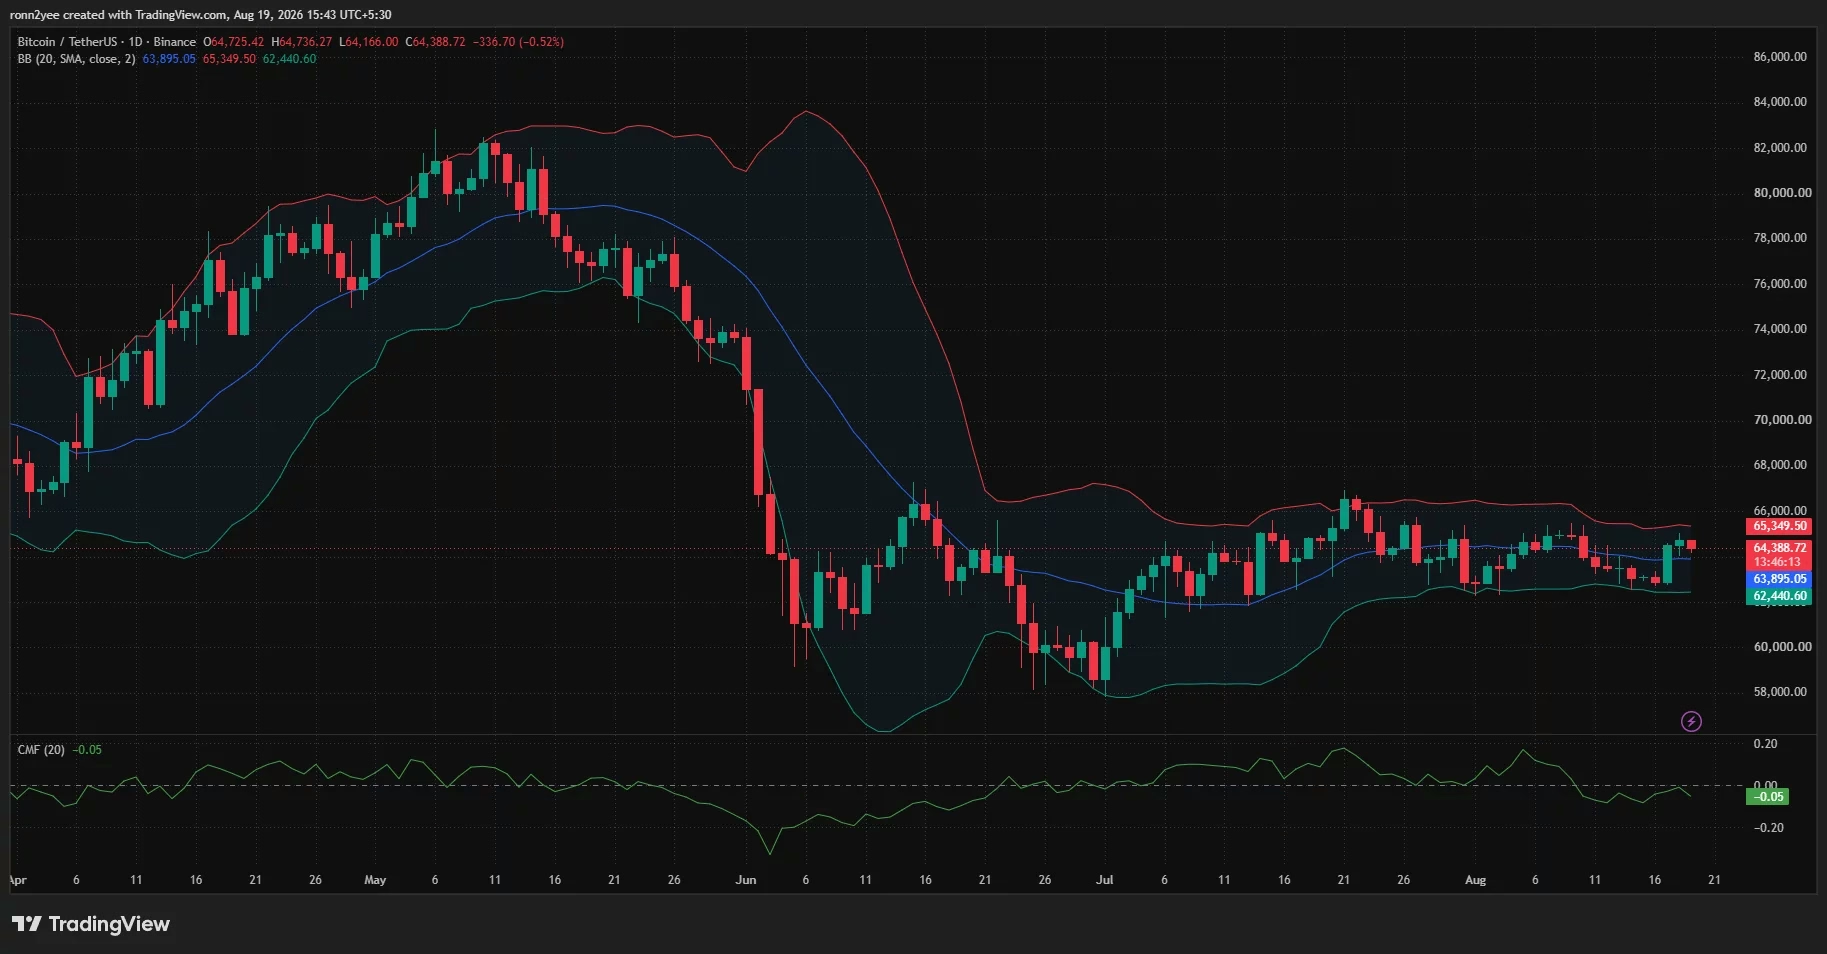
Since late July, Bitcoin has traded predominantly between $62,500 and $65,400, with only brief excursions beyond these boundaries. This narrow trading corridor has created a challenging environment for swing traders and momentum-based strategies. The repeated rejections at the upper boundary suggest that institutional buyers remain hesitant to accumulate at current price levels.
Technical analysts have identified $65,400 as the critical resistance level preventing Bitcoin from establishing higher ground. Meanwhile, the $64,000 level serves as an important intermediate support. Should Bitcoin lose this support, the asset could cascade toward the $62,500 range low, further compressing the already tight consolidation pattern.
The psychological impact of this range compression cannot be understated. When neither buyers nor sellers maintain control at midpoint prices, trading opportunities diminish significantly. This environment typically precedes either a explosive breakout or a breakdown, depending on which side ultimately prevails in the tug-of-war for price direction.
Volume Concerns: The Missing Ingredient for a Breakout 📊
One of the most compelling explanations for Bitcoin's inability to break higher involves the deteriorating spot trading volume on major exchanges. Analyst Gerla's research revealed that Binance spot volume has declined substantially over recent years, even as Bitcoin maintained relatively stable price levels around $64,000.
This development creates a paradox: while some interpret declining volume as potential seller exhaustion, it simultaneously indicates that the recovery lacks meaningful confirmation from buyers entering at higher prices. Without fresh capital flowing into spot markets, sustained rallies become increasingly difficult to achieve.
The shift toward leveraged trading has become particularly pronounced. Recent data showed Bitcoin futures volume on Binance reaching approximately $57.82 billion in a single session, compared to just $6.08 billion in spot trading volume. This creates a futures-to-spot ratio of 7.82, meaning leveraged products account for nearly eight times more activity than actual spot transactions.
This reliance on futures trading introduces a critical vulnerability: leveraged positions are susceptible to rapid liquidations that can amplify price movements in either direction. When liquidation cascades occur, they often trigger additional margin calls, creating a domino effect that can overwhelm organic market demand.
Institutional Headwinds and ETF Outflows 💰
Institutional appetite for Bitcoin has also weakened considerably. U.S. spot Bitcoin exchange-traded funds experienced approximately $385.2 million in net withdrawals during the week ending August 14. This marked a significant reversal from the previous five trading sessions, which had recorded $853.5 million in inflows.
These outflows suggest that institutional investors may be taking profits at current levels or awaiting clearer market direction before committing fresh capital. The inconsistency in institutional flows undermines the narrative of steady accumulation and raises questions about conviction among sophisticated market participants.
When combined with declining spot volume and weak retail demand, the reduction in institutional buying pressure creates a perfect storm for price stagnation. All three major buyer categories—retail spot traders, institutional investors, and leveraged speculators—show signs of reduced commitment to higher prices.
Technical Support and Resistance Levels: A Roadmap 🗺️
Bollinger Bands provide valuable insights into Bitcoin's current technical structure. The daily chart shows Bitcoin trading just above the middle Bollinger Band at $63,895, with the upper band positioned at $65,350—remarkably close to the observed resistance at $65,400. The lower Bollinger Band sits at $62,440, creating a broader support zone between $62,400 and $62,700.
Key resistance levels:
- $65,350–$65,400: Primary resistance capping recent rallies
- $66,000: Secondary resistance with notable liquidation clusters
- $67,000: Late-July swing area representing extended resistance
Key support levels:
- $64,000: Important intermediate support
- $63,900: Near-term support identified by technical analysis
- $62,700–$62,400: Broader support zone
- $61,000: Extended support with June/July lows near $58,000
The Chaikin Money Flow indicator registered minus 0.05 on the daily chart, indicating that capital flows remain slightly negative despite Bitcoin's rebound from lower levels. This reading suggests limited evidence of sustained accumulation, further supporting the bearish case for near-term price action.
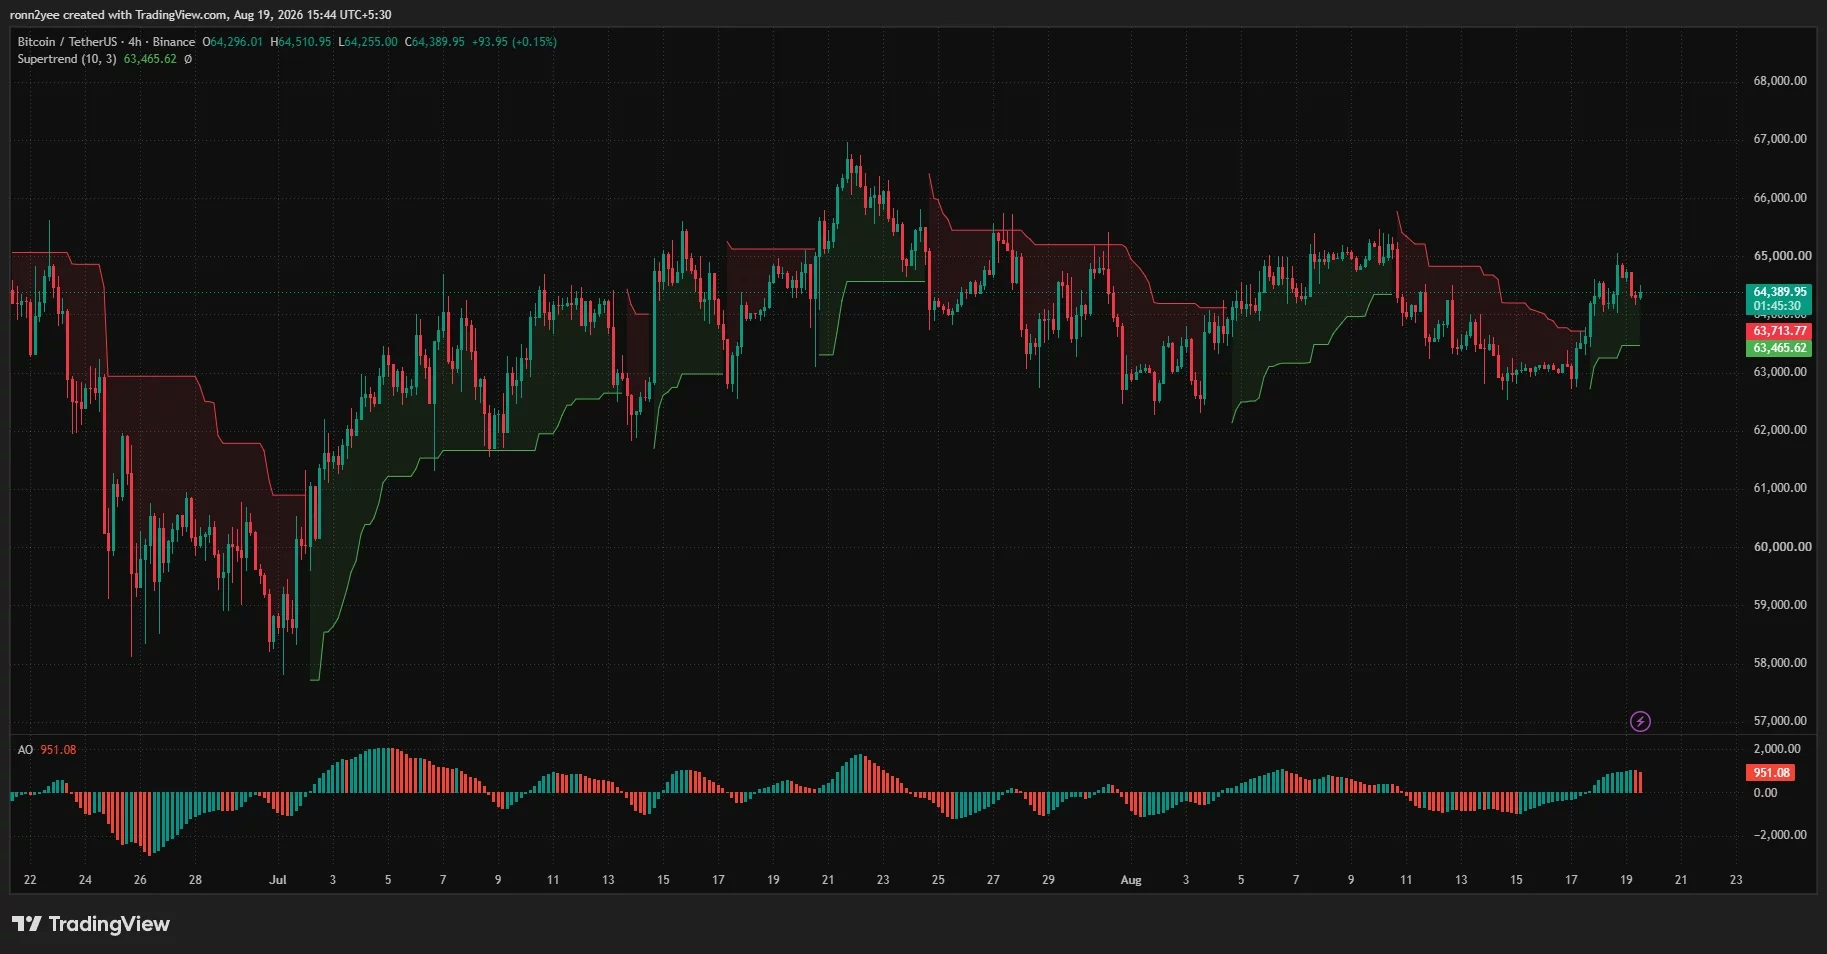
On the 4-hour timeframe, Bitcoin maintains support above the Supertrend level at $63,466, while the Awesome Oscillator reads positive at 951. However, recent red bars on the Awesome Oscillator signal that bullish momentum is decelerating following the advance from $62,700. Buyers must defend the $63,450–$64,000 region to preserve the short-term recovery.
Liquidation Heatmaps: Where Leverage Could Trigger Moves 🔥
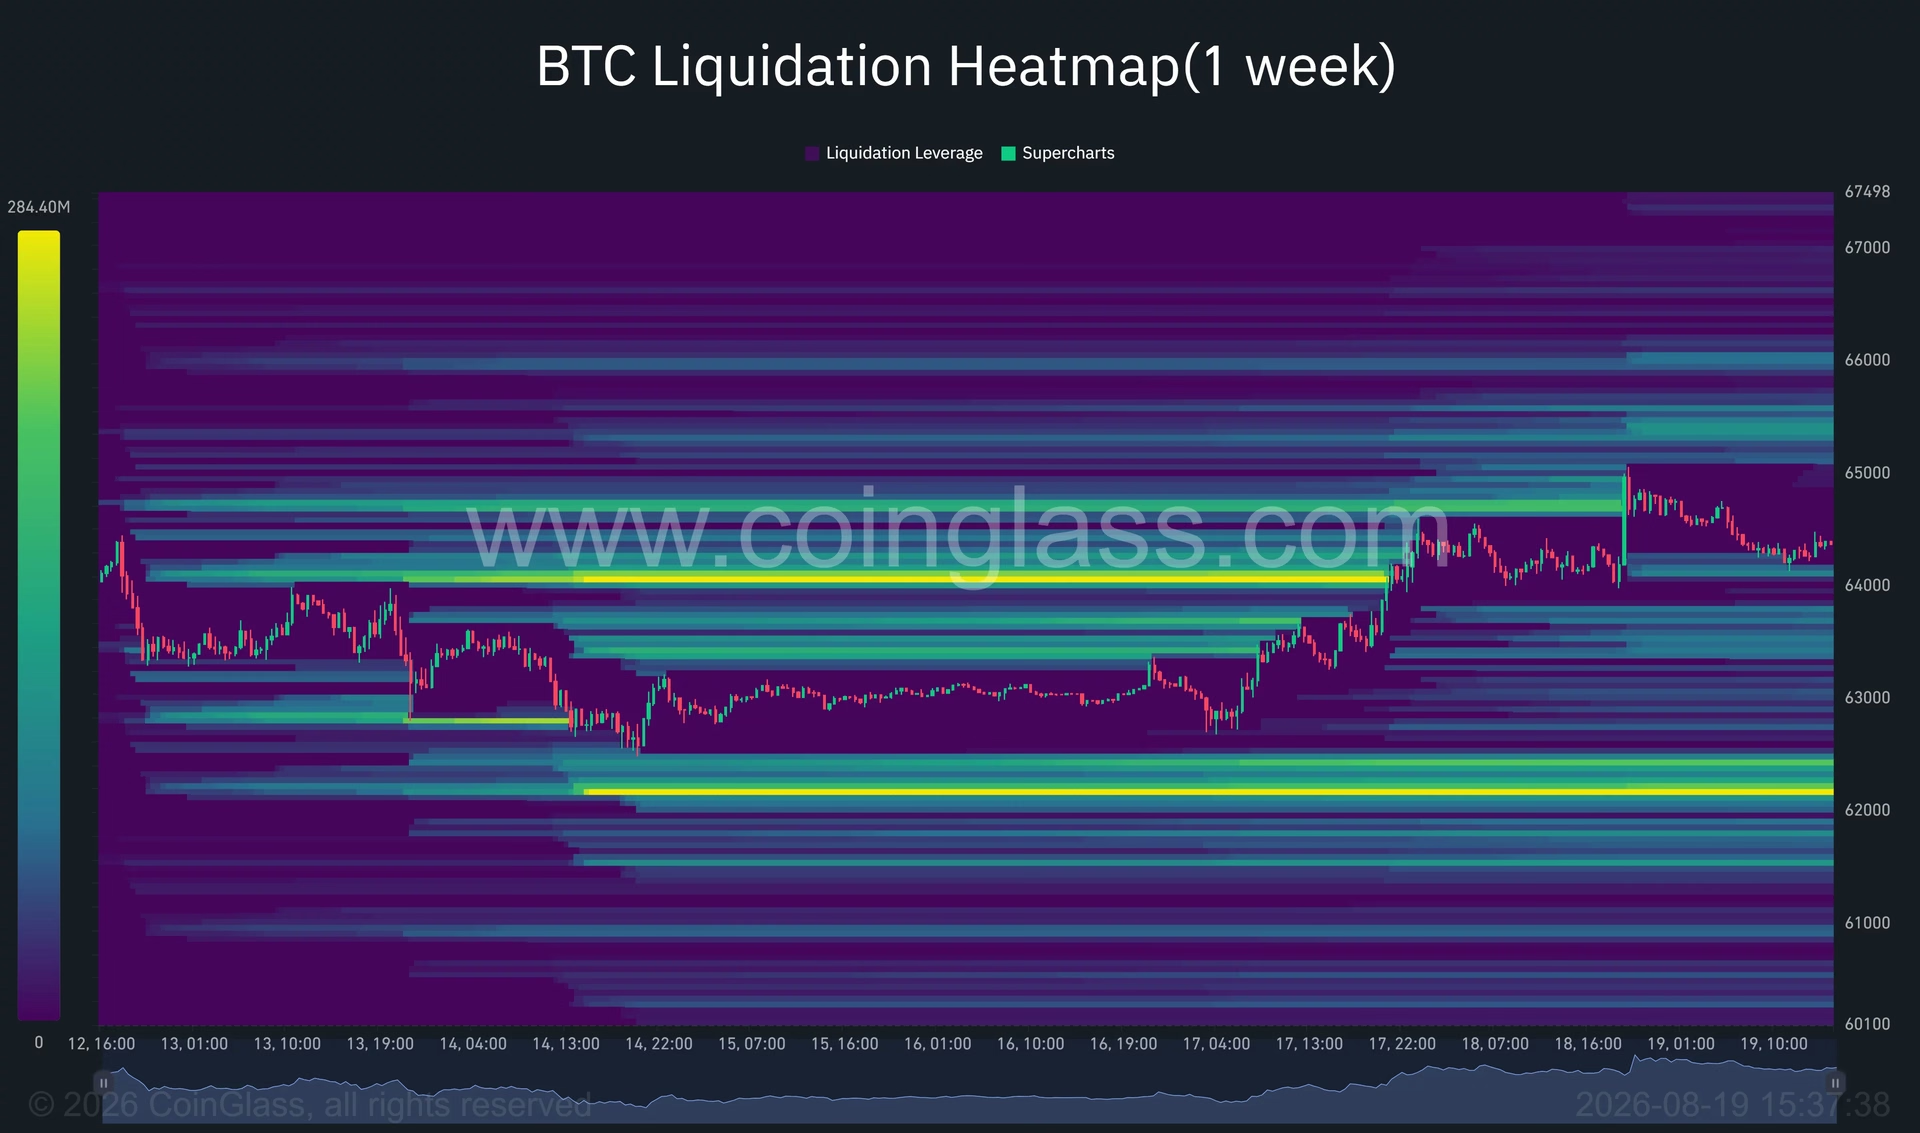
CoinGlass' one-week liquidation heatmap reveals critical information about where leveraged traders have concentrated their positions. The most significant overhead liquidity cluster sits between approximately $65,300 and $65,600, with another substantial concentration around $66,000.
Should Bitcoin overcome the $65,400 resistance and push through this liquidation zone, short liquidations could trigger a cascading move toward the $66,000 cluster. Conversely, the strongest nearby downside liquidation concentration sits around $62,200, with additional leveraged positions between $63,400 and $64,000.
These liquidation levels represent potential price acceleration points but should not be viewed as predetermined destinations. The presence of large liquidation clusters on both sides of the market supports the characterization of Bitcoin as compressed between two powerful forces. The eventual breakout direction will likely be determined by whichever side can overcome the liquidation barrier first.
Macroeconomic Headwinds Weighing on Risk Assets 📈
Bitcoin's retreat occurred alongside a broader pullback in U.S. risk assets, driven by rising global bond yields and Middle East tensions. The U.S. 10-year Treasury yield stabilized around 4.686% after the previous session's global bond selloff, while Brent crude remained above $91 per barrel amid renewed U.S.-Iran tensions.
These macroeconomic factors create a challenging environment for risk-on assets like Bitcoin. Rising bond yields increase the opportunity cost of holding non-yielding assets, while geopolitical tensions can trigger flight-to-safety rotations. The combination pressures speculative positioning and encourages profit-taking at resistance levels.
What's Next: The Fed Minutes Catalyst 📢
U.S. investors are now focused on the Federal Reserve's July meeting minutes, which could provide crucial signals about future interest-rate policy. The Fed's stance on monetary tightening or easing will significantly influence Bitcoin's near-term trajectory, as interest rates directly affect the attractiveness of alternative investments.
If the Fed signals continued hawkish positioning, Bitcoin could face additional headwinds as investors rotate toward fixed-income assets offering improved yields. Conversely, dovish signals could reignite risk appetite and support a breakout above current resistance levels.
Key Takeaways and What Traders Should Monitor 🎬
Critical price levels to watch:
- Bullish scenario: Break above $65,400 with volume confirmation could target $66,000 and $67,000
- Bearish scenario: Loss of $64,000 support could cascade toward $62,500 and eventually $61,000
- Neutral scenario: Continued consolidation between $62,500 and $65,400 maintaining current compression
Factors that could shift momentum:
- Improvement in spot trading volume confirming buyer interest
- Changes in institutional ETF flows
- Federal Reserve policy signals
- Resolution of geopolitical tensions
- Liquidation cascades at key technical levels
Bitcoin's current position represents a critical juncture. The repeated rejection at $65,000 combined with weak spot demand and reduced institutional buying pressure suggests that bulls lack sufficient conviction to drive prices higher. However, the presence of substantial liquidation clusters below current prices indicates that bears must also overcome significant obstacles to push Bitcoin substantially lower.
The cryptocurrency market remains in a state of equilibrium, waiting for a catalyst powerful enough to tip the scales decisively in one direction. Traders should maintain disciplined risk management and wait for either clear technical breakouts or confirmatory volume before committing significant capital. The next major move in Bitcoin is likely to be dramatic when it finally arrives, making proper preparation essential for all market participants. ✨
You May Also Like

Market Analysis
XRP Price Falls 5% as Leverage Hits Seven-Month High
August 26, 2026

Market Analysis
Crypto Market Hits Extreme Greed: What This Means for Bitcoin
August 26, 2026

Market Analysis
Ethereum Price Rally Overheats Below $2,550 Resistance
August 26, 2026

Market Analysis
Hyperliquid Price Rally: HYPE Targets $97 Amid $80 Support
August 25, 2026