Category:
Market AnalysisBitcoin Price Slips Below $63K: Whale's $125M Short

Bitcoin Faces Downward Pressure in Latest Market Decline 📉
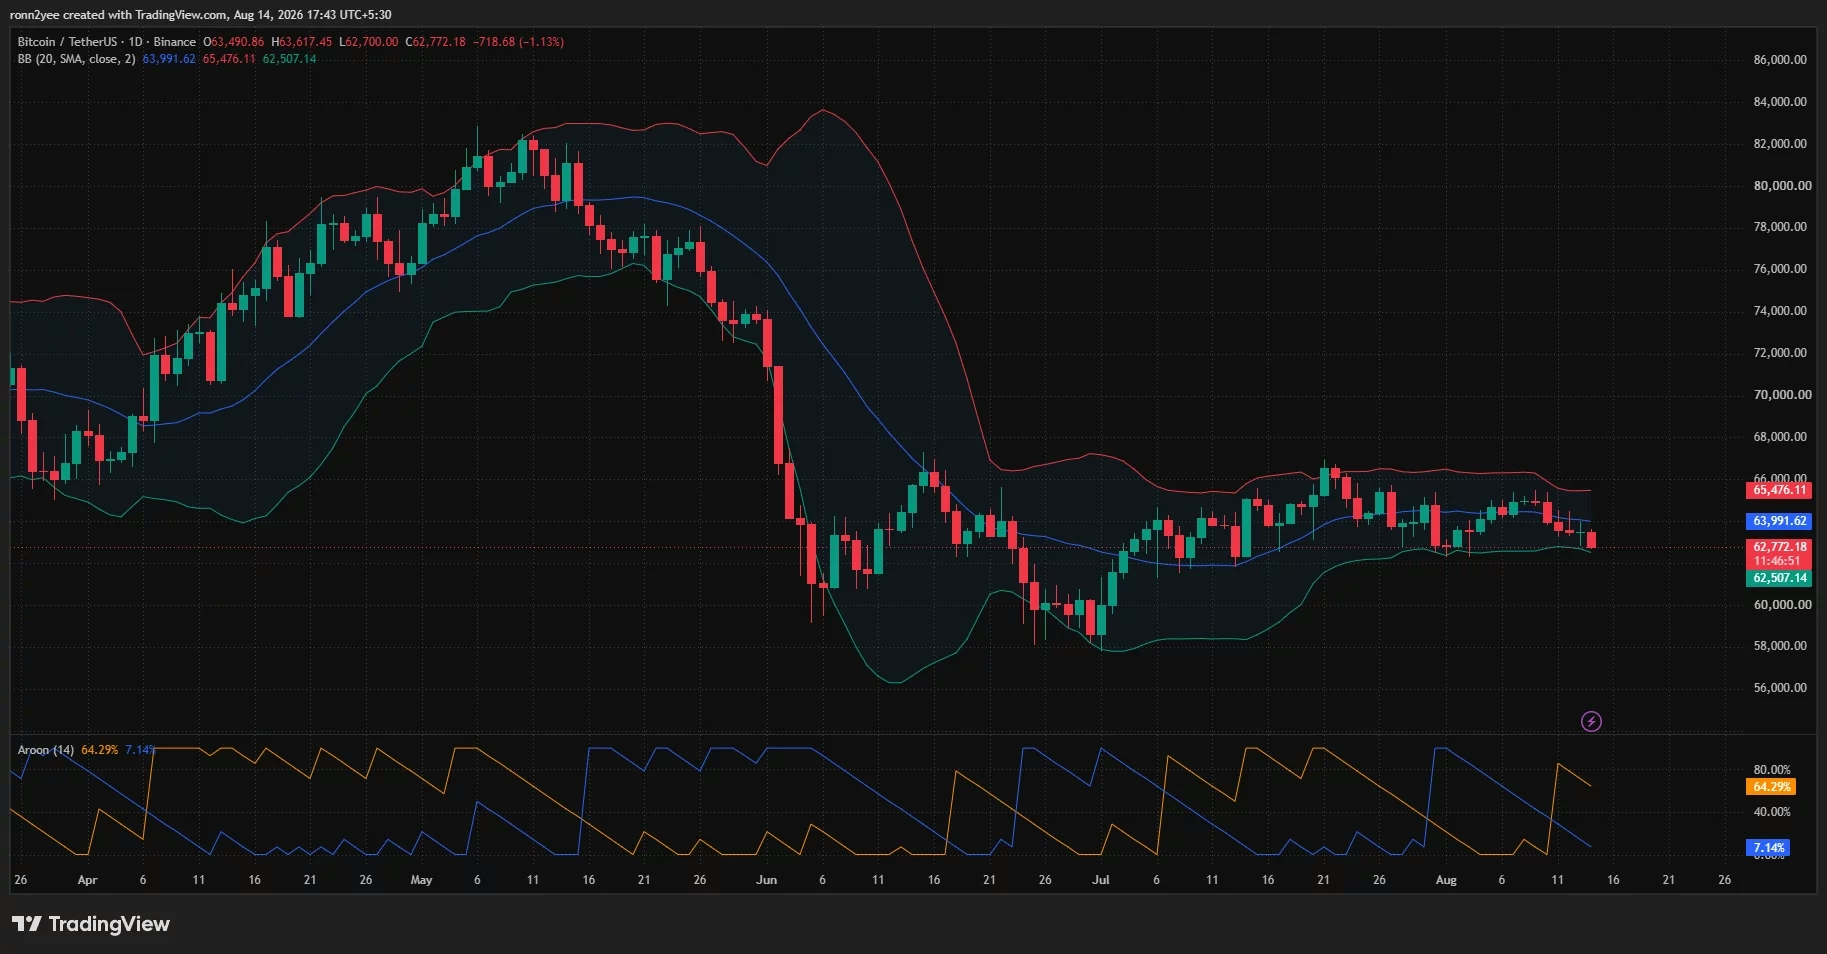
The cryptocurrency market experienced significant turbulence as Bitcoin price dipped below the critical $63,000 threshold, marking a concerning shift in market sentiment. The digital asset traded near $62,772, representing a 1.13% decline from the daily opening price of $63,491. This pullback reflects a confluence of bearish factors that have compressed Bitcoin into an increasingly tight trading range, raising questions about the asset's near-term direction.
The decline from an intraday high of $63,895 to lows near $62,667 represents approximately a 2% drop within a single trading session. This move breached the psychological $63,000 level and positioned Bitcoin dangerously close to its lower daily Bollinger Band at $62,507—a technical level that typically attracts institutional buyers but can also accelerate selling if breached.
The Whale's Strategic Short Position 🐋
One of the most significant catalysts for Bitcoin's weakness emerged from on-chain activity tracking. A major trader—colloquially known as a "whale" in cryptocurrency circles—accumulated a substantial short position totaling 1,900 Bitcoin, valued at approximately $125 million. This trader added 258 BTC to an existing short position, bringing the average entry price to $63,582 and generating unrealized profits of roughly $1.79 million at the time of reporting.
While this single position didn't single-handedly cause the entire market decline, it significantly amplified bearish derivatives exposure during a period when Bitcoin was already losing short-term support. The strategic placement of this short at a critical resistance level suggests sophisticated trading activity designed to capitalize on technical weakness.
Key aspects of the whale's position:
- Position Size: 1,900 BTC ($125 million notional value)
- Average Entry: $63,582
- Unrealized Profit: ~$1.79 million
- Strategic Timing: Positioned during technical breakdown
The significance of this whale activity extends beyond simple speculation. Large short positions can trigger cascading liquidations among retail traders using leverage, amplifying downward price action and creating self-reinforcing selling pressure.
Technical Breakdown Signals Seller Dominance 📊
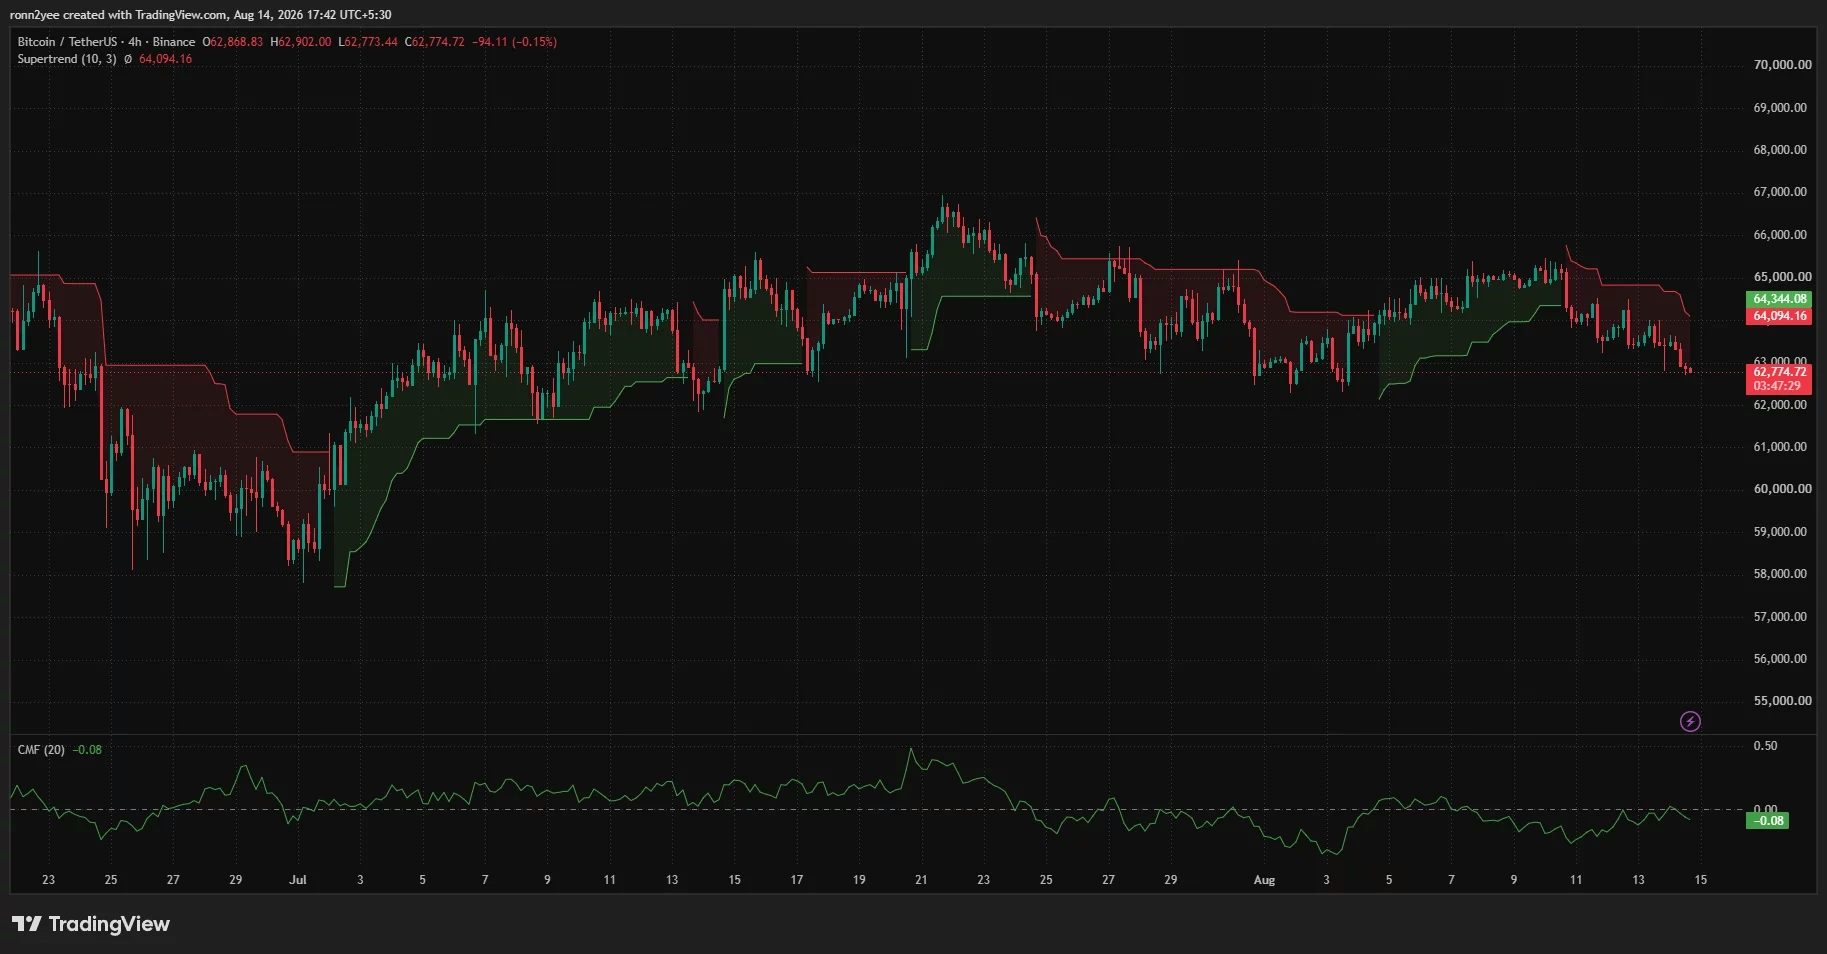
Multiple technical indicators confirmed that sellers maintained the upper hand in Bitcoin's price action. The 4-hour Supertrend indicator, which has functioned as resistance since August 10, remained bearish with Bitcoin trading below the $64,094 level. This breakdown of a key technical indicator often precedes further downside movement as momentum traders exit long positions.
The Chaikin Money Flow (CMF) indicator painted an equally bearish picture, standing at -0.08 on the 4-hour timeframe. Readings below zero indicate that selling volume has substantially outweighed buying volume across the indicator's 20-period window, confirming the weakness reflected in price action.
Aroon indicators further reinforced bearish momentum, with Aroon Down at 64.29% compared to Aroon Up at just 7.14%. This extreme imbalance demonstrates that recent price lows carry far more weight than any recent highs, suggesting that downtrend momentum has gained considerable strength.
Weakening Institutional Demand Removes Buying Support 💼
Beyond speculative trading dynamics, institutional demand for Bitcoin has noticeably softened. U.S. spot Bitcoin exchange-traded funds (ETFs) recorded two consecutive sessions of net withdrawals totaling $192 million. This outflow represents a significant shift from the ETF enthusiasm that characterized earlier portions of 2024 and 2025.
The reduction in ETF demand is particularly concerning because these products represent one of the most reliable sources of institutional capital absorption during volatile market periods. When ETF flows turn negative, it removes a critical bid under the market and can accelerate declines.
Contributing to this weakness, Strategy Holdings—a prominent Bitcoin treasury company—sold 1,690 BTC for nearly $109 million to repurchase preferred stock. This marked the company's fourth Bitcoin disposal since June, signaling that even companies traditionally bullish on Bitcoin are rotating capital allocation. The sale followed seven weeks without any treasury additions, suggesting a more cautious stance toward Bitcoin accumulation.
Macroeconomic Headwinds Pressure Risk Assets 🌍
Bitcoin's weakness occurred within a broader context of elevated macroeconomic uncertainty. Brent crude oil traded above $87 per barrel, driven by geopolitical tensions around Iran and the Strait of Hormuz. Energy price volatility typically increases risk aversion across financial markets, including cryptocurrency assets.
More significantly, the 10-year U.S. Treasury yield remained elevated near 4.66%. Higher Treasury yields create a powerful headwind for Bitcoin and other speculative assets because government bonds now offer meaningful yield without the volatility associated with cryptocurrency exposure. This dynamic has historically compressed Bitcoin valuations during periods of rising rates.
While softer U.S. wholesale inflation data provided some support—with July's headline Producer Price Index unchanged and core PPI rising just 0.2%—this positive data failed to generate meaningful Bitcoin buying. The asset's underperformance relative to U.S. equities during this period indicated that crypto-specific selling pressures and weak market liquidity overwhelmed the inflation benefits.
Critical Support Levels and Liquidation Zones 🎯
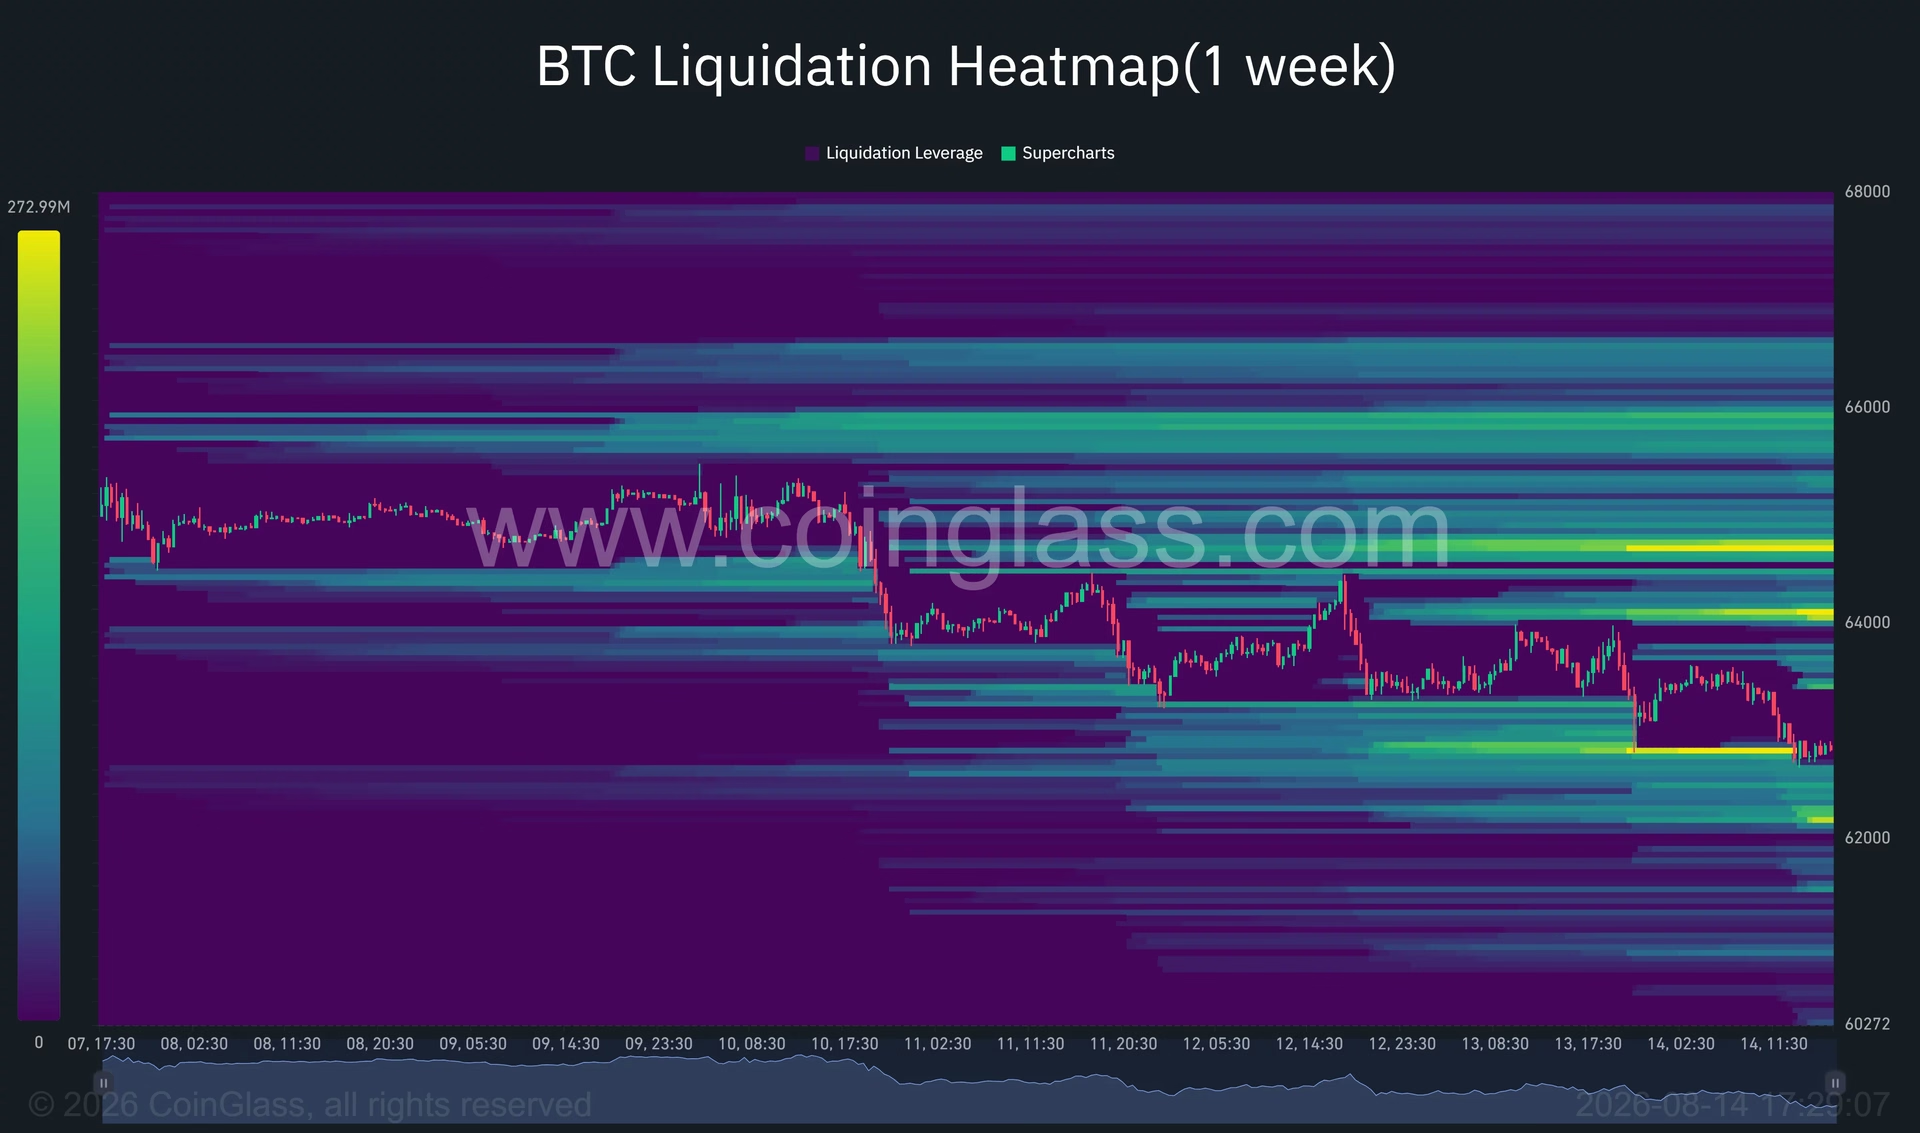
The liquidation landscape reveals important information about where market participants have concentrated their leveraged positions. Immediate support for Bitcoin sits between $62,500 and $62,700, combining the daily lower Bollinger Band with the latest intraday low. A decisive close below this region would shift focus to $62,200–$62,300, followed by the round-number support at $62,000.
The one-week CoinGlass liquidation heatmap identified a significant concentration of leveraged long positions around $62,200. A decline into this zone could trigger a cascade of forced liquidations, though paradoxically, these same liquidity zones often attract aggressive buyers after positions are cleared.
Support and resistance framework:
- Immediate Support: $62,500–$62,700
- Secondary Support: $62,200–$62,300
- Tertiary Support: $62,000 (psychological level)
- Deep Support: $61,500–$60,300
- Immediate Resistance: $63,500–$64,100
- Secondary Resistance: $64,500–$64,700
- Upper Resistance: $65,700–$66,000
Below $62,000, the next visible liquidity band appears near $61,500, which also sits close to the bottom of the wider trading range that formed following Bitcoin's sharp decline in early June. This lower zone represents a potential capitulation level where long-term buyers might accumulate.
The Consolidation Range Tightens 📍
Since early July, Bitcoin has remained trapped within a relatively narrow trading corridor, with buyers consistently defending levels near $62,000 and sellers capping rallies between $65,000 and $66,000. The latest decline represented another rejection from the upper portion of this range, extending a series of lower highs visible since the July 21 peak near $66,700.
This consolidation pattern suggests that market participants are fundamentally divided about Bitcoin's direction. The narrowing range combined with declining volume typically precedes a significant directional move, though the direction remains uncertain.
The daily Bollinger Band midpoint now sits at $63,992. Trading below this level places the immediate technical advantage with sellers, while the upper band at $65,476 defines the next major resistance area if buyers successfully initiate a recovery.
What Recovery Would Require 🔄
For Bitcoin to reverse course and establish a new uptrend, bulls must first reclaim the $63,500–$64,100 range. This critical zone encompasses the whale's average short entry price, the daily Bollinger Band midpoint, and the 4-hour Supertrend resistance level. A sustained break above $64,100 could expose the large short position to losses, potentially triggering a short squeeze that pulls Bitcoin toward liquidation clusters at $64,500–$64,700.
If buyers can overcome this intermediate resistance, additional liquidity appears near $65,700–$66,000, proximate to the upper daily Bollinger Band and several previous August highs. A move into this zone would signal a fundamental shift in market structure.
Analyst Perspectives on Near-Term Direction 🔮
Crypto analyst Gerla identified Bitcoin as compressed within a multi-week triangle pattern formed by lower highs and a rising support line. According to this analysis, recovering $63,500–$64,000 would bring $65,000 back into play, while losing the lower trendline could send Bitcoin toward $61,500.
Gerla leaned toward a downside break of the triangle because the trading range was simultaneously tightening while volume declined—a combination that often precedes breakdowns rather than breakouts. This perspective reflects broader sentiment among technical analysts who view the current consolidation as potentially unsustainable.
Key Takeaways and Market Outlook 🎬
Bitcoin's slip below $63,000 represents more than a simple technical breakdown; it reflects a complex interplay of bearish factors including whale short positioning, deteriorating institutional demand, macroeconomic headwinds, and technical weakness. The $125 million short position adds a speculative dimension that could amplify volatility in either direction.
Market participants should monitor the $62,200–$62,500 support zone closely, as a break below this level could accelerate selling toward $61,500 and beyond. Conversely, a successful defense and recovery above $64,100 could trigger a short squeeze and meaningful relief rally.
The current environment underscores the importance of risk management and position sizing in cryptocurrency markets. With liquidation zones clearly defined and whale activity visible on-chain, traders and investors have unprecedented transparency into the leverage landscape—information that can inform more prudent decision-making.
The coming days will likely prove decisive for Bitcoin's near-term trajectory. Whether the asset finds support at critical levels or breaks lower will provide crucial signals about market sentiment heading into the remainder of 2026. ✨
You May Also Like

Market Analysis
XRP Price Falls 5% as Leverage Hits Seven-Month High
August 26, 2026

Market Analysis
Crypto Market Hits Extreme Greed: What This Means for Bitcoin
August 26, 2026

Market Analysis
Ethereum Price Rally Overheats Below $2,550 Resistance
August 26, 2026

Market Analysis
Hyperliquid Price Rally: HYPE Targets $97 Amid $80 Support
August 25, 2026