Category:
Market AnalysisBitcoin Price Stalls Below $65K Despite ETF Inflows

Bitcoin's recent price action tells a fascinating story of institutional support meeting market resistance. 📊 As of early August, the world's largest cryptocurrency hovered near $64,206, representing a modest 0.5% decline over 24 hours. While this sideways movement might seem unremarkable on the surface, the underlying dynamics reveal a market in transition—one supported by substantial institutional capital yet constrained by formidable technical barriers.
The cryptocurrency landscape has undergone a dramatic transformation since the introduction of spot Bitcoin ETFs. These financial instruments have fundamentally altered how traditional investors access digital assets, and their recent performance offers crucial insights into where institutional money is flowing. Understanding these dynamics is essential for anyone seeking to comprehend Bitcoin's current market positioning.
💰 ETF Inflows: The Institutional Backbone
U.S. spot Bitcoin ETFs have emerged as a powerful force in the market, attracting consistent capital flows even as price momentum stalls. On August 6 alone, these investment vehicles recorded $137.6 million in net inflows—a figure that underscores sustained institutional interest despite the absence of aggressive price appreciation.
What makes this particularly noteworthy is the four-consecutive-session inflow streak that preceded this data point. The cumulative effect proves substantial: August 3 through August 6 witnessed approximately $763.6 million flowing into these products. To contextualize this magnitude, consider that this represents a significant commitment of capital from institutional investors who have traditionally viewed cryptocurrency with skepticism.
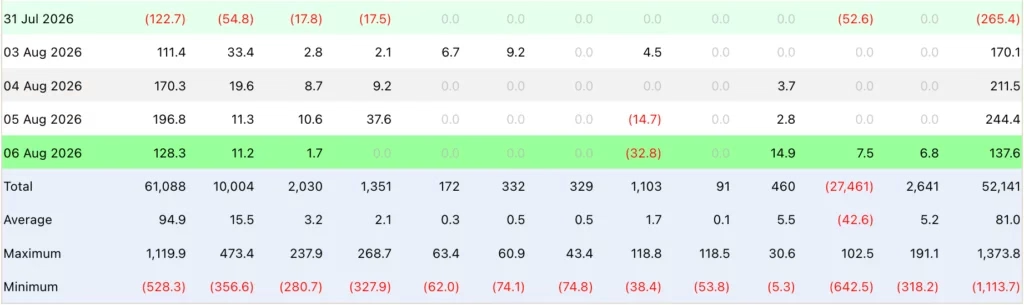
BlackRock's IBIT fund led Thursday's inflows with an impressive $128.3 million contribution, while Fidelity's FBTC added another $11.2 million. These flows from the world's largest asset manager and a major financial services provider demonstrate that institutional adoption continues accelerating. Interestingly, VanEck's HODL recorded $32.8 million in outflows during the same period, suggesting that while overall demand remains positive, some investors are rotating positions.
The ETF Paradox: Demand Without Price Breakout
One of the most intriguing aspects of the current market dynamic is what might be called the "ETF paradox." 🤔 Substantial institutional buying pressure through these vehicles hasn't translated into a decisive price breakout. This phenomenon deserves careful analysis, as it challenges simplistic narratives about supply and demand mechanics.
The explanation lies in market complexity. When institutional investors purchase Bitcoin through ETFs, they're simultaneously creating supply pressure as other holders sell into this demand. The market has essentially reached an equilibrium where institutional accumulation is being offset by profit-taking or rebalancing from other market participants. This creates a supportive price floor without providing the momentum needed for significant upside movement.
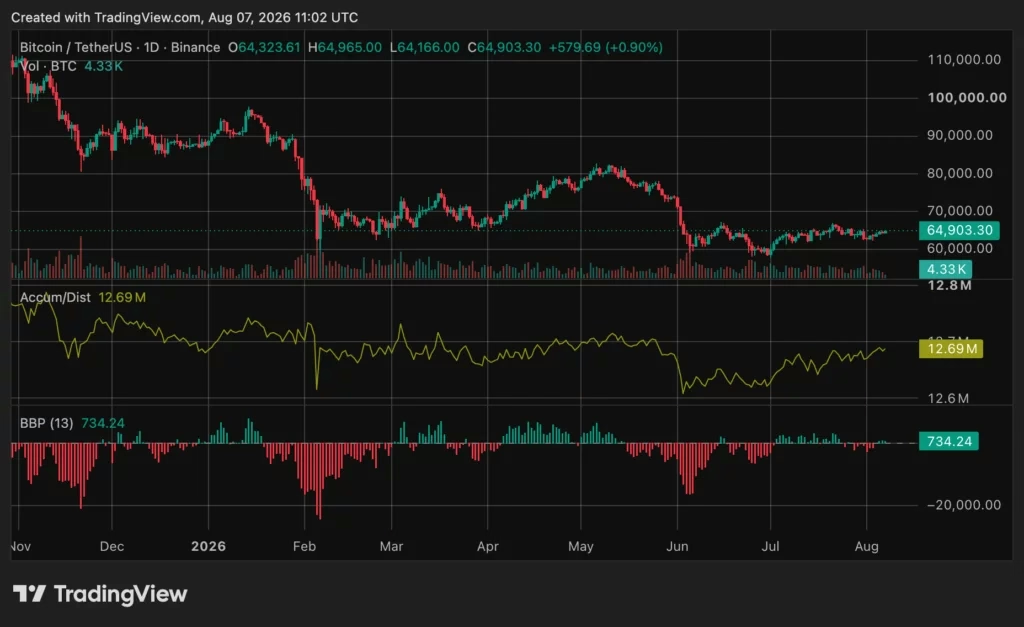
Analysts tracking this behavior have noted that Bitcoin's trading range has compressed significantly. The asset has largely oscillated between $62,000 and $65,000, with multiple failed attempts to reclaim resistance above $66,000. This range-bound behavior is characteristic of accumulation phases, where buyers and sellers remain relatively balanced.
📈 Technical Landscape: Range-Bound and Waiting
Bitcoin's technical structure reveals important clues about market sentiment and positioning. The cryptocurrency has traded between $64,114 and $64,916 recently, demonstrating the tight compression that currently characterizes price action. While this stability might appear boring compared to Bitcoin's historical volatility, it actually represents a critical juncture for the asset's medium-term trajectory.
Technical analysts monitoring the situation have identified key resistance levels that would signal meaningful trend changes. A sustained move above $67,000 would mark a significant threshold, suggesting that buyers have successfully overcome a major technical hurdle. Beyond that, the $69,000 to $72,000 range contains multiple higher-timeframe resistance levels that would need to be cleared for a more convincing bull case to develop.
The derivatives market provides additional context for understanding positioning. Bitcoin's open interest—the total value of outstanding futures contracts—has been gradually rebuilding across major exchanges. On Binance, open interest reached approximately $3.9 billion, while Bybit stood near $2.14 billion and Gate.io around $2.09 billion. However, the combined open interest across these exchanges totaled roughly $8.86 billion, representing only 54% of the $19.21 billion recorded near Bitcoin's October 2025 price peak.
This discrepancy is significant. 🔍 It indicates that leverage is returning gradually rather than approaching the crowded conditions that often precede market corrections. From a contrarian perspective, this suggests that excessive leverage hasn't created an unstable foundation for prices—a healthy sign for market stability.
Longer-Term Technical Signals
When examining Bitcoin's longer-term technical picture, several indicators warrant attention. The TD Sequential indicator on the monthly chart has generated a buy signal, while Bitcoin's proximity to its 50-month simple moving average and a Chande Momentum Oscillator reading near negative 71 all suggest potential reversal conditions. These technical interpretations shouldn't be interpreted as confirmation of a new bull market, but rather as signals that conditions may be shifting.
On the daily timeframe, Bitcoin remains within a broader downtrend but has successfully stabilized above the $60,000 to $62,000 support zone. Accumulation and Distribution indicators have recovered since late June, while Bull Bear Power readings are slightly positive. These improvements suggest that selling pressure is gradually diminishing, even if buying pressure hasn't yet overwhelmed resistance.
🏛️ Regulatory Uncertainty: The CLARITY Act Delay
Political developments have introduced additional complexity into Bitcoin's near-term outlook. The Senate delayed its vote on the CLARITY Act—legislation designed to establish a federal digital asset market structure and clarify regulatory responsibilities between the SEC and CFTC—until September. This postponement removed what many market participants had anticipated as an August policy catalyst.
The CLARITY Act's importance extends beyond mere procedural details. The legislation would fundamentally reshape how digital assets are regulated in the United States, potentially reducing the ambiguity that has characterized the regulatory environment. For Bitcoin specifically, such clarity could either accelerate institutional adoption or introduce new compliance requirements depending on how the legislation is ultimately structured.
However, it's crucial to recognize that regulatory developments rarely move markets in isolation. The delay doesn't change Bitcoin's legal status, and market reactions must be understood within the context of simultaneous factors: ETF flows, interest-rate expectations, positioning dynamics, and broader risk appetite all influence price simultaneously. Attributing price movements to any single factor represents an oversimplification of market mechanics.
💹 Monetary Policy: The Inflation and Employment Test
The Federal Reserve's recent decision to maintain its target rate at 3.50% to 3.75% set the stage for the next critical market tests. The July employment report, released on August 7, and the July Consumer Price Index (CPI), arriving on August 12, will provide crucial data that could reshape expectations for future monetary policy.
Stronger-than-expected employment or persistent inflation could reinforce market expectations for tighter monetary policy, creating headwinds for risk assets including Bitcoin. Conversely, softer employment data or declining inflation could reduce pressure on risk assets and potentially support cryptocurrency prices. These economic releases represent pivotal moments when market narratives can shift rapidly based on new information.
Bitcoin's relationship with monetary policy has evolved considerably since the asset's creation. In the current environment, Bitcoin functions partially as an inflation hedge and partially as a risk asset. This dual nature means that Fed policy decisions reverberate through the cryptocurrency market with significant force, affecting not just Bitcoin but the entire digital asset ecosystem.
🎯 What Comes Next: Key Levels to Watch
Market participants are increasingly focused on specific price levels that would confirm whether the current stabilization represents the beginning of a more substantial recovery. The $62,000 to $64,000 region has effectively contained recent trading, and holding this zone remains critical for maintaining current stabilization.
The next meaningful test arrives at $67,000. A sustained breakout above this level would suggest that institutional buyers have successfully overcome key technical resistance and that the structure is becoming more constructive. Should Bitcoin clear this hurdle, the next target zone of $69,000 to $72,000 would come into focus, containing several higher-timeframe resistance levels that would need to be conquered for a more convincing bull case.
Conversely, failure to hold the $62,000 support zone would reopen discussion of lower targets and suggest that the current stabilization phase was merely a temporary reprieve rather than the beginning of a sustained recovery.
🔮 The Bigger Picture: Accumulation Phase or Consolidation?
From a broader perspective, Bitcoin's current state might best be described as an accumulation phase with institutional support. 💡 The consistent ETF inflows provide a steady bid beneath the market, while the absence of excessive leverage prevents destabilizing feedback loops. This combination has created conditions favorable for patient capital but challenging for traders seeking immediate price appreciation.
The cryptocurrency market has matured considerably since Bitcoin's early years. The introduction of regulated financial products, institutional participation, and increasing regulatory clarity has transformed Bitcoin from a speculative asset into something approaching a traditional alternative asset class. This evolution comes with both benefits—greater stability and institutional adoption—and drawbacks, including reduced volatility and the influence of macroeconomic factors that previously had minimal impact on cryptocurrency prices.
Looking ahead, several factors will determine Bitcoin's trajectory. Continued ETF inflows could provide ongoing support, while a breakout above key resistance levels would signal that institutional accumulation is transitioning into appreciation. Conversely, regulatory developments, monetary policy shifts, or broader risk-off sentiment could pressure prices lower. The market remains poised between competing dynamics, waiting for new catalysts to shift the balance decisively in one direction or another.
📋 Key Takeaways
- ETF Support: Four consecutive days of institutional inflows totaling $763.6 million demonstrate sustained demand, even without price breakout
- Range-Bound Trading: Bitcoin's compression between $62,000 and $65,000 reflects equilibrium between institutional buying and profit-taking
- Technical Thresholds: $67,000 represents the next critical resistance; sustained breakout would signal trend change confirmation
- Derivatives Positioning: Open interest remains 54% below October peaks, indicating gradual leverage rebuilding rather than crowded conditions
- Regulatory Catalysts: CLARITY Act delay removes August policy event but doesn't change Bitcoin's legal status
- Macroeconomic Sensitivity: Employment and inflation data will likely drive near-term price action as Fed policy expectations remain central
Bitcoin's current positioning reflects a market in transition. Institutional capital continues flowing into regulated vehicles, technical conditions are gradually improving, and leverage remains at manageable levels. Yet the asset remains constrained by technical resistance that has repeatedly prevented decisive upside breakouts. The coming weeks will reveal whether this accumulation phase transitions into appreciation or whether the current range-bound behavior persists. 🚀
You May Also Like

Market Analysis
XRP Price Falls 5% as Leverage Hits Seven-Month High
August 26, 2026

Market Analysis
Crypto Market Hits Extreme Greed: What This Means for Bitcoin
August 26, 2026

Market Analysis
Ethereum Price Rally Overheats Below $2,550 Resistance
August 26, 2026

Market Analysis
Hyperliquid Price Rally: HYPE Targets $97 Amid $80 Support
August 25, 2026