Category:
Market AnalysisBitcoin Price Surge: $65K–$67K Retest Zone Under Scrutiny

Bitcoin has captured market attention with a dramatic rally that pushed prices toward $72,500, marking one of the most significant moves in recent months. 🚀 This surge represents far more than a casual price bump—it signals a fundamental shift in market dynamics as buyers overwhelm bearish positioning and technical barriers crumble beneath sustained buying pressure.
The cryptocurrency landscape has been dominated by uncertainty throughout 2024, but recent price action suggests a turning point may be materializing. Understanding what's driving this momentum and where potential support levels lie will be crucial for traders navigating the volatile weeks ahead.
The Breakout That Changed Everything 📈
Bitcoin's journey from $65,000 to nearly $72,500 represents a textbook breakout scenario that technical analysts have been anticipating for weeks. The asset had been trapped in a compressed range between $63,000 and $65,000 for an extended period, building pressure like a coiled spring waiting for release.
When buyers finally pushed through the $66,000 barrier on August 20, something remarkable happened—the technical floodgates opened. Bitcoin didn't just breach this resistance; it shattered through multiple technical barriers in succession, reclaiming its 200-day simple moving average near $69,010 and its 200-day exponential moving average at virtually the same level.
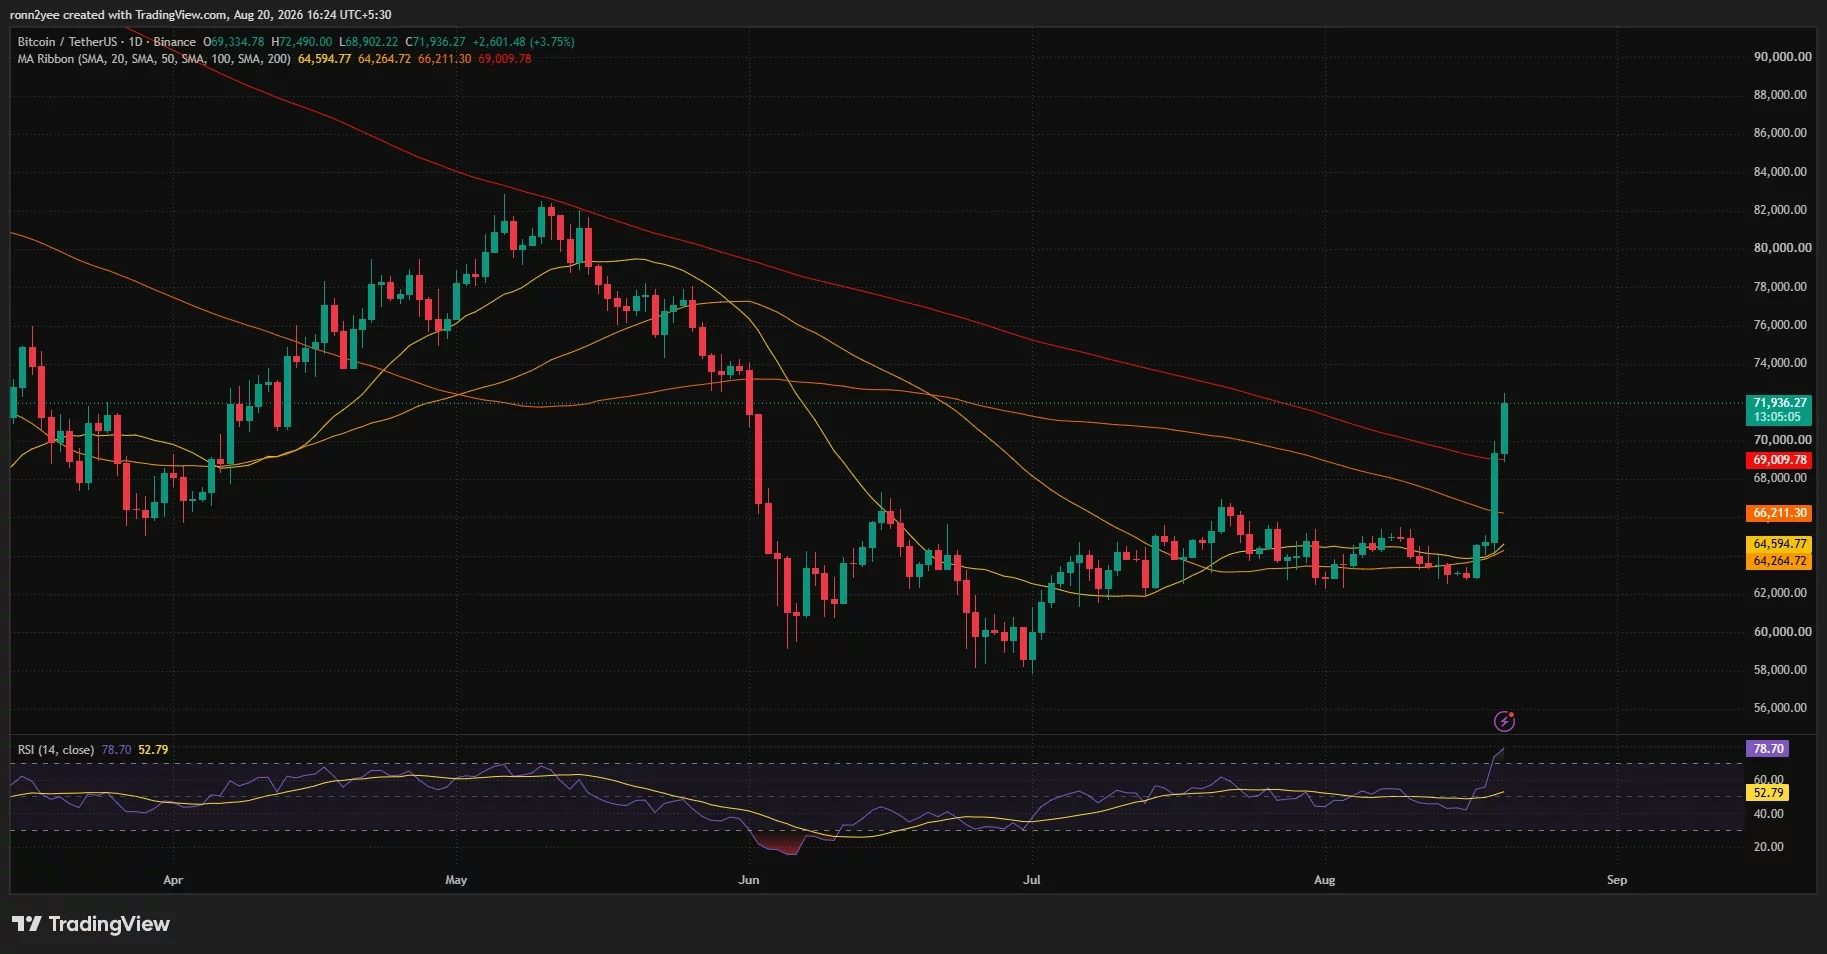
This reclamation of the 200-day moving averages holds profound significance. Bitcoin had remained beneath both trend indicators since its sharp decline in June, making this breakthrough a psychological and technical victory for bulls. The asset hasn't traded above these critical averages in months, and regaining this territory suggests the intermediate-term trend may finally be shifting from bearish to bullish. 💪
Short Liquidations: The Hidden Engine Behind the Rally 🔥
While technical breakouts capture headlines, the real story behind Bitcoin's explosive move lies in the liquidation data. Leveraged traders had positioned themselves heavily for a continued decline, accumulating massive short positions at key resistance levels.
The one-week liquidation heatmap reveals the magnitude of this bearish positioning. Concentrated clusters of short positions existed around $65,000–$66,000, with additional layers between $68,000 and $71,000. When Bitcoin finally broke above $66,000, a cascade of forced liquidations began.
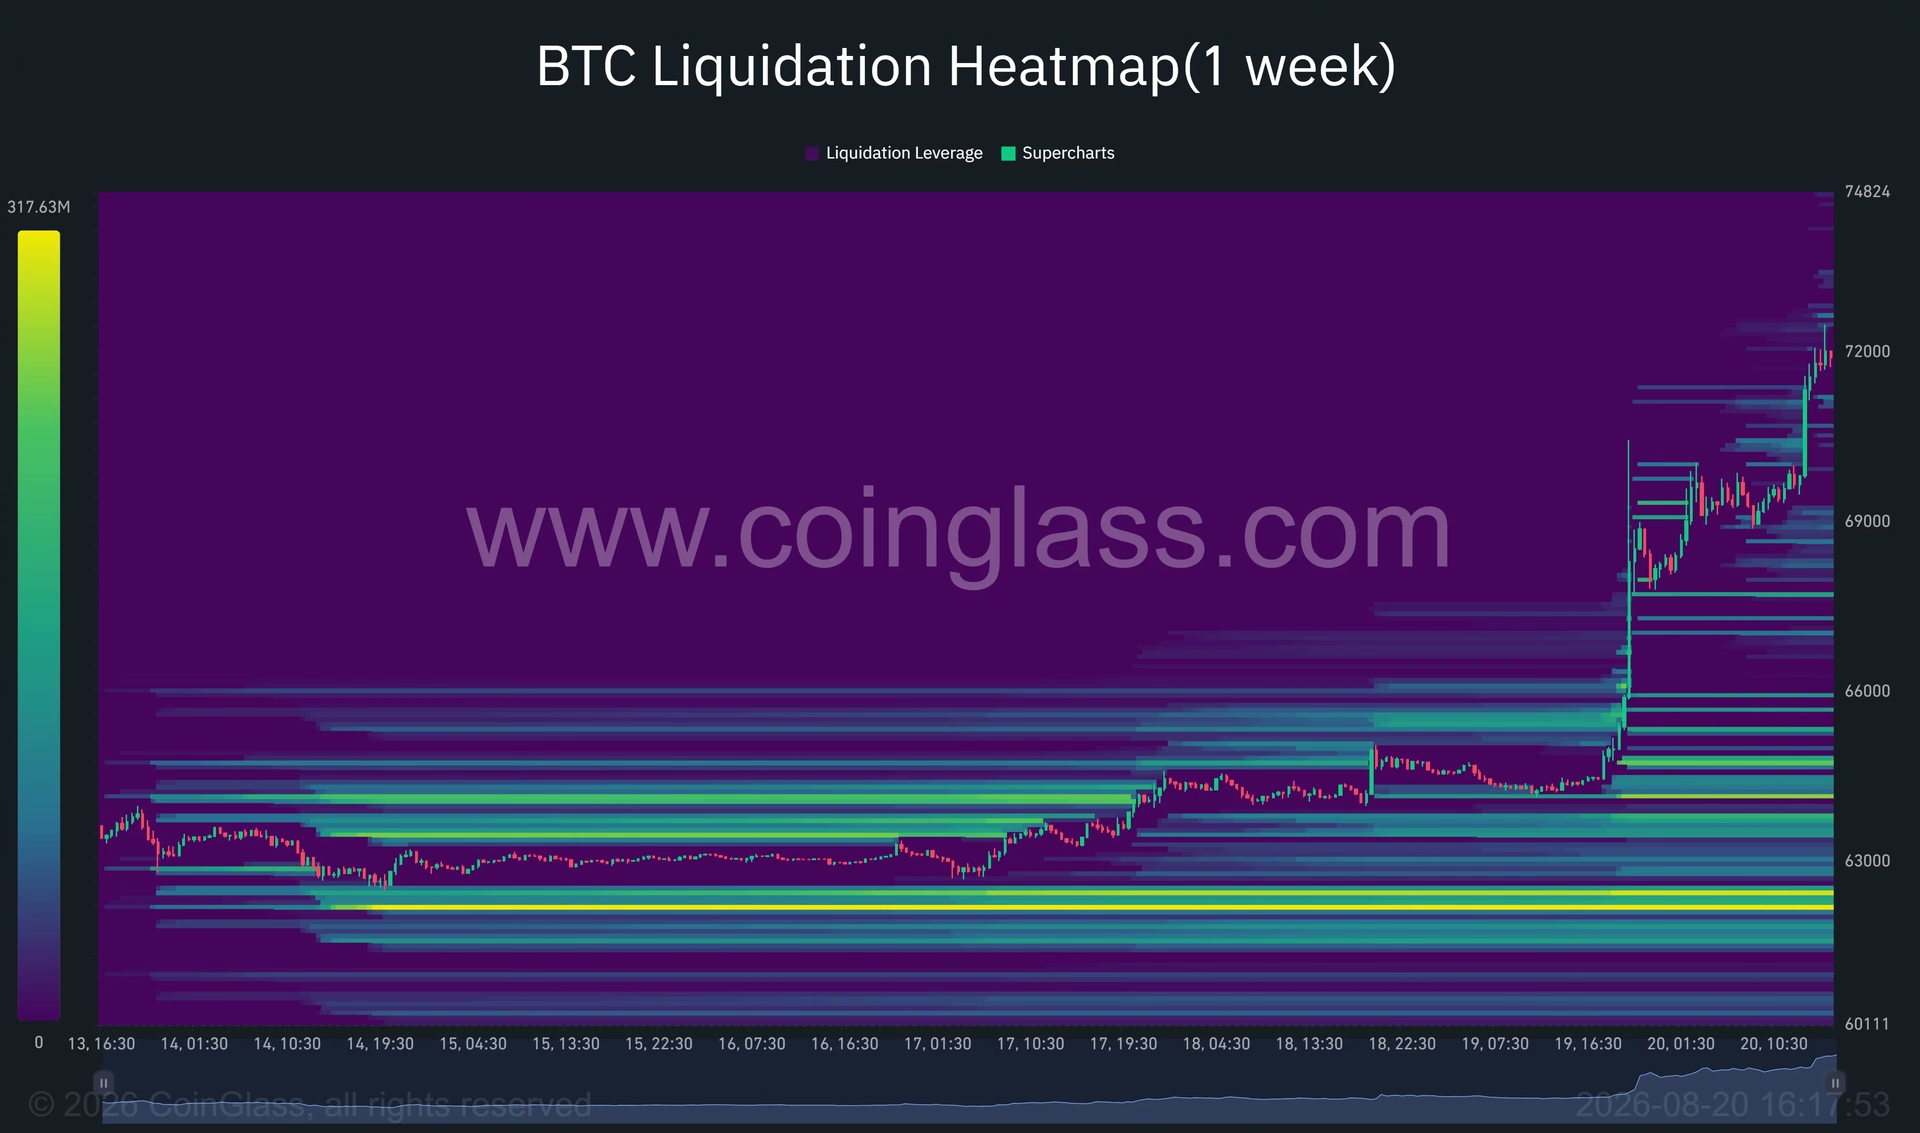
The numbers tell a stunning story: over $1 billion in Bitcoin short liquidations occurred within a single hour, with an additional $2.7 billion in bearish positions closed across the broader cryptocurrency market. This wasn't organic buying pressure alone—it was a short squeeze of epic proportions.
When leveraged traders are forced to close losing positions, exchanges automatically execute buy orders to repurchase Bitcoin, creating a self-reinforcing cycle that accelerates price momentum. This dynamic can drive prices higher faster than fundamental buying pressure alone, which explains why Bitcoin moved so aggressively through multiple technical barriers in rapid succession.
However, this same mechanism carries an important warning: once the densest liquidation clusters have been cleared, the demand generated by forced covering tends to evaporate. This is why understanding where support levels lie becomes critical for the next phase of trading. 📊
Technical Momentum Meets Overbought Conditions ⚠️
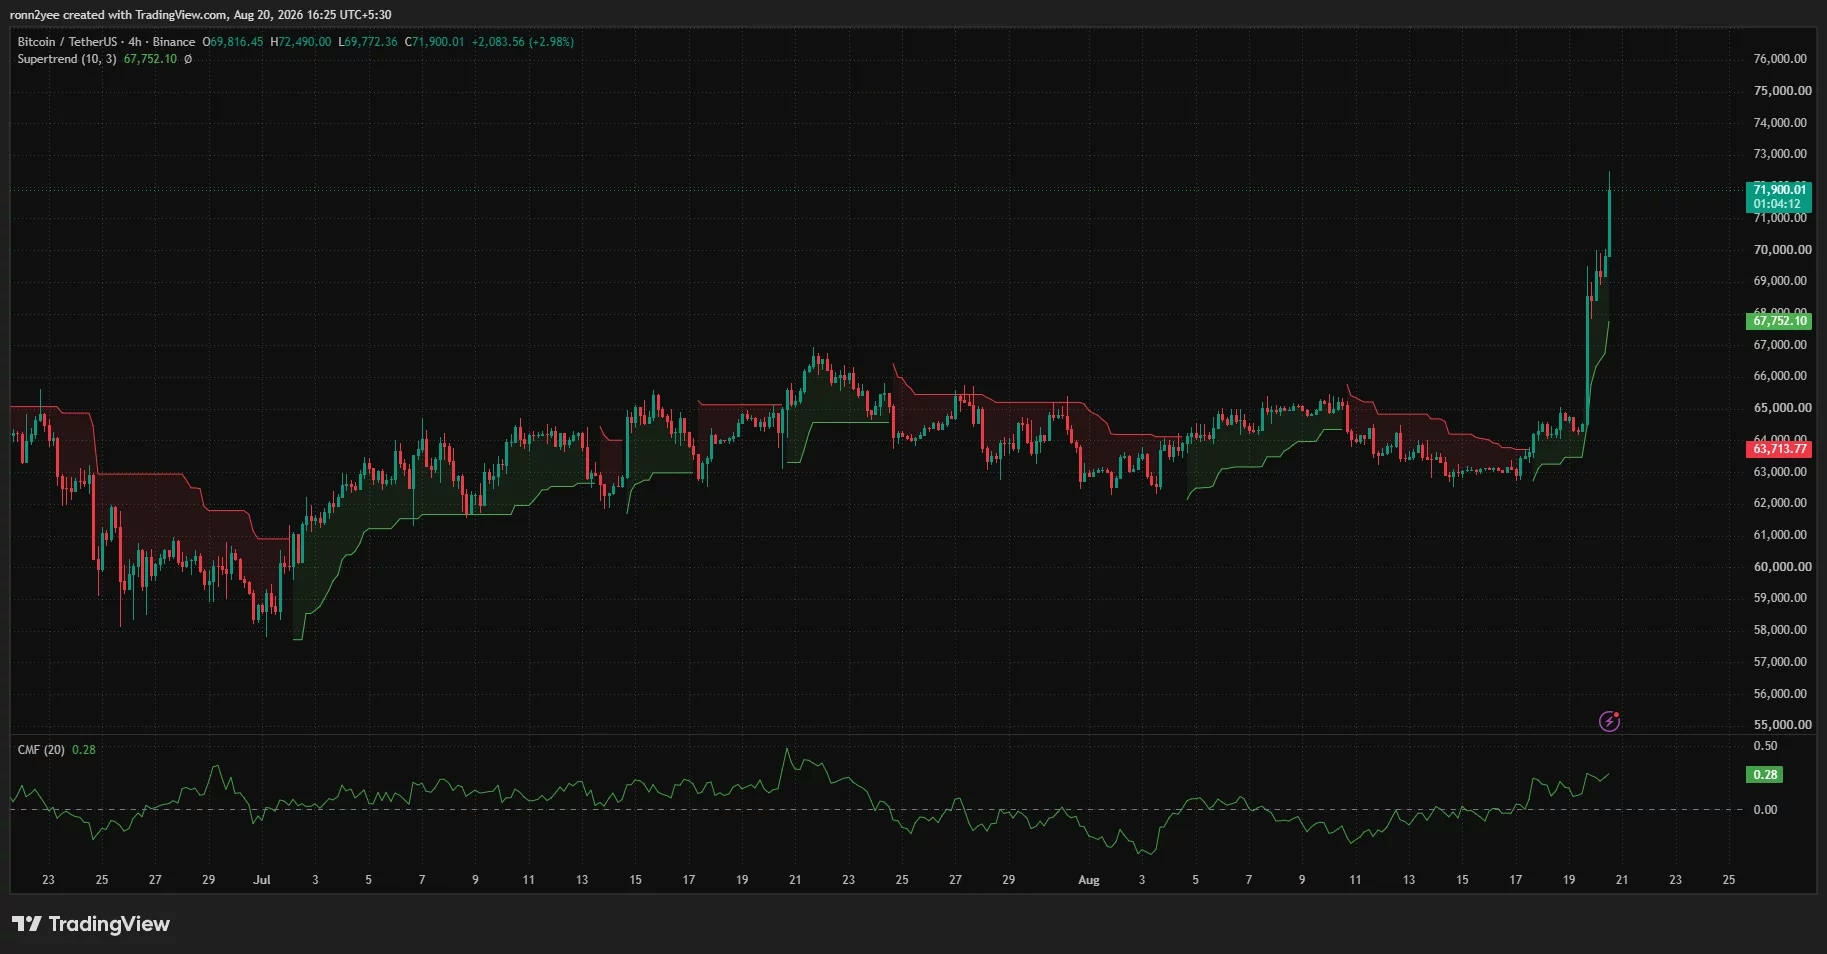
The 4-hour chart presents a bullish picture that would ordinarily excite momentum traders. Bitcoin's Supertrend indicator flipped positive, with its trailing support level rising to $67,752. This suggests the first meaningful support sits approximately 6% below current prices—a relatively tight stop-loss for traders looking to capitalize on further upside.
The Chaikin Money Flow indicator reading of 0.28 confirms that buying pressure has genuinely accompanied the breakout. A positive CMF reading indicates that more volume has entered Bitcoin during periods when prices closed in the upper portion of their trading range—the hallmark of genuine accumulation rather than mere speculation.
Yet the daily chart carries a more cautionary message that deserves serious attention. Bitcoin's 14-day Relative Strength Index (RSI) has surged to 78.7, placing the asset firmly in overbought territory well above the conventional 70 threshold. 🎯
Overbought conditions don't automatically trigger reversals, particularly during short squeezes where forced buying can push prices higher than traditional momentum indicators suggest appropriate. However, elevated RSI readings do increase the probability of consolidation or profit-taking as traders lock in gains from the rapid advance.
The latest daily candle formed a high near $72,490 before the price retreated below $72,000. This rejection at the highs suggests that buyers are facing resistance, even as the overall trend remains positive. For the breakout to be confirmed as more than a temporary squeeze-driven move, Bitcoin must establish support in the $69,000–$70,000 zone.
The Critical Support Zones Everyone's Watching 👀
The $65,000–$67,000 retest zone has become the focal point of trader attention and represents the most likely area where Bitcoin could consolidate if the rally loses steam. This zone encompasses multiple technical levels that make it particularly significant:
The $67,000 Level: This price point represents the midpoint of the initial breakout candle that launched Bitcoin toward $72,000. Momentum traders often use such midpoints as natural support levels, making $67,000 a logical first-support target if prices decline from current levels.
The 4-Hour Supertrend: Currently positioned near $67,752, this dynamic support level would provide additional confluence with the psychological $67,000 zone. Two technical indicators aligning at nearly identical price levels significantly increases the probability that support will hold.
The $65,000–$66,000 Range: This represents the upper boundary of Bitcoin's former consolidation zone where the asset spent weeks building the pressure that eventually exploded into this rally. If the retest extends deeper, this zone would likely attract aggressive buying from traders who missed the initial breakout.
The daily moving-average cluster between $64,264 and $66,211 could offer additional support during a larger retracement. This cluster of multiple moving averages creates a zone of confluence that historically attracts significant buying interest.
Analyst Perspectives: Cautious Optimism With Reservations 💭
The cryptocurrency analyst community remains divided on the implications of this breakout. Some traders view the move as confirmation that Bitcoin has finally broken its intermediate-term downtrend and is establishing a new bullish trend.
Others advocate a more measured approach, suggesting that traders should wait for the market to establish clearer support before committing significant capital. The concern isn't that the breakout is fake—it's that the speed of the move may have gotten ahead of fundamental buying pressure, leaving the asset vulnerable to profit-taking.
This divergence in analyst opinion reflects the genuine uncertainty in the market. Bitcoin has broken above important technical barriers, but the sustainability of this move depends on whether buyers can maintain control during any pullback toward the $65,000–$67,000 zone.
The Macro Context: Yields and ETF Demand 📉💹
The timing of Bitcoin's breakout coincides with important developments in the broader financial markets. US Treasury yields and the dollar weakened following reports that the Treasury Department planned to increase long-dated bond buybacks from $2 billion to at least $4 billion per operation beginning in September.
Lower yields reduce the opportunity cost of holding non-yielding assets like Bitcoin. When government bonds offer lower returns, investors become more willing to allocate capital toward alternative assets, creating a favorable environment for cryptocurrency appreciation.
Additionally, spot Bitcoin exchange-traded funds continued to attract investor capital, with $517 million in net inflows recorded on August 19 alone. This sustained institutional interest provides a fundamental bid beneath the market that could support prices during any pullback toward the critical support zones.
What Comes Next: Upside Targets and Resistance Zones 🎯
If Bitcoin sustains its breakout and holds above the $72,500 level with a daily close, the next nearby psychological resistance sits at $74,000. This round number often attracts technical traders and could serve as a natural profit-taking zone.
Beyond $74,000, Bitcoin would face a broader supply region between $78,000 and $80,000—the area where the market traded before the sharp June decline. This zone represents significant resistance because it contains the positions of traders who bought near the peak and are waiting for prices to return to breakeven.
However, reaching these levels depends entirely on whether Bitcoin can maintain the support levels discussed above. A failure to hold the $67,000–$69,000 zone would invalidate the bullish breakout and potentially drive prices back toward the $63,000–$65,000 range.
Key Takeaways: Navigating Bitcoin's Critical Phase 🔑
Bitcoin stands at an inflection point where technical confirmation and market psychology intersect. The asset has broken above critical moving averages and forced significant short liquidations, creating genuine bullish momentum.
However, elevated overbought conditions and the rapid pace of the advance suggest caution is warranted. The $65,000–$67,000 retest zone will likely determine whether this breakout represents the beginning of a sustained bull move or merely a temporary squeeze before renewed selling pressure emerges.
Traders should monitor whether Bitcoin can establish support in the $69,000–$70,000 zone. Holding this level would confirm the breakout's legitimacy and suggest further upside remains possible. A breakdown below $67,000 would signal that the move was primarily driven by short covering rather than fundamental buying pressure, potentially triggering a retest of the previous consolidation range.
The next few trading sessions will be critical in determining Bitcoin's intermediate-term direction. Whether the asset confirms a new bull trend or experiences a significant pullback will depend on whether buyers maintain control during any retracement toward these crucial support levels. 📍
You May Also Like

Market Analysis
XRP Price Falls 5% as Leverage Hits Seven-Month High
August 26, 2026

Market Analysis
Crypto Market Hits Extreme Greed: What This Means for Bitcoin
August 26, 2026

Market Analysis
Ethereum Price Rally Overheats Below $2,550 Resistance
August 26, 2026

Market Analysis
Hyperliquid Price Rally: HYPE Targets $97 Amid $80 Support
August 25, 2026