Category:
Market AnalysisBitcoin Rebounds from $63,200 as CPI Data Looms

Bitcoin's journey through volatile market conditions continues to captivate traders and investors worldwide. 📊 On August 12, the leading cryptocurrency demonstrated resilience by rebounding from critical support levels, recovering to approximately $64,130 after a sharp dip toward $63,200. This price action reveals much about the current state of market sentiment and the forces shaping Bitcoin's near-term trajectory.
The Recovery: How Bitcoin Bounced Back 🚀
The digital asset's ability to recover from $63,200 wasn't accidental—it reflected genuine buying interest at key support zones. Bitcoin had initially broken below the psychologically significant $64,000 threshold during the trading session, triggering what traders call a "leveraged-position flush." This phenomenon occurs when liquidations cascade through the market, forcing both long and short positions to close involuntarily.
What made this particular recovery noteworthy was the speed and conviction behind it. Buyers stepped in aggressively near the lower end of the recent trading range, allowing Bitcoin to reclaim $64,000 and establish a foothold above this critical psychological level. The 0.83% daily gain might seem modest, but in the context of the preceding volatility, it represented a meaningful shift in momentum.
Liquidations Reveal Market Positioning 💥
The $174 million contraction in cumulative long and short positioning provides crucial insight into what transpired during the decline. This figure represents the delta between total long and short liquidations across the cryptocurrency derivatives market, indicating a significant unwinding of leveraged exposure.
Breaking down the liquidation data paints an interesting picture:
- Total crypto liquidations (24-hour): $174 million
- Long liquidations: $86.21 million
- Short liquidations: $87.99 million
- Bitcoin-specific long liquidations: $32.73 million
- Bitcoin-specific short liquidations: $30.81 million
The relatively balanced split between long and short liquidations suggests that both bulls and bears faced pressure simultaneously. This balanced liquidation pattern often precedes significant price moves, as the market searches for new equilibrium.
Geopolitical Tensions and Inflation Concerns ⚠️
Beyond technical factors, macroeconomic uncertainty weighed heavily on Bitcoin's price action. Geopolitical tensions, particularly concerning Iran's stance on the Strait of Hormuz, created an undercurrent of risk aversion across financial markets. When geopolitical uncertainty rises, investors typically reduce exposure to risk assets—including cryptocurrencies—in favor of traditional safe-haven investments.
The more immediate catalyst, however, was the impending U.S. Consumer Price Index (CPI) report scheduled for 8:30 a.m. ET on August 12. This monthly inflation gauge carries outsized importance for cryptocurrency markets because it directly influences Federal Reserve policy expectations. Economists surveyed by Reuters anticipated:
- Headline CPI: +0.1% monthly, +3.4% annually
- Core CPI: +0.2% monthly, +2.5% annually
A CPI reading exceeding these forecasts would likely strengthen expectations that the Federal Reserve would maintain elevated interest rates or even consider additional increases. Conversely, a softer-than-expected reading could ease pressure on risk assets and provide tailwinds for Bitcoin.
Corporate Bitcoin Sales Add Selling Pressure 📉
Institutional activity also influenced Bitcoin's price dynamics during this period. Strategy, a major corporate Bitcoin holder, executed a notable sale during the week ending August 10. The company divested 1,690 Bitcoin at an average price of $64,262, generating approximately $109 million in proceeds.
Interestingly, Strategy didn't redirect these funds into its cash reserves. Instead, management used the proceeds to repurchase STRC preferred shares, signaling confidence in the company's equity valuation despite Bitcoin's volatility. Separately, Strategy raised $653.1 million through common stock sales and allocated $650 million to its U.S. dollar reserve, suggesting a more cautious stance on near-term market conditions.
While $109 million represents a meaningful institutional sale, it's important to contextualize this within Bitcoin's $1.3+ trillion market capitalization. Nevertheless, large institutional transactions can influence price action, particularly during periods of elevated leverage and thin liquidity.
Technical Resistance Levels Define Near-Term Outlook 🎯
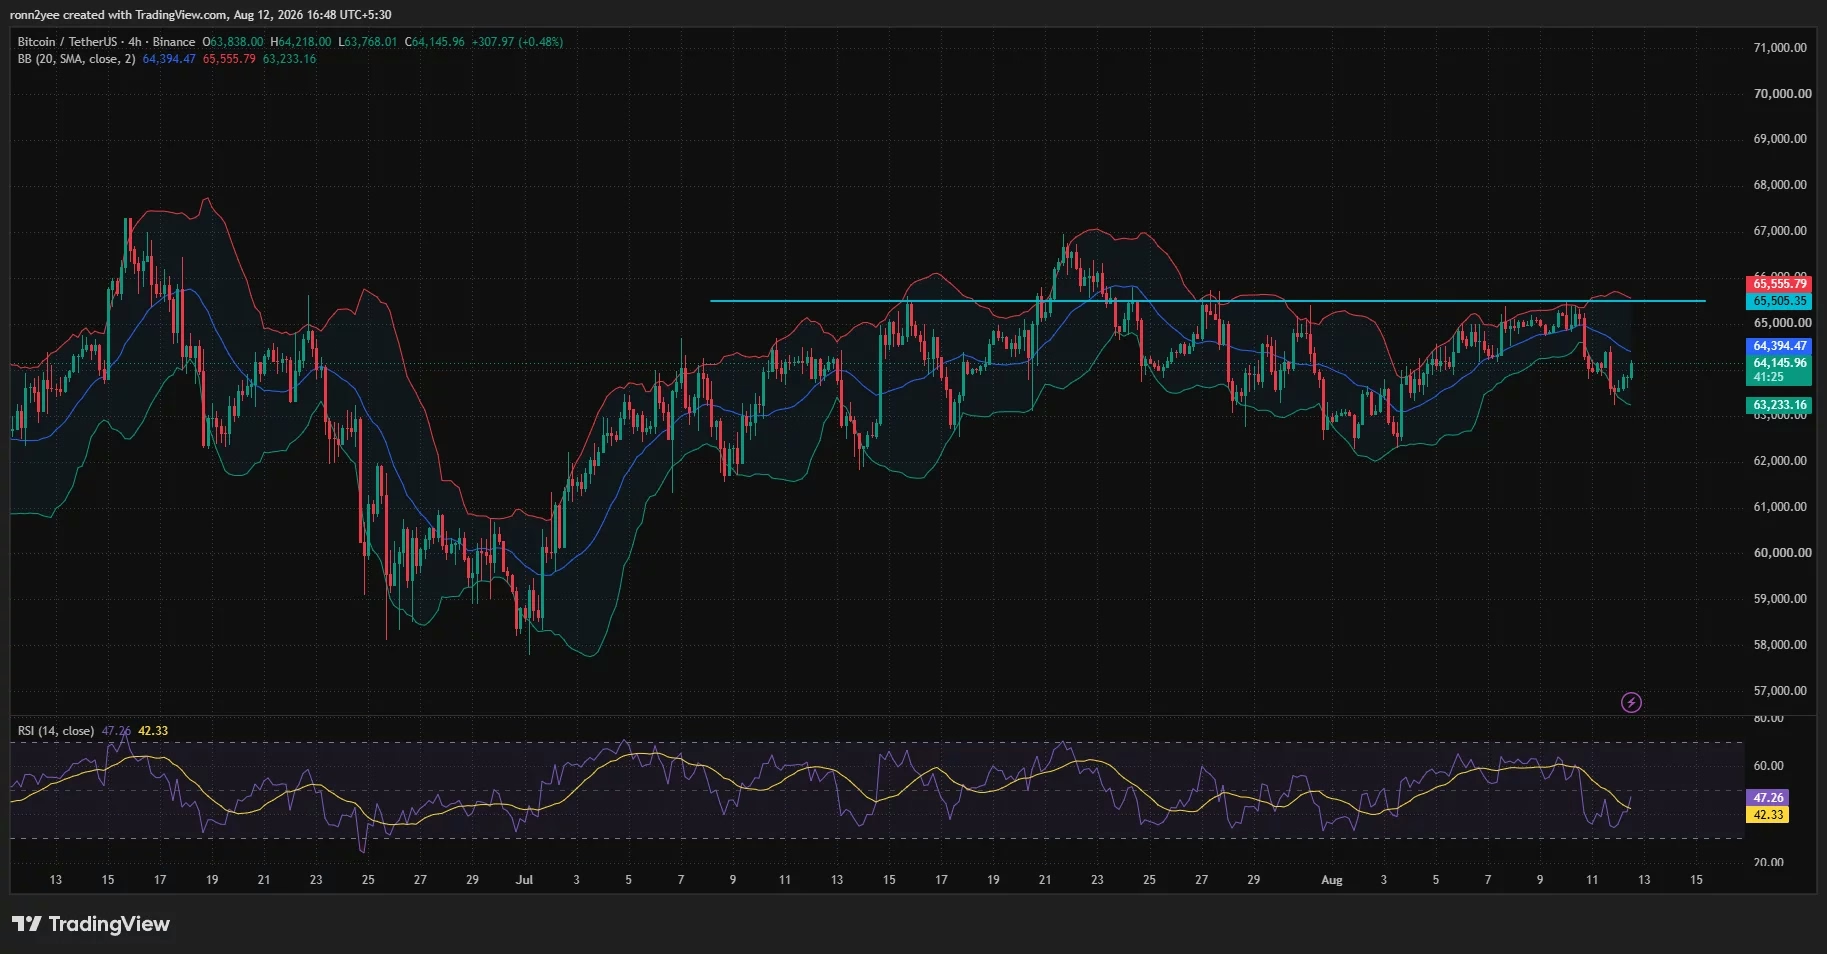
The 4-hour chart reveals critical technical levels that will determine Bitcoin's next move. After recovering from the lower Bollinger Band at $63,233, Bitcoin faced its first hurdle at the 20-period middle band, positioned near $64,394. Breaking above $64,400 would represent a meaningful technical achievement.
Key resistance levels to monitor:
- $64,400 - The 4-hour middle Bollinger Band
- $65,500 - A horizontal resistance level that has repeatedly rejected rallies since mid-July
- $65,556 - Upper Bollinger Band, strengthening the $65,500–$65,600 resistance zone
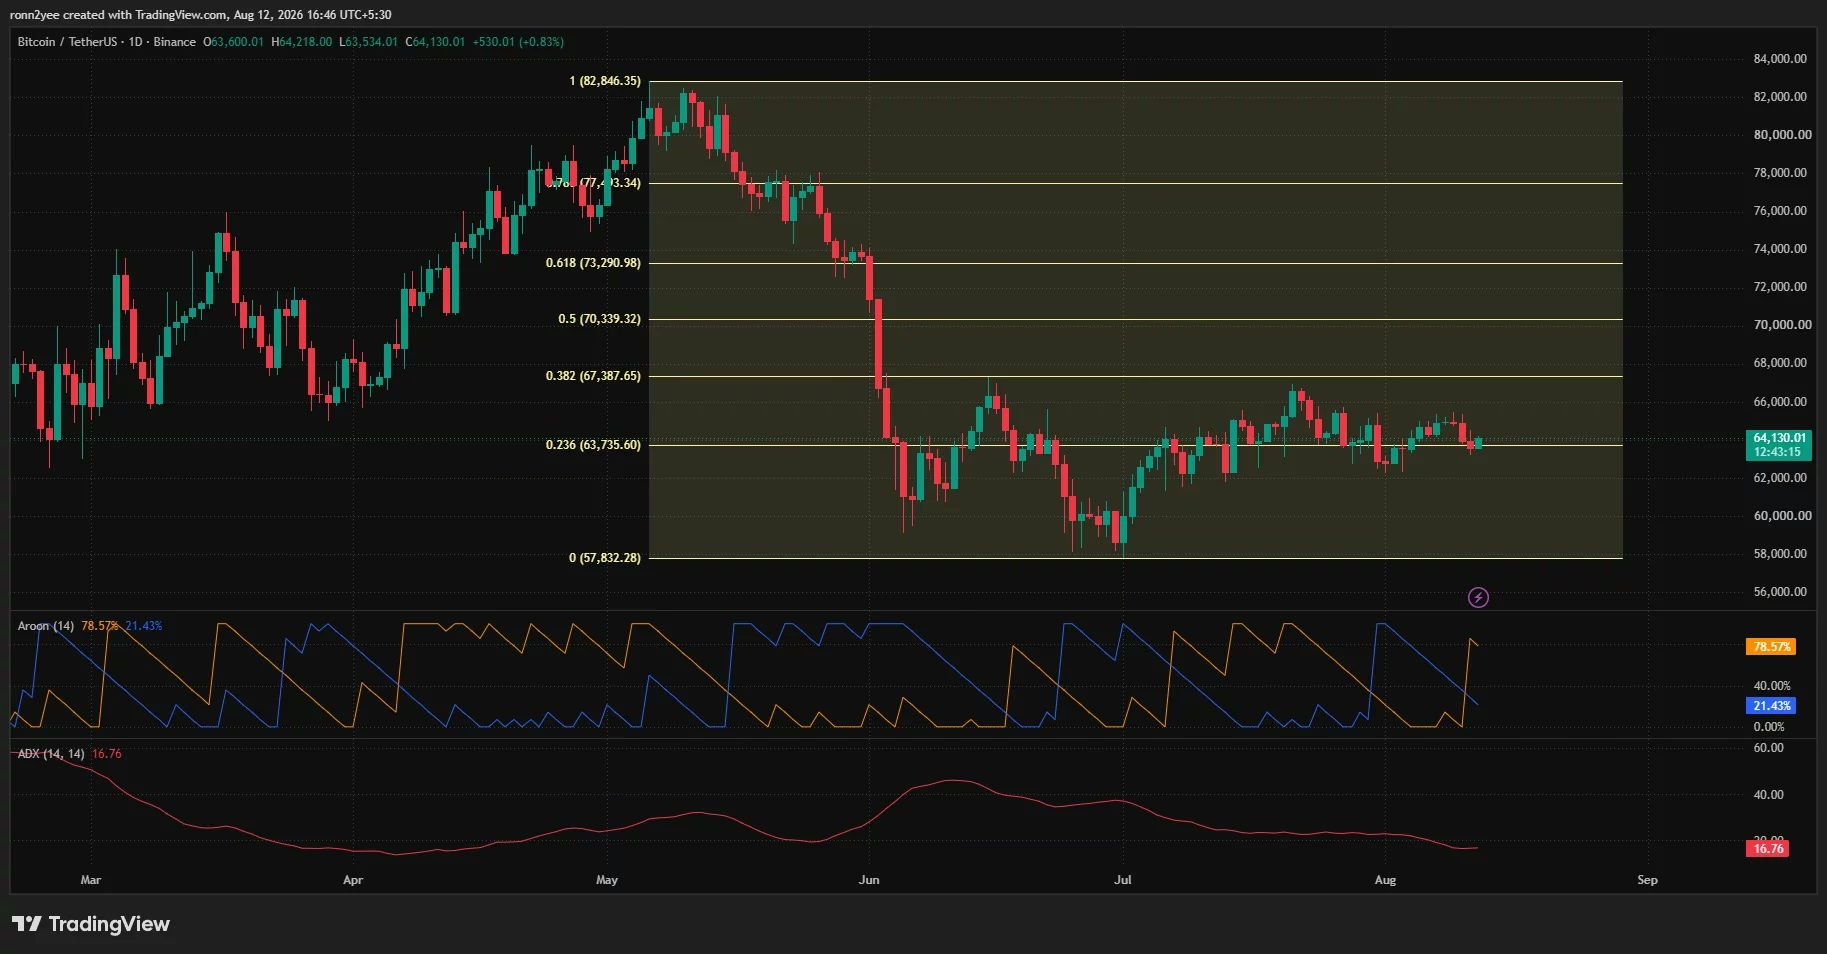
- $67,388 - The 23.6% Fibonacci retracement level (measured from the March low of $57,832 to the May high of $82,846)
Momentum indicators suggest cautious optimism. The 4-hour Relative Strength Index recovered to 47.26 from near-oversold conditions and moved above its signal average of 42.33. A break above 50 would provide stronger evidence that short-term momentum has genuinely shifted in favor of buyers.
However, the daily chart presents a more bearish picture. The Aroon Down indicator stood at 78.57% compared with Aroon Up at just 21.43%, indicating that recent downside activity remains dominant. The Average Directional Index reading of 16.76 suggests limited trend strength, supporting the continuation of range-bound trading rather than a decisive directional move.
Liquidity Mapping: Where Bitcoin Might Head Next 🗺️
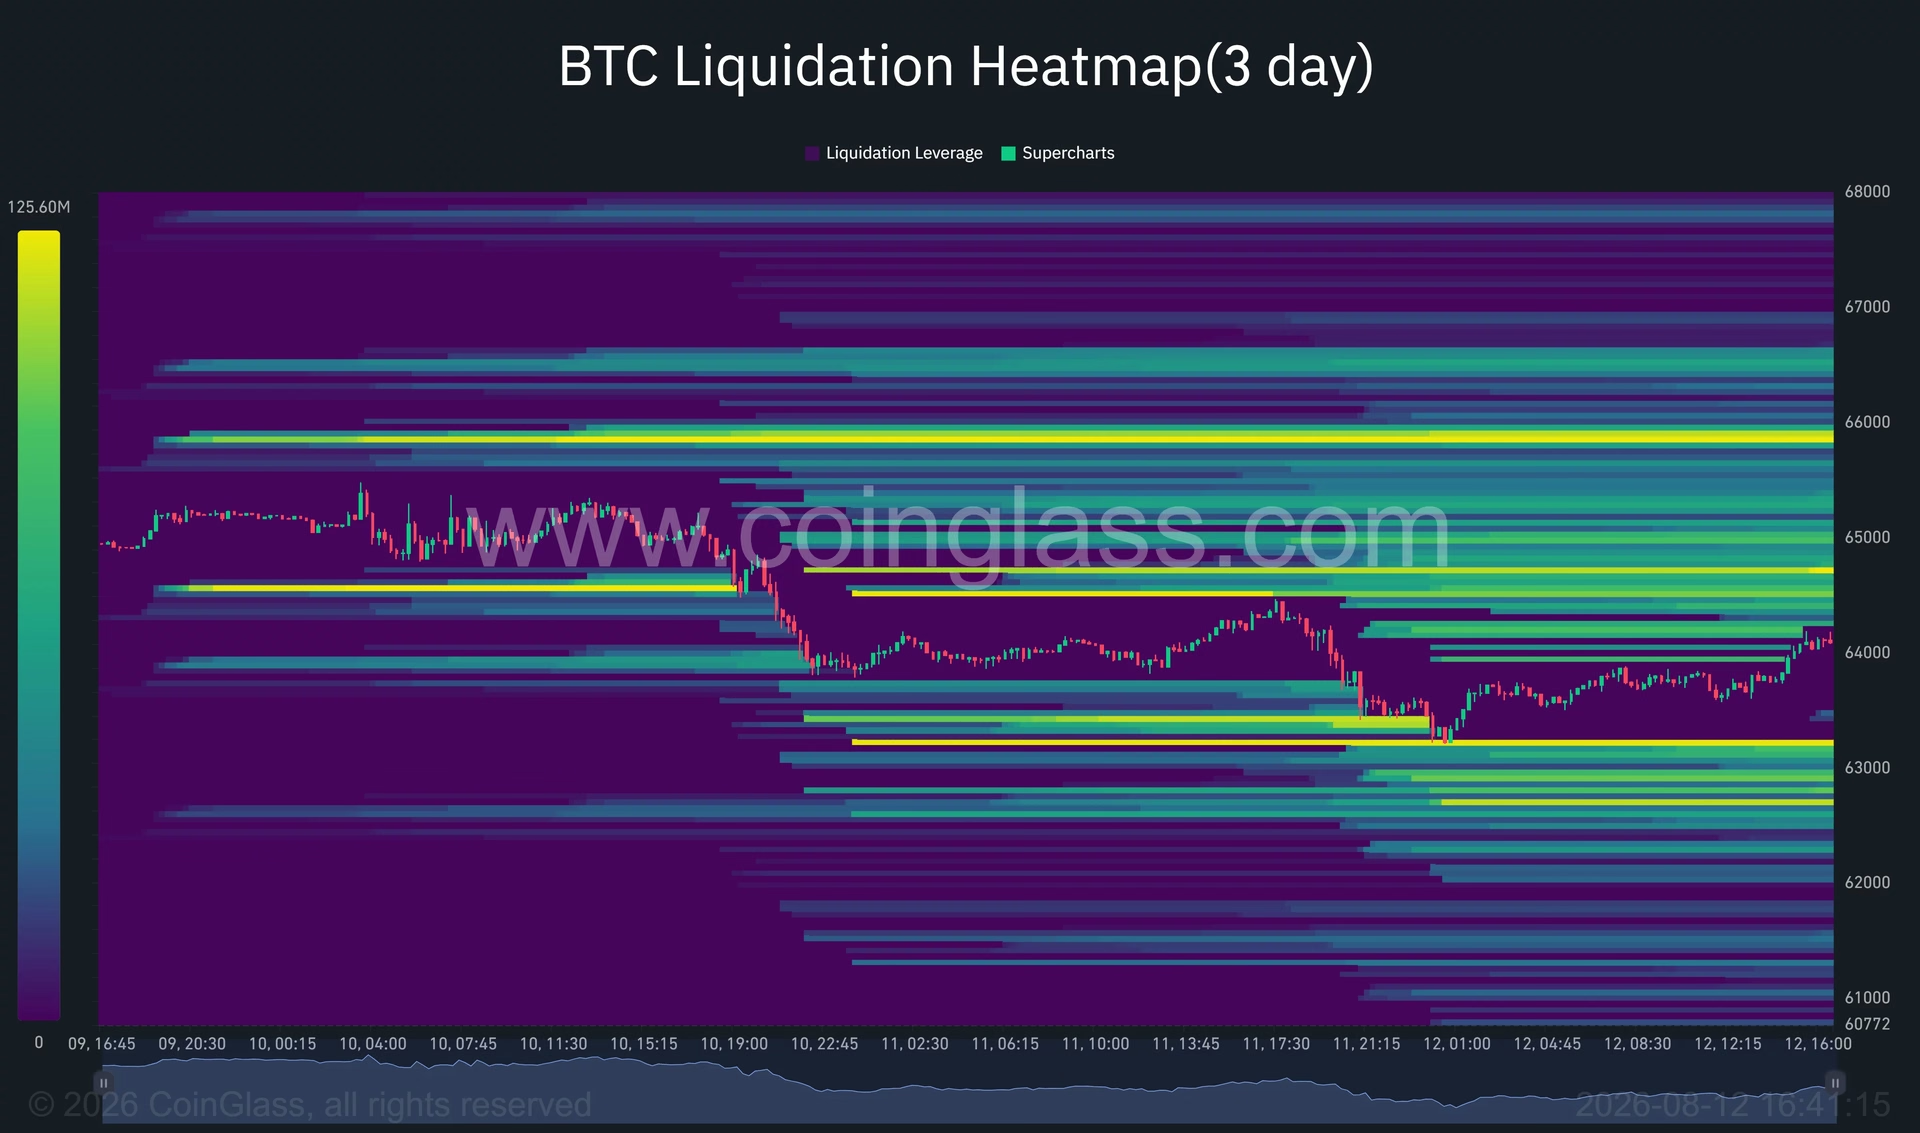
CoinGlass's 3-day liquidation heatmap provides valuable insight into where significant price moves might occur. The data reveals concentrated liquidity clusters that can act as both support and resistance.
Downside liquidity concentrations:
- $63,200–$63,400 - Dense cluster where Bitcoin's latest decline stopped
- $62,700–$63,000 - Additional liquidity that could attract sellers if momentum reverses
- $62,000–$62,500 - Major support zone identified by technical analysts
Upside liquidity targets:
- $64,600–$64,800 - Closest upside concentration
- $65,800–$66,000 - Larger liquidity pools that could provide targets if Bitcoin clears $64,400
Trader Lennaert Snyder noted that Bitcoin had reached his short-term target at $63,300 and was consolidating around $64,000. His analysis suggested that while sellers maintained control, the $63,000 region could offer attractive entry points for hedge-long positions to offset short exposure.
Analyst Ted Pillows identified $62,000–$62,500 as the next major support zone after Bitcoin failed to reclaim $65,000. Both perspectives suggest immediate downside risk remains present, though sustained breaks above $65,500 would weaken the bearish thesis.
The CPI Factor: The Ultimate Near-Term Catalyst 📈
With the CPI report released on August 12, Bitcoin's immediate direction hinged on whether inflation data met, exceeded, or fell short of expectations. The cryptocurrency market has become increasingly sensitive to inflation data because these reports directly influence central bank policy decisions.
Scenario analysis:
- Inflation meets or beats expectations: Bitcoin could challenge the $64,800 liquidity band as risk appetite improves
- Inflation exceeds expectations: The market might redirect focus toward $63,000 and $62,500 support levels
- Significant miss to the downside: Could unlock rallies toward $65,500 and beyond
Historically, softer inflation readings have provided tailwinds for risk assets, while hotter-than-expected data has triggered sell-offs. Bitcoin's correlation with inflation expectations remains a defining characteristic of its current market dynamics.
What This Means for Bitcoin's Broader Trajectory 🔮
The rebound from $63,200 demonstrates that support levels remain intact despite persistent selling pressure. However, the technical picture suggests Bitcoin remains in a consolidation phase rather than establishing a new uptrend. The cryptocurrency needs to decisively break above $65,500 to weaken the bearish narrative that has dominated since the May highs.
Market participants should remain vigilant about several ongoing developments: the Federal Reserve's policy stance, geopolitical tensions affecting risk sentiment, and the ongoing unwinding of leveraged positions. Each of these factors could accelerate price movements in either direction.
The coming days and weeks will prove critical in determining whether Bitcoin establishes a sustainable recovery or continues to grind lower toward the $62,000–$62,500 support zone. Traders and investors should monitor both the technical levels outlined above and the macroeconomic calendar for signals about the cryptocurrency's next significant move. 💡
Key Takeaways 📌
- Bitcoin rebounded to $64,130 after dipping to $63,200, driven by buyer interest at key support
- $174 million in leveraged liquidations occurred across the broader crypto market
- Geopolitical tensions and CPI data uncertainty created headwinds for risk assets
- Technical resistance at $64,400 and $65,500 will determine near-term momentum
- Liquidity mapping suggests $63,000 and $62,500 as potential downside targets if sellers regain control
- CPI data remains the primary near-term catalyst for significant price moves
You May Also Like

Market Analysis
XRP Price Falls 5% as Leverage Hits Seven-Month High
August 26, 2026

Market Analysis
Crypto Market Hits Extreme Greed: What This Means for Bitcoin
August 26, 2026

Market Analysis
Ethereum Price Rally Overheats Below $2,550 Resistance
August 26, 2026

Market Analysis
Hyperliquid Price Rally: HYPE Targets $97 Amid $80 Support
August 25, 2026