Category:
Market AnalysisBitcoin Reclaims $64K: Leverage Risks Threaten Recovery

Bitcoin's Latest Recovery: A Tale of Two Forces 📈
Bitcoin has successfully climbed back above the psychologically important $64,000 threshold, marking a significant recovery after weeks of consolidation. The world's leading cryptocurrency surged approximately 1.7% to reach around $64,200 on August 18, driven primarily by institutional buying pressure through spot Bitcoin ETFs. However, beneath this seemingly positive price action lies a concerning undercurrent: rapidly accumulating leverage positions that could expose this recovery to severe pullback risk.
This recovery represents more than just another price bounce in Bitcoin's volatile trading landscape. It signals a potential shift in institutional sentiment, yet simultaneously highlights the fragile nature of cryptocurrency markets when leverage builds without corresponding fundamental strength.
The ETF Inflow Story: Institutional Demand Returns 💰
U.S.-listed spot Bitcoin ETFs recorded more than $137 million in net inflows on Monday, a meaningful reversal from the previous week's $385 million in net outflows. This shift demonstrates that institutional investors haven't abandoned Bitcoin entirely—they were simply taking a breather after sustained selling pressure.
The return of ETF inflows is particularly noteworthy because it represents a more stable form of demand compared to leveraged trading. These flows suggest that professional investors view current prices as attractive entry points, providing some fundamental support for the recovery. When institutions deploy capital, it typically carries more weight than retail speculation because of the size and strategic nature of their positions.
Technical Setup: Moving Averages Tell a Mixed Story 🔍
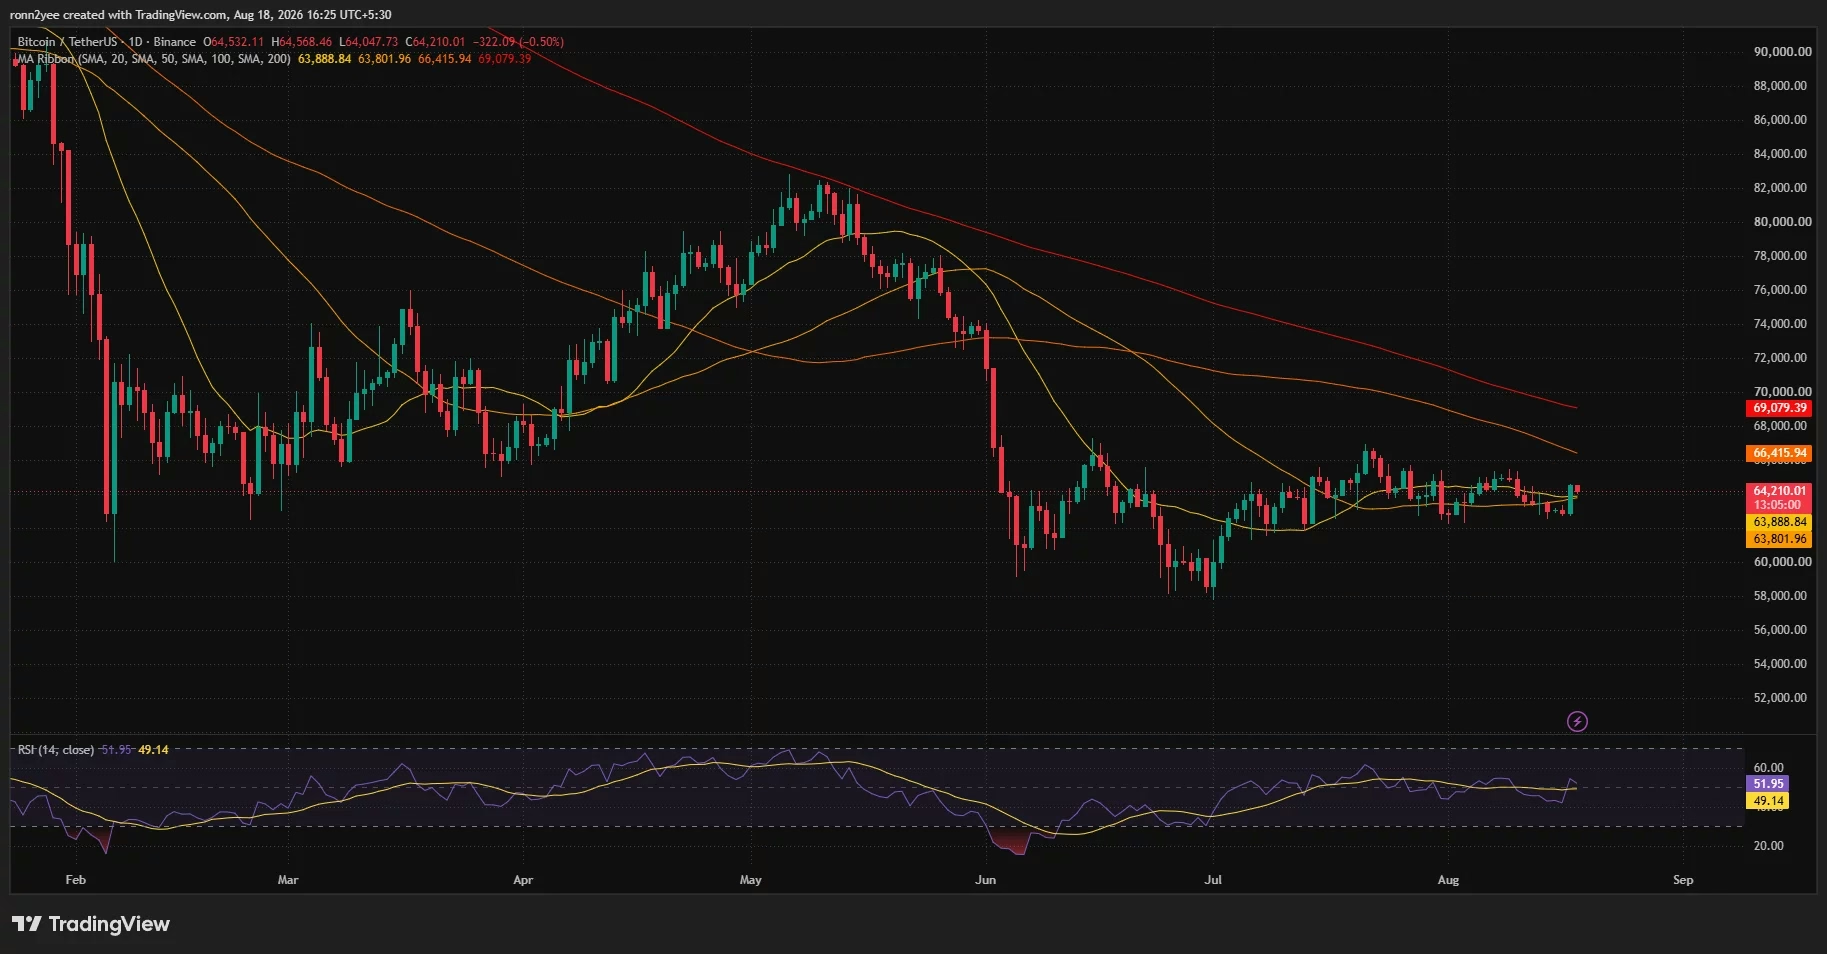
Bitcoin's daily chart reveals a technically interesting but ultimately challenged recovery. The price now sits above both its 20-day simple moving average ($63,802) and 50-day moving average ($63,889), establishing what traders call a "golden cross" on shorter timeframes. This is typically considered bullish in technical analysis.
However, the longer-term picture presents significant headwinds. Bitcoin remains well below its 100-day moving average at $66,416 and substantially beneath its 200-day average near $69,079. Both of these critical resistance levels are sloping downward, indicating that the broader trend remains bearish despite the recent bounce.
Key technical levels to watch:
- Immediate support: $63,800–$64,000 (20/50-day moving average cluster)
- First major resistance: $64,500–$64,700
- Intermediate resistance: $66,400 (100-day moving average)
- Longer-term resistance: $69,079 (200-day moving average)
The relative strength index (RSI) reached 51.95 on the daily chart, just above its signal average of 49.14. This reading indicates that buying momentum has gained a marginal advantage, but neither bulls nor bears have established firm control—a precarious balance that could tip either direction.
The Leverage Problem: Hidden Risk Beneath the Surface ⚠️
While ETF inflows provide some reassurance, the accumulation of leveraged long positions tells a different story. According to market analysis, long leverage has been increasing substantially while exchange liquidity has simultaneously declined. This combination creates a dangerous dynamic that could trigger cascading liquidations if Bitcoin experiences a sharp pullback.
Leverage amplifies both gains and losses. When traders use borrowed capital to increase their position sizes, they magnify their exposure to price movements. During uptrends, this feels wonderful—every percentage gain becomes a multiple of that return. But when the market reverses, the same leverage mechanism forces traders to close positions at losses, accelerating the downside move.
Liquidation Zones: Where Forced Selling Lurks 🎯
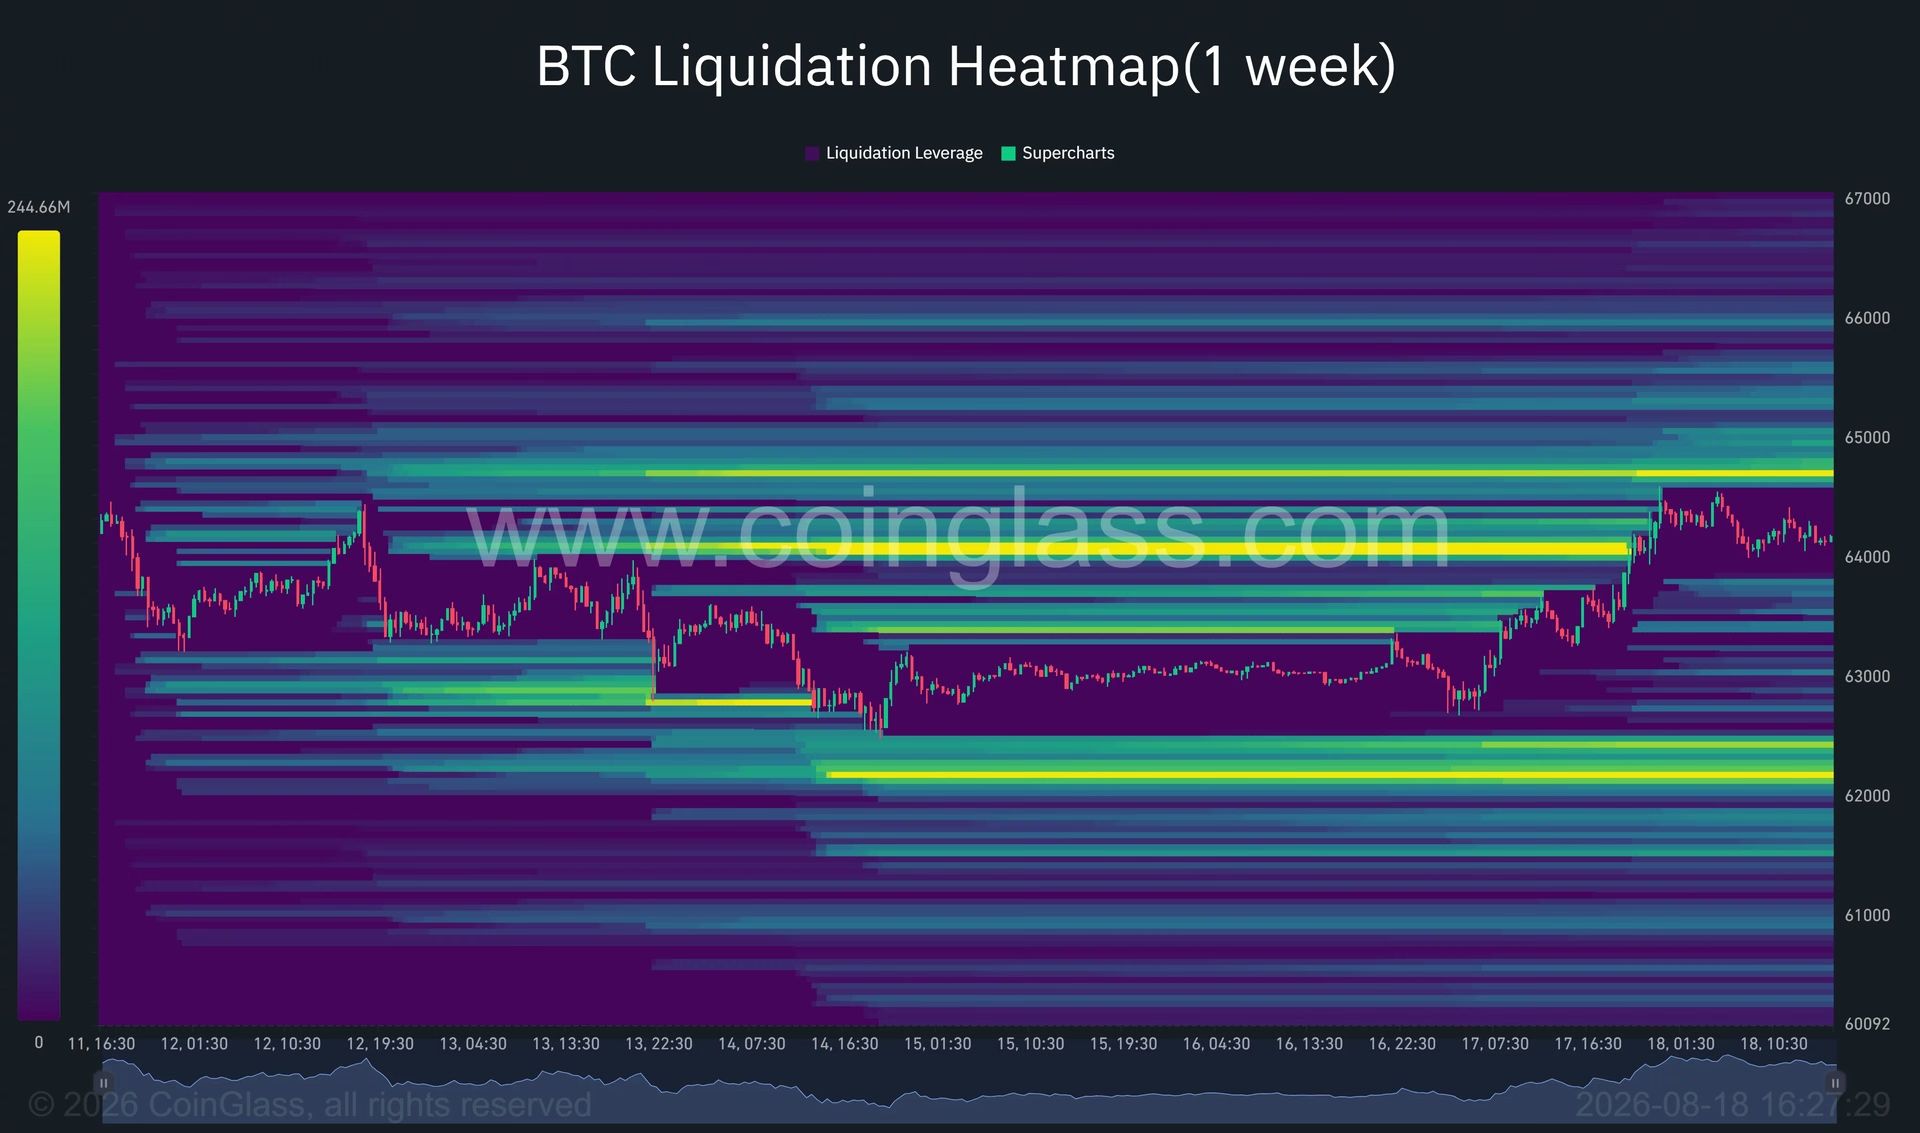
CoinGlass' one-week Bitcoin liquidation heatmap reveals critical information about where leveraged traders are concentrated. The data shows:
Upside liquidation clusters:
- Dense concentration around $64,700 (nearest major pool above current price)
- Secondary clusters at $65,000, $65,500, and $66,000
Downside liquidation pools:
- Largest concentration near $62,200–$62,300
- Smaller pools around $63,500 and $62,800
These liquidation zones function like pressure points in the market. When price approaches these levels, traders with opposing positions face forced closure, which can accelerate price movements in both directions. The $64,700 level is particularly significant—if Bitcoin breaks above $64,500–$64,600 resistance, it could trigger a cascade of short liquidations that propels price toward $65,000 and beyond.
Conversely, if the recovery falters below $63,800, the next major support level—$62,200–$62,300—becomes the critical line in the sand. A break below this would represent a failure of the current recovery and could signal a deeper decline.
Historical Context: The $62,600 Defense Point 📍
Bitcoin's recovery from the $62,600–$62,800 region isn't arbitrary—this area has repeatedly attracted institutional buying since June. Traders tested this level on August 14 and again on August 17 before the current rally pushed Bitcoin as high as $64,586 on Tuesday.
This pattern suggests that major market participants have identified this zone as a critical support level worth defending. The fact that buyers stepped in multiple times at similar prices indicates conviction among institutional investors. However, this also means that if this level is finally broken decisively, it could signal that institutional support is exhausted, potentially leading to a more significant selloff.
The Broader Market Context: Mining Pressure and AI Diversion 🔧
An often-overlooked factor affecting Bitcoin's supply dynamics involves mining operations. Recent reports indicate that miners have reduced computing capacity by approximately 20% over three quarters, with some operators shifting resources toward artificial intelligence infrastructure. This shift has implications for Bitcoin's long-term supply dynamics and could affect the balance between new supply and institutional demand.
The question becomes: can institutional ETF inflows continue absorbing selling pressure when mining capacity is being redirected? This uncertainty adds another layer of complexity to the current recovery.
4-Hour Chart Analysis: Tactical Entry Points 📊
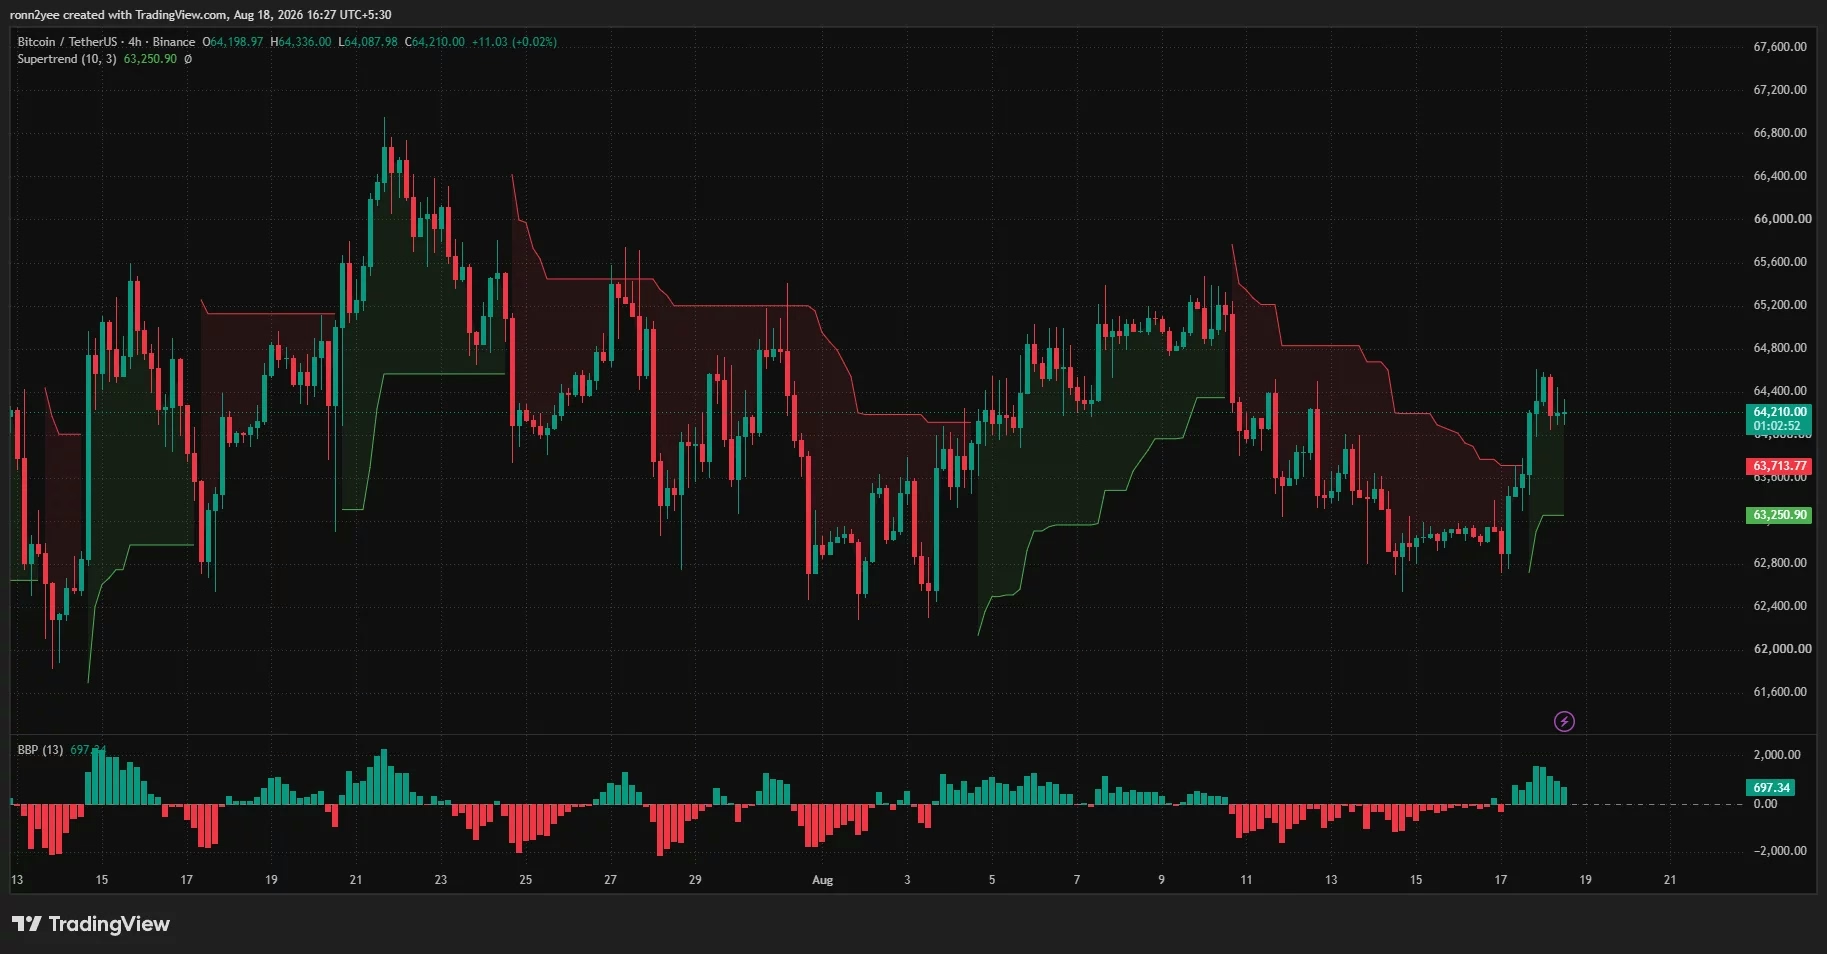
Zooming into the 4-hour timeframe reveals a stronger near-term setup. Bitcoin's Supertrend indicator flipped to support mode, with its lower boundary positioned near $63,251. The bull-bear power histogram moved into positive territory at 697, indicating that buyers are pushing price above underlying averages.
However, this strength appears to be waning. The histogram began shrinking after its initial expansion as Bitcoin approached $64,500, suggesting that buying momentum is losing steam. Technical analysts have identified $63,800–$64,000 as a potential lower-timeframe entry area, with $65,000 as a near-term target for the coming days.
A successful retest of the $63,800–$63,900 support zone would allow buyers to challenge $64,500 again. Failure to hold this level would shift focus to the 4-hour Supertrend support near $63,250, which would represent a more significant breakdown.
What Needs to Happen Next: The Roadmap Forward 🗺️
For the recovery to extend:
- Bitcoin must break above Tuesday's high of $64,586
- The price needs to clear $64,700 (liquidation cluster)
- Sustained buying pressure must push through $65,000–$65,500
- Finally, a break above the 100-day moving average at $66,400 would establish real bullish momentum
For the recovery to fail:
- Bitcoin loses the $63,800–$64,000 moving average cluster
- Price falls below $62,600 (historical support)
- The $62,200–$62,300 liquidation zone breaks, triggering forced selling
- This could accelerate decline toward the $58,000–$60,000 range
The Leverage Paradox: Strength That Creates Weakness 🔄
Here's the uncomfortable reality: the very leverage that's helping propel Bitcoin higher in the short term is simultaneously creating the conditions for a sharp pullback. Traders are using borrowed capital to amplify their bets, which works beautifully during rallies but becomes catastrophic during reversals.
Rain, a prominent crypto market commentator, highlighted that while Bitcoin's ability to hold above $64,000 appears impressive, the underlying conditions suggest otherwise. Long leverage is building while exchange liquidity is declining—a combination that historically precedes volatile reversals.
Key Takeaways: What Investors Should Know 💡
The recovery is real but fragile: Bitcoin has genuinely bounced from support levels, and institutional inflows provide some fundamental backing. However, the bounce lacks the conviction needed to overcome longer-term resistance.
Leverage is the wild card: The accumulation of leveraged positions creates hidden risk that could trigger sharp reversals in either direction. A move toward $64,700 could force liquidations that accelerate gains, while a break below $63,800 could trigger cascading losses.
Technical resistance is substantial: Bitcoin must overcome multiple moving averages and resistance zones to establish a genuine recovery. The 100-day moving average at $66,416 represents the first major hurdle.
Support levels matter: The $63,800–$64,000 zone and especially $62,200–$62,300 represent critical levels. Their integrity determines whether this recovery has staying power.
Looking Ahead: The Immediate Outlook 🔮
Bitcoin's next 48–72 hours will be crucial for determining the recovery's legitimacy. If the price can clear $64,700 and establish $65,000 as support, it would suggest that institutional buyers are genuinely committed to pushing higher. Conversely, a failure to hold $63,800 would indicate that the recovery was merely a technical bounce without fundamental conviction.
The leverage situation adds urgency to this analysis. As more traders build positions based on the recovery narrative, the potential for a sharp reversal increases exponentially. This creates an interesting dynamic where success breeds the seeds of future failure—a characteristic pattern in leveraged cryptocurrency markets.
Investors should monitor Bitcoin's behavior around $64,700 closely. This level will reveal whether the recovery is attracting additional buyers or whether leveraged traders are taking profits ahead of technical resistance. The answer to this question will likely determine Bitcoin's direction for the remainder of the month.
You May Also Like

Market Analysis
XRP Price Falls 5% as Leverage Hits Seven-Month High
August 26, 2026

Market Analysis
Crypto Market Hits Extreme Greed: What This Means for Bitcoin
August 26, 2026

Market Analysis
Ethereum Price Rally Overheats Below $2,550 Resistance
August 26, 2026

Market Analysis
Hyperliquid Price Rally: HYPE Targets $97 Amid $80 Support
August 25, 2026