Category:
Market AnalysisBitcoin Reclaims $64K: Volatility Trap Alert at 91

Bitcoin has staged a modest recovery, climbing back above the $64,000 psychological barrier after testing support levels throughout August 2026. Yet beneath this surface-level price action lies a fascinating paradox that's capturing the attention of institutional traders and crypto analysts worldwide—one that suggests major volatility could be lurking just around the corner. 🚀
Bitcoin's Path Back to $64,000 📈
The leading cryptocurrency bounced from an intraday low of $62,751 to reach $64,227 during the Aug. 17 trading session, marking a nearly 2% daily gain. This recovery proved significant because it pushed BTC above the 78.6% Fibonacci retracement level at $63,152, a technical milestone that traders had been watching closely.
The price action reflected renewed buying interest after Bitcoin had spent the previous week oscillating between $62,500 and $63,000. Market participants noted that buyers consistently stepped in to defend this support zone, suggesting institutional accumulation at lower levels.
Jeff Mei, chief operating officer at crypto exchange BTSE, attributed some of the earlier weakness to exchange-traded fund outflows. "Recent ETF flows have created headwinds for both Bitcoin and Ethereum," Mei explained, noting that capital movements from institutional products can significantly influence short-term price direction.
The Volatility Trap: A Historical Extreme 🎯
What makes this current market environment particularly intriguing is the extreme compression in volatility metrics. Glassnode's volatility trap score has climbed to 91 out of 100—the highest reading recorded in more than 3.5 years. This metric serves as an early warning system for traders, indicating when markets are unusually quiet relative to historical norms.
Rafael Schultze-Kraft, co-founder of Glassnode, highlighted a crucial distinction that many traders overlook. Bitcoin's implied volatility—the future price movement expected by options traders—has fallen into the lowest 2% of its historical distribution. However, realized volatility (actual price movements) has fallen even further, creating a paradoxical situation.
"The gap between implied and realized volatility means options traders are still paying a notable premium even though actual price swings have been compressed," Schultze-Kraft noted. This dynamic suggests that options markets are pricing in the expectation of a volatility expansion that hasn't yet materialized.
Historically, periods of severe volatility compression have preceded significant price moves, though the data doesn't indicate direction. The last comparable compression occurred during periods of market consolidation before major directional breaks.
Technical Indicators Show Conflicting Signals ⚠️
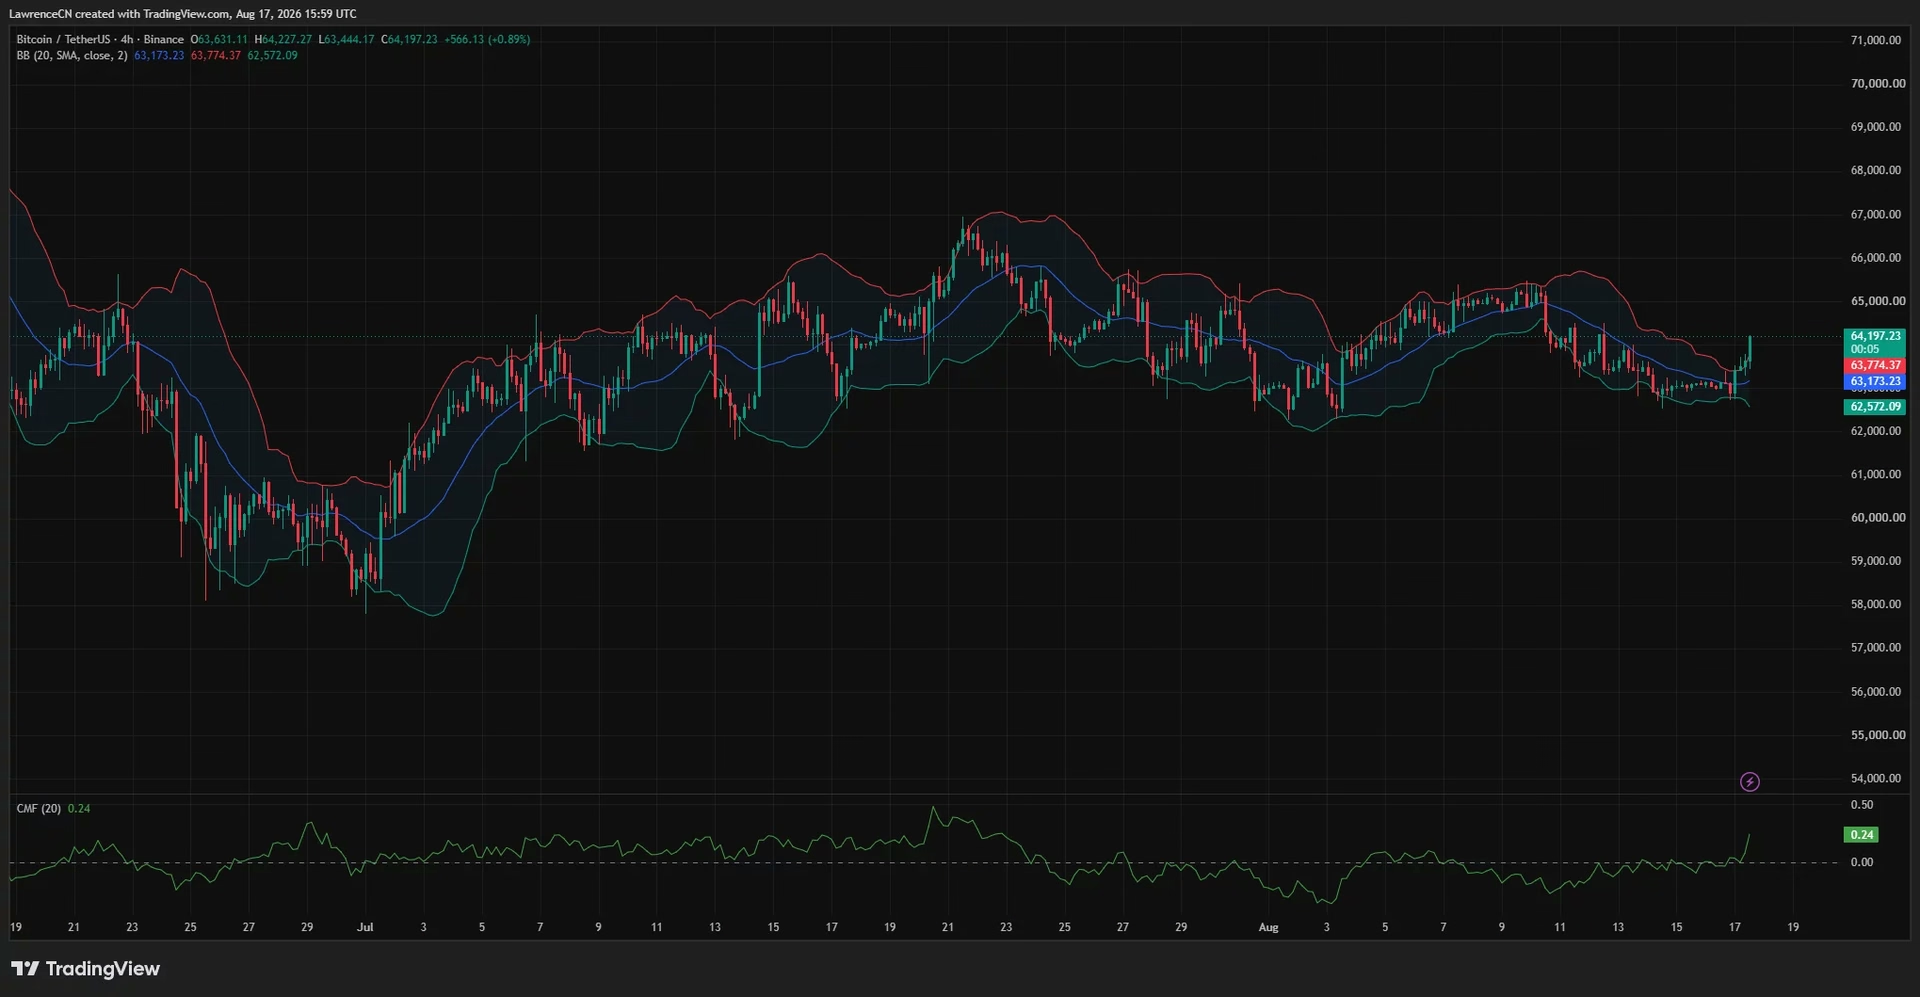
The 4-hour timeframe tells a different story than the daily chart. During the Aug. 17 recovery, Bitcoin moved above the Bollinger Bands' middle line at $63,173 and crossed the upper band near $63,774, indicating accelerating momentum in the short term. The Chaikin Money Flow indicator on the 4-hour chart rose to 0.24, confirming that buying volume supported the rebound.
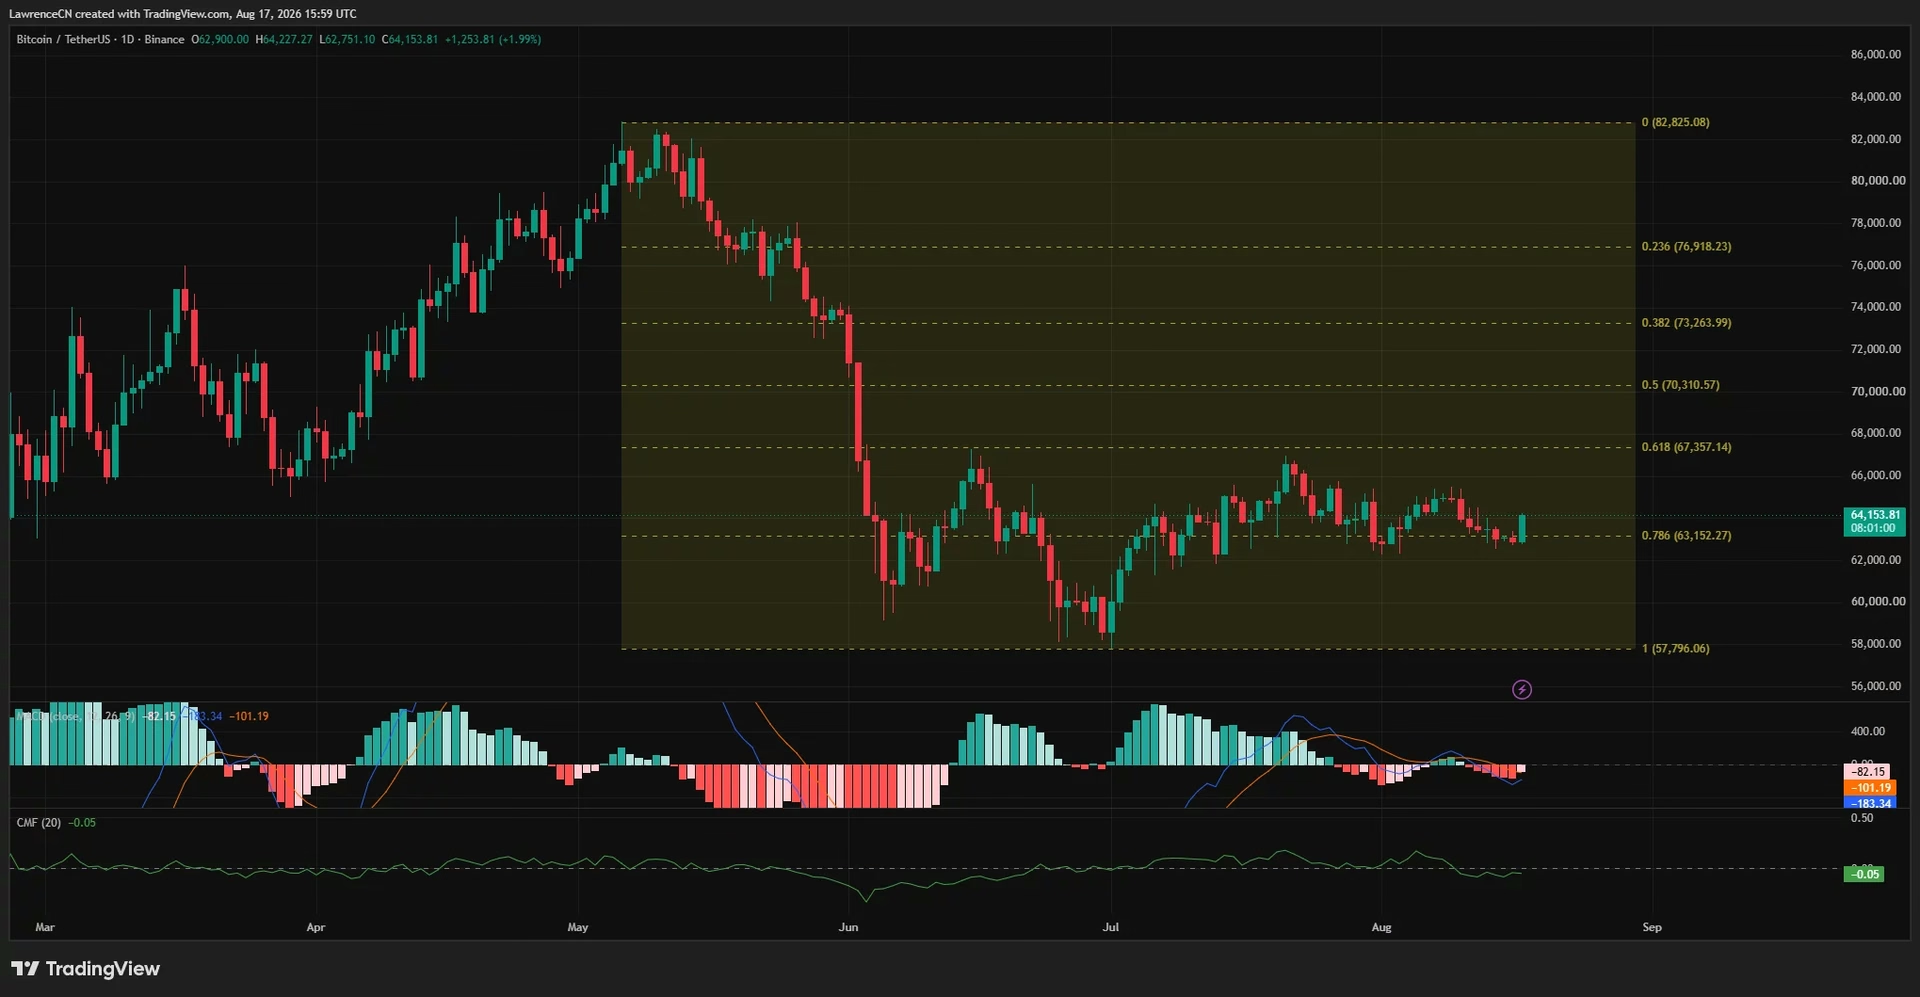
However, the daily chart presents a more cautious picture. The Moving Average Convergence Divergence (MACD) indicator remains below its signal line, with readings near minus 183 compared to a signal-line reading of minus 101. This negative histogram of approximately minus 82 suggests that bearish momentum from the recent decline hasn't fully dissipated.
Daily Chaikin Money Flow also remained slightly negative at minus 0.05, contrasting sharply with the 4-hour reading of positive 0.24. This divergence reveals an important insight: short-term buyers have returned, but broader capital flows remain weak. It's a classic setup where tactical rallies can occur within a larger downtrend.
Liquidation Clusters Define the Trading Range 💥
Liquidation data provides crucial insight into where leveraged traders have positioned themselves. CoinGlass' one-week liquidation heatmap reveals large concentrations of leveraged positions on both sides of Bitcoin's current price level, creating a defined trading corridor.
The nearest strong resistance cluster sits around $64,000, with a larger concentration near $64,700. If Bitcoin pushes through these levels, short sellers would be forced to cover positions, potentially adding significant buying pressure and pushing BTC toward $65,000. The next major upside target sits near $67,357, corresponding with the 61.8% Fibonacci retracement of Bitcoin's decline from $82,825 to $57,796.
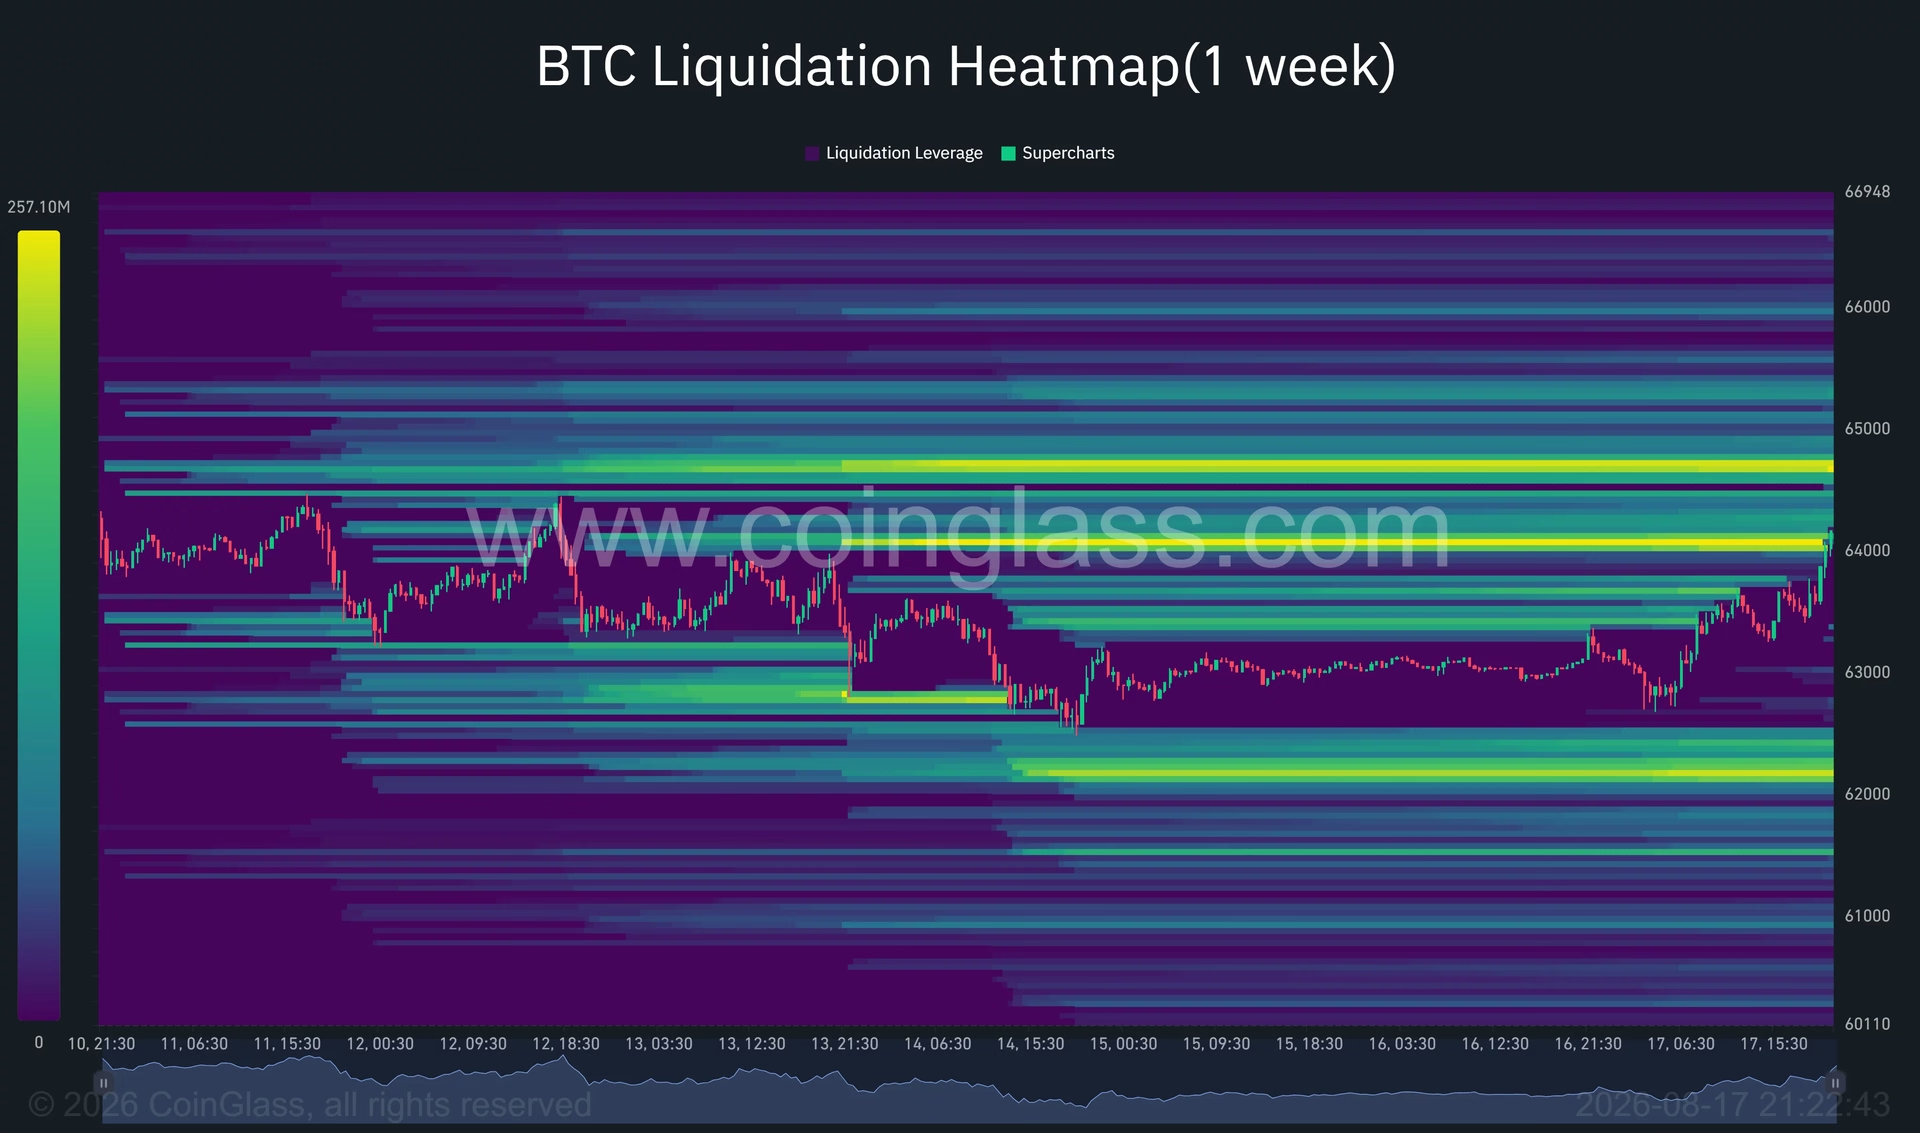
Downside liquidity is concentrated near $62,700 and $62,200. A rejection from current levels could draw Bitcoin back toward these zones and trigger liquidations among leveraged long traders. This creates a near-term trading range of approximately $62,200 to $64,700—a remarkably narrow band for an asset that has historically experienced larger swings.
The Range-Bound Reality 📊
Bitcoin has largely traded between $62,000 and $65,000 since late July, despite several brief excursions outside those levels. This consolidation pattern, combined with the extreme volatility compression, suggests the market is waiting for a catalyst to determine the next major directional move.
The failure to hold above $63,152 would put $62,500 back in focus as support. A deeper breakdown could expose the $60,000 psychological level, while the full retracement low near $57,796 represents the broader bearish level visible on the daily chart.
Macroeconomic Catalysts on the Horizon 🌐
Beyond technical levels and liquidation clusters, broader macroeconomic factors will likely determine Bitcoin's next major move. Mei emphasized that traders should monitor several key developments:
Federal Reserve Policy Signals: The Federal Open Market Committee (FOMC) minutes will provide crucial insights into the Fed's interest-rate outlook. Cryptocurrency markets respond positively to expectations of lower rates or easier financial conditions, which increase liquidity available for risk assets.
The CLARITY Act: This proposed legislation addressing cryptocurrency regulation has created uncertainty that's reportedly held back some large institutional investors. Senate action on the act before their recess could provide clarity that either accelerates institutional adoption or triggers regulatory concerns.
ETF Flows: Exchange-traded fund inflows and outflows continue to influence short-term price action, particularly as institutional capital increasingly enters the crypto space through regulated vehicles.
What This Means for Traders 🎲
The current market setup presents a classic volatility trap scenario. Low implied volatility makes options appear cheap, but realized volatility has fallen even further, meaning options traders are still paying a premium relative to actual price movement. This creates a situation where:
- Short-term traders can exploit tactical bounces within the $62,200–$64,700 range
- Options traders should be cautious about selling volatility at these extreme compression levels
- Long-term investors may benefit from waiting for a clearer directional break before establishing large positions
- Risk management becomes critical, as the next move could be swift and substantial once the volatility trap springs
Key Takeaways and What's Ahead ✨
Bitcoin's recovery to $64,000 represents a tactical bounce rather than a confirmed reversal. The extreme compression in volatility metrics—reaching 91 on Glassnode's trap score—suggests that significant price movement is overdue. However, the direction remains uncertain, with technical indicators providing conflicting signals.
Traders should monitor the FOMC minutes and CLARITY Act developments closely, as these macroeconomic factors could provide the catalyst needed to break Bitcoin out of its narrow trading range. Whether the next major move is higher or lower will likely depend on these broader policy signals rather than technical levels alone.
The coming weeks will be crucial. Bitcoin remains poised between consolidation and volatility expansion, with institutional catalysts potentially triggering the next significant price discovery event. Until then, the $62,200–$64,700 range will likely continue to define near-term trading opportunities.
You May Also Like

Market Analysis
XRP Price Falls 5% as Leverage Hits Seven-Month High
August 26, 2026

Market Analysis
Crypto Market Hits Extreme Greed: What This Means for Bitcoin
August 26, 2026

Market Analysis
Ethereum Price Rally Overheats Below $2,550 Resistance
August 26, 2026

Market Analysis
Hyperliquid Price Rally: HYPE Targets $97 Amid $80 Support
August 25, 2026