Category:
Market AnalysisBitcoin Reclaims $65K Amid Peaceful Market Rally

Bitcoin has once again demonstrated its resilience by reclaiming the $65,000 threshold, buoyed by a resurgence in risk appetite amid geopolitical tranquility. The recent pause in US-Iran tensions has been a key catalyst, influencing both traditional and digital markets.
The Geopolitical Calm: A Catalyst for Cryptocurrency Surge 🌍
In recent days, Bitcoin prices have experienced a notable upswing, coinciding with a temporary ceasefire in the Middle East. The United States and Iran have abstained from direct confrontations, fostering a more optimistic market environment. This geopolitical calm has led to a drop in oil prices, with Brent crude falling by 6.5% to $90.45, thereby reducing anticipated inflationary pressures and supporting broader market recoveries.
Bitcoin's Price Dynamics 📈
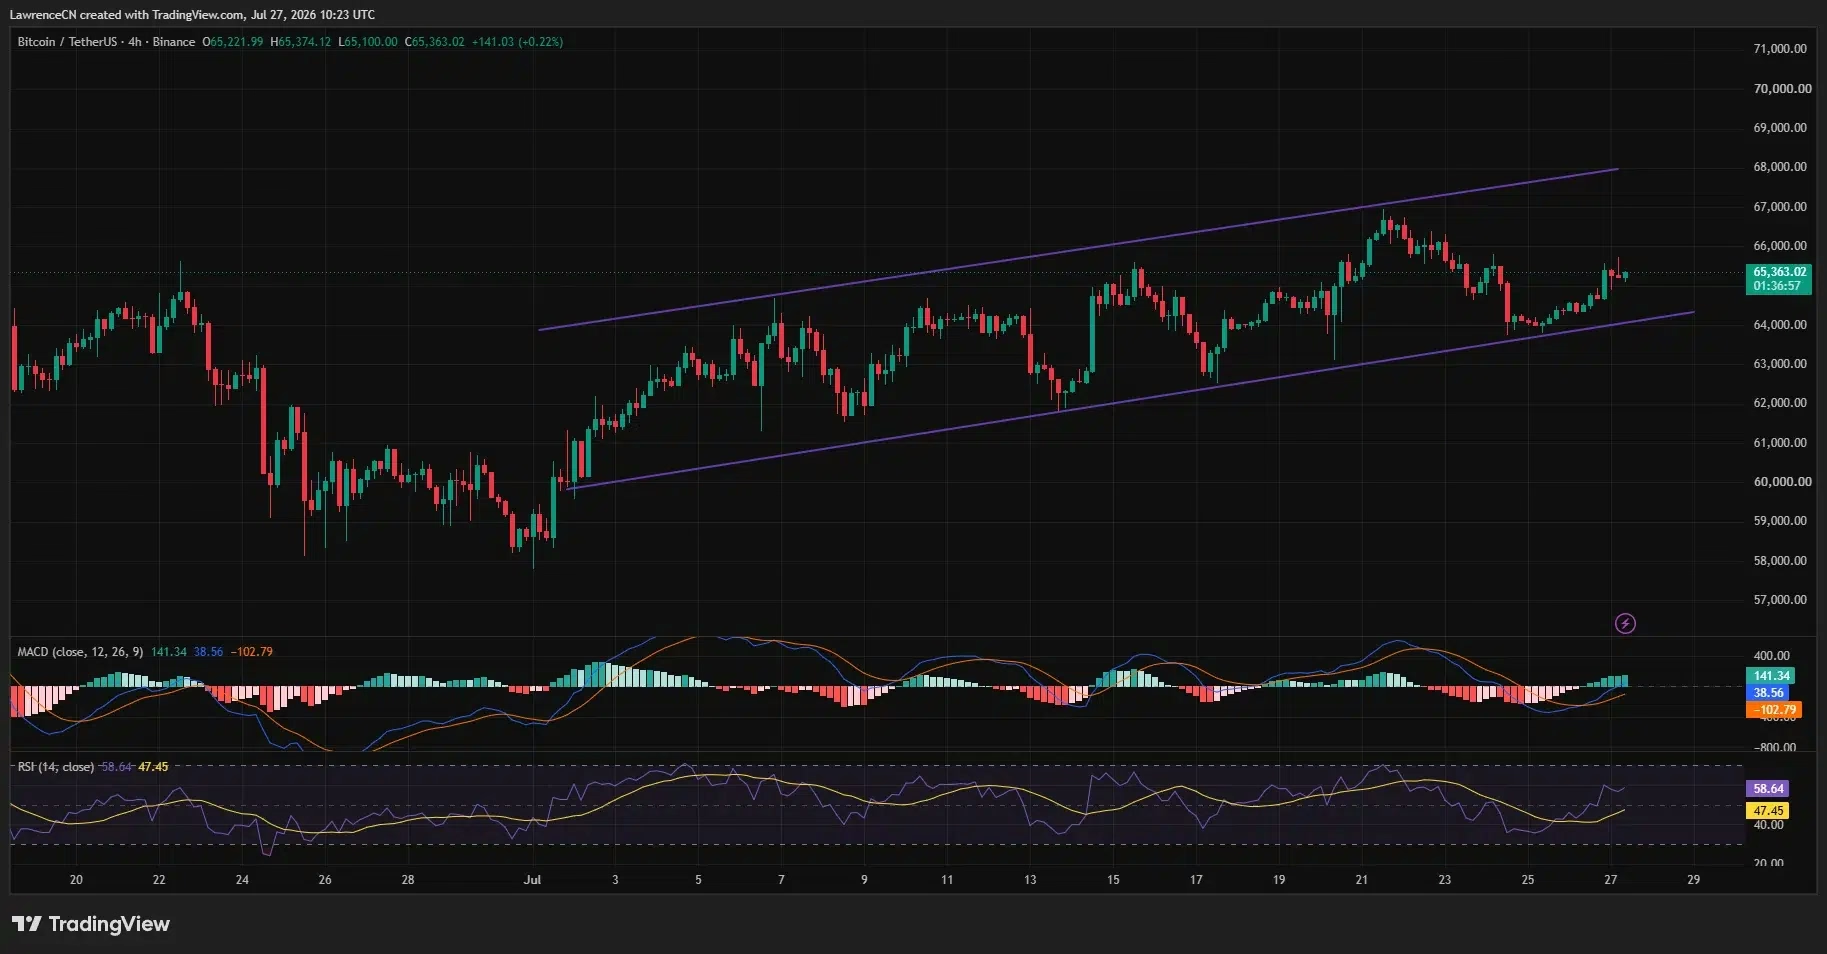
At the time of writing, Bitcoin is trading around $65,386, marking a significant recovery from its previous low of $63,700 on July 25. The four-hour relative strength index (RSI) climbed to 58.64, indicating a bullish momentum that is yet to enter overbought territory.
Technical Indicators Signal Further Gains
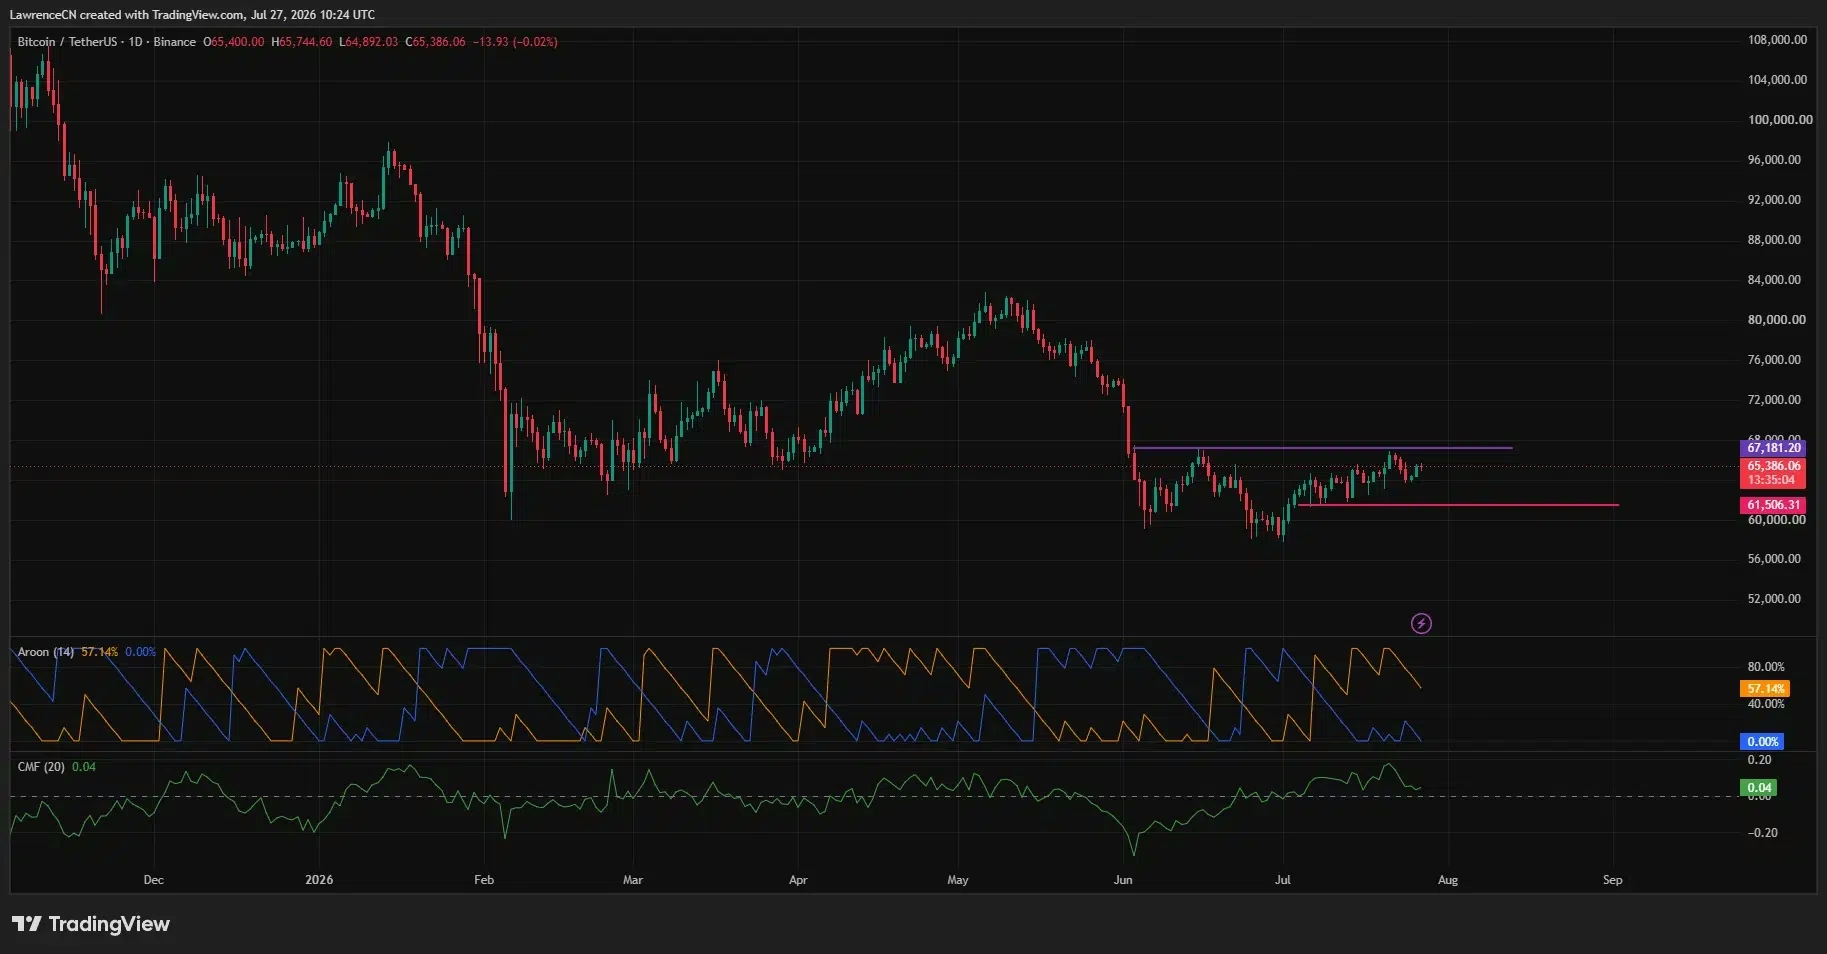
The moving average convergence divergence (MACD) indicator has shown a bullish crossover, with its histogram rising to 141.34. This suggests a potential continuation of the upward trend. However, Bitcoin faces significant resistance at $67,181, a level it must surpass to maintain its upward trajectory.
Market Sentiment and Future Outlook 🔮
The current market sentiment is cautiously optimistic. Bitcoin's price movement remains within an ascending parallel channel, with the lower boundary near $64,000. To sustain the bullish momentum, Bitcoin must break through the resistance at $67,181, after which $68,000 becomes a plausible target.
Potential Risks and Support Levels
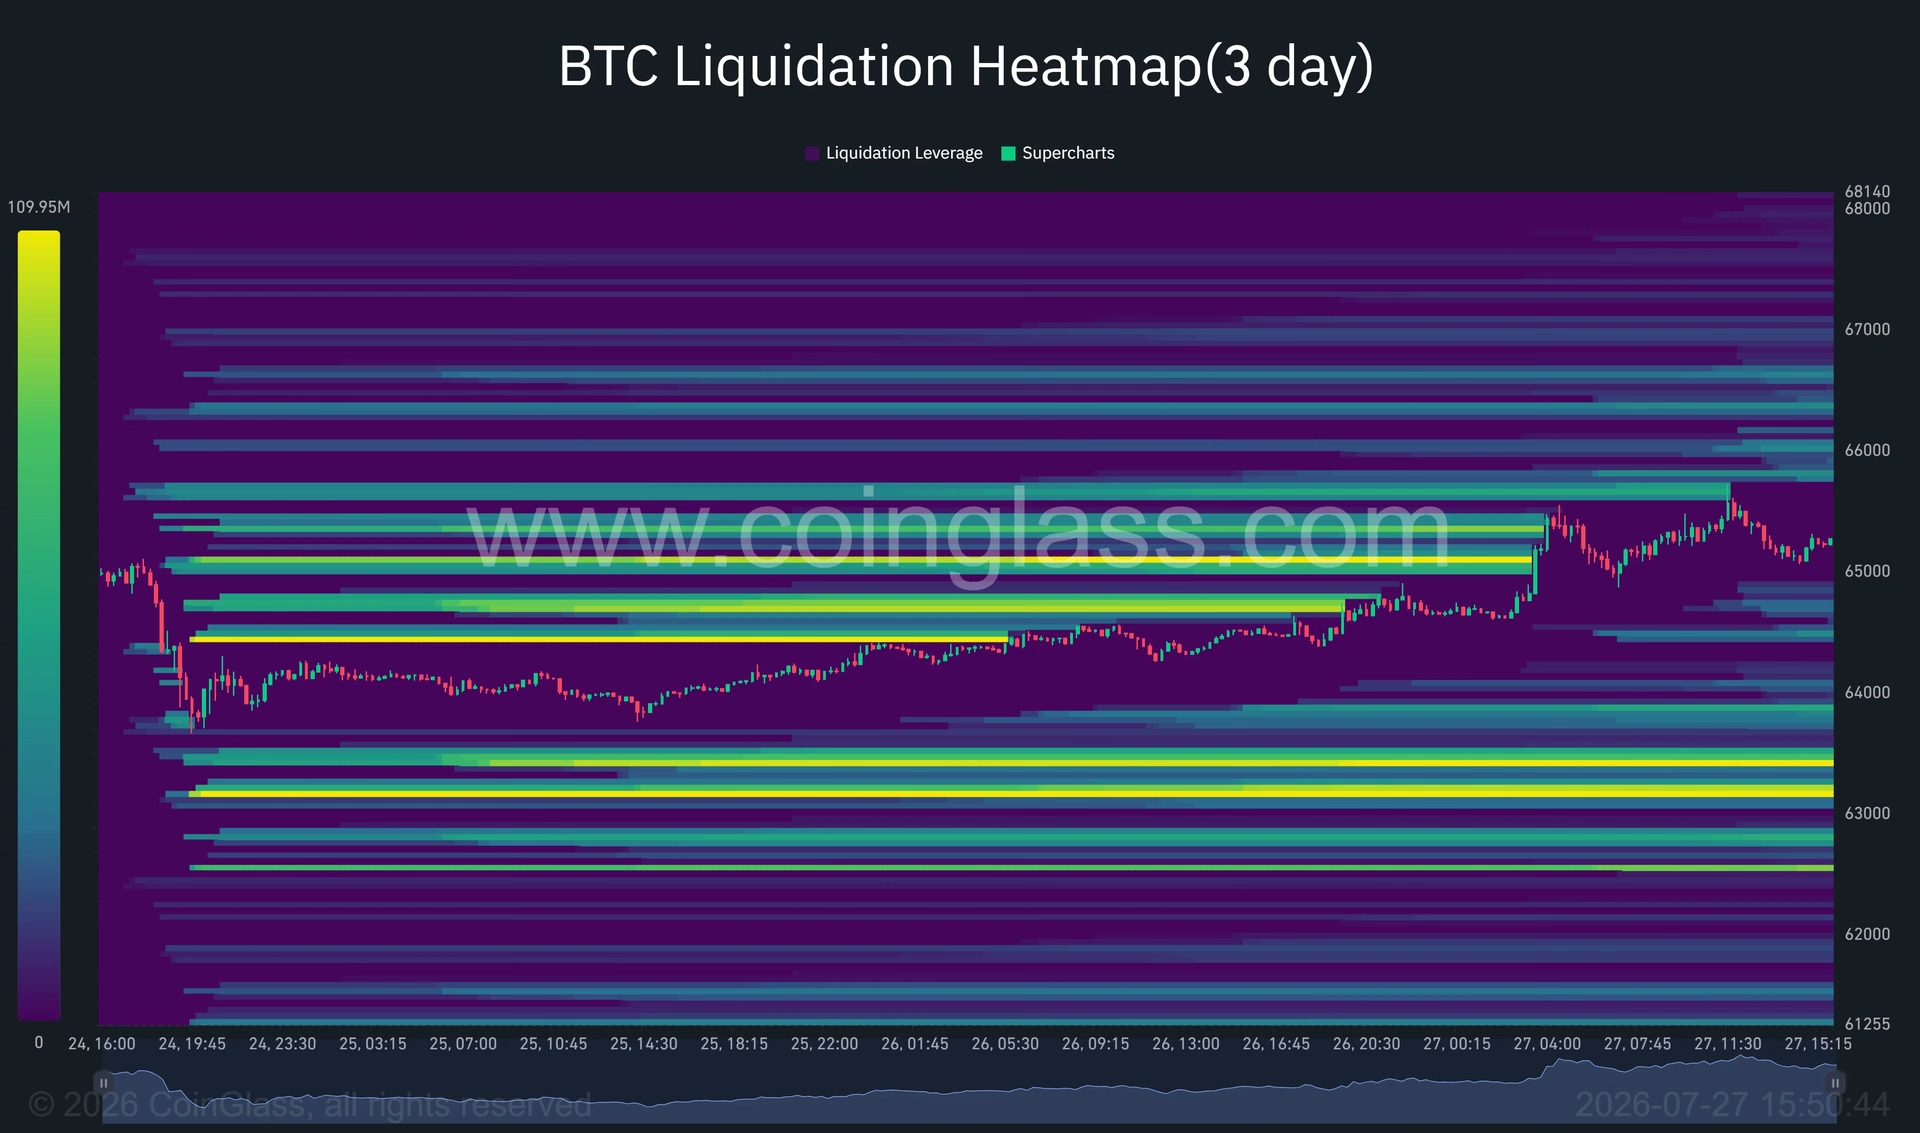
Despite the positive outlook, potential risks linger. If Bitcoin breaks below the channel floor of $64,000, it could test lower support levels around $63,000 to $63,500. This scenario aligns with the liquidation heatmap, which identifies strong downside clusters at these levels.
Broader Market Implications 🌐
The peaceful geopolitical developments have broader implications for risk assets. The drop in oil prices has alleviated some inflationary concerns, providing a more favorable backdrop for both equities and cryptocurrencies. Investors are also eyeing the Federal Reserve's upcoming policy meeting, which could further influence market dynamics.
Institutional Interest and Regulatory Developments
Institutional demand for Bitcoin remains mixed, with recent net inflows recorded despite a backdrop of uneven ETF interest. Furthermore, potential regulatory developments, such as the US CLARITY Act, could serve as additional catalysts for Bitcoin's price movement.
Conclusion: Navigating Bitcoin's Volatile Waters 🌊
As Bitcoin navigates its way through volatile market conditions, the importance of geopolitical stability cannot be overstated. For investors, the key lies in closely monitoring support and resistance levels, as well as staying informed about potential regulatory changes that could impact the market. The road to $68,000 is fraught with challenges, but with the current momentum, Bitcoin may well continue its ascent.
In summary, Bitcoin's ability to reclaim $65K amidst geopolitical calm highlights its potential as a resilient asset in times of uncertainty. As the market evolves, keeping an eye on key technical levels and broader economic indicators will be crucial for investors.
Disclosure: This article is for informational purposes only and does not constitute investment advice.
You May Also Like

Market Analysis
XRP Price Falls 5% as Leverage Hits Seven-Month High
August 26, 2026

Market Analysis
Crypto Market Hits Extreme Greed: What This Means for Bitcoin
August 26, 2026

Market Analysis
Ethereum Price Rally Overheats Below $2,550 Resistance
August 26, 2026

Market Analysis
Hyperliquid Price Rally: HYPE Targets $97 Amid $80 Support
August 25, 2026