Category:
Market AnalysisBitcoin Surges 11% Above $71,000: Market Drivers Explained

Bitcoin's explosive rally in August 2024 sent shockwaves through the cryptocurrency market, with the leading digital asset climbing 11.4% in just 24 hours to breach the $71,000 milestone. This dramatic surge marked Bitcoin's strongest performance in months, reigniting bullish sentiment among investors and traders who had grown weary of the sideways price action that characterized much of the preceding trading period. 🚀
The Perfect Storm: What Triggered Bitcoin's Breakout? 📈
Bitcoin's ascent to $71,920 wasn't driven by a single catalyst but rather a confluence of favorable macroeconomic conditions and market dynamics that aligned at precisely the right moment. The cryptocurrency market operates in complex ecosystems where multiple variables interact simultaneously, and August 2024 demonstrated this principle perfectly.
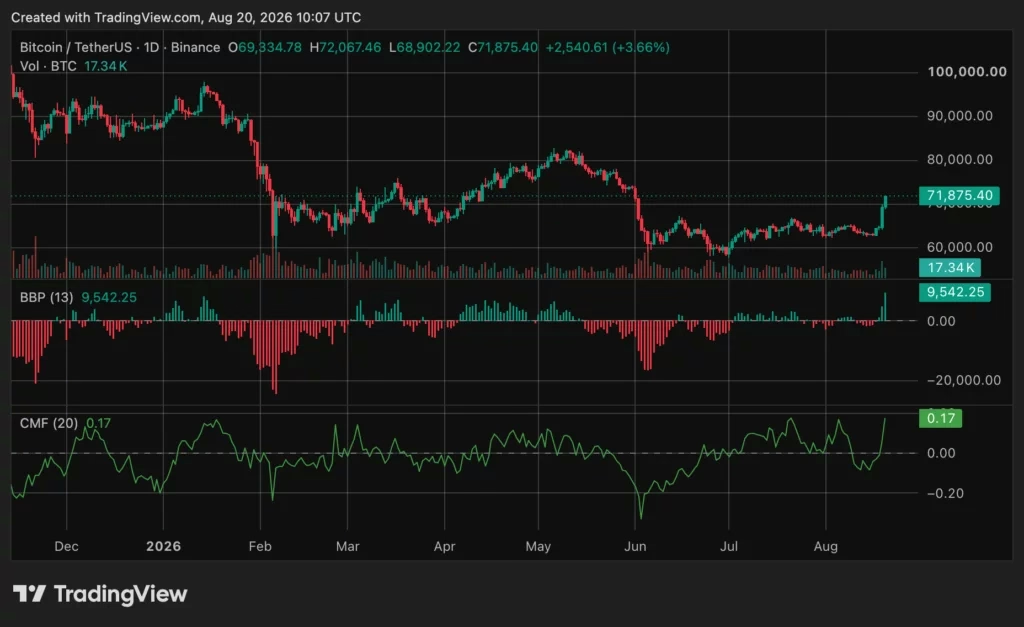
The rally began near $64,400 and rapidly accelerated through key psychological levels—$66,000, $68,000, and finally $70,000—in what can only be described as a textbook breakout move. This wasn't a gradual climb but rather a forceful rejection of lower prices that took Bitcoin to its highest level since early June. The sheer velocity of the move caught many traders off-guard, particularly those positioned for continued weakness.
U.S. Treasury Policy Shifts Market Sentiment 💰
The most significant macro catalyst emerged from an unexpected announcement by the U.S. Treasury Department on August 19. The Treasury revealed plans to double the maximum size of its liquidity support buyback operations for long-dated Treasury securities, increasing the ceiling from $2 billion to at least $4 billion per operation. This change would take effect on September 9 and remain in place through November 4.
While Treasury officials emphasized these operations were designed to support liquidity in aging government securities—and explicitly stated they were not Federal Reserve asset purchases, monetary stimulus, or cryptocurrency investments—the market interpreted the move quite differently.
Here's why this matters for Bitcoin:
- Lower Treasury yields: Long-dated bond yields declined following the announcement, reducing the opportunity cost of holding non-yielding assets
- Dollar weakness: The broader U.S. dollar index weakened as markets repriced expectations around interest rates
- Risk asset rotation: Capital flowed from fixed-income instruments into alternative assets including stocks, precious metals, and cryptocurrencies
- Inflation hedge appeal: Lower real yields made inflation-hedge assets like Bitcoin more attractive on a relative basis
The timing proved instrumental. Treasury policy announcements often move markets in unpredictable ways, but this particular decision created an environment where risk assets could flourish. Bitcoin's correlation with traditional equity markets meant that improved sentiment in one arena typically benefited digital assets.
Spot ETF Demand Reaches Four-Month Peak 📊
Simultaneously, institutional investor interest in Bitcoin surged dramatically. U.S. spot Bitcoin exchange-traded funds recorded $517 million in net inflows on August 19 alone—their strongest single day since May. This represented a remarkable acceleration from the approximately $172 million that flowed into these vehicles throughout the entire month of July.
The significance of this inflow pattern cannot be overstated. ETF flows serve as a barometer for institutional and mainstream investor sentiment toward Bitcoin. The four-month peak in inflows suggested that:
- Professional money managers were repositioning into Bitcoin after months of caution
- Retail investors were gaining confidence in the asset class
- The regulatory environment around spot Bitcoin ETFs had created a legitimate pathway for traditional capital allocation
- Macro conditions were aligning with cryptocurrency investment theses
These inflows provided crucial spot market demand precisely when Bitcoin was breaking through technical resistance levels. The combination of institutional buying pressure and retail enthusiasm created a powerful upward momentum that carried the cryptocurrency higher with each passing hour.
The Leverage Effect: $1 Billion in Short Liquidations 🔥
Perhaps the most dramatic element of Bitcoin's rally involved the forced liquidation of leveraged short positions. Within a single hour as Bitcoin crossed $69,000, more than $1 billion in short positions were forcibly closed by cryptocurrency exchanges.
This phenomenon reveals a crucial dynamic in crypto markets: the role of leverage and derivatives. When traders borrow funds to amplify their positions—whether long or short—exchanges maintain strict collateral requirements. As Bitcoin's price rose rapidly, traders who had bet on further declines found their collateral insufficient to cover potential losses. The exchange's risk management systems automatically liquidated these positions, forcing market purchases that added additional buying pressure.
This created a self-reinforcing feedback loop:
- Bitcoin rises → Short positions become unprofitable → Exchanges liquidate shorts → Forced buying pressure → Bitcoin rises further
This dynamic explains why Bitcoin covered more than $6,000 in price range within several hours rather than grinding upward gradually over days or weeks. The liquidation cascade amplified the initial move, though it's important to note that sustained gains require new demand after the forced purchasing subsides. Liquidations provide temporary acceleration but cannot indefinitely sustain a rally without underlying fundamental support.
Technical Confirmation: Charts Tell the Story 📉
Beyond the fundamental and derivative market drivers, technical analysis provided compelling confirmation of genuine buying pressure. Bitcoin's daily chart exhibited several bullish signals:
Volume Confirmation: The breakout above the $60,000 to $66,000 consolidation range occurred on notably increased volume, providing stronger technical validation than a low-volume move through resistance would have offered. High volume breakouts suggest conviction among market participants.
Momentum Indicators: The Bull Bear Power reading surged to approximately 9,542, reflecting a sharp acceleration in bullish momentum. Simultaneously, the Chaikin Money Flow indicator stood near 0.17, indicating that buying volume substantially exceeded selling volume during the measurement period.
Moving Average Dynamics: Bitcoin reclaimed territory above its bull market support band and challenged the area around its daily 200-day moving average and exponential moving average—both crucial technical levels that often determine trend direction.
These technical indicators collectively painted a picture of genuine buying pressure rather than a manipulated or artificial move. The chart setup had been constructive for weeks, but the catalyst provided by Treasury policy and ETF inflows finally triggered the breakout that technical analysts had been anticipating.
Critical Price Levels Define the Path Forward 🎯
With Bitcoin establishing a new two-month high, market participants immediately focused on identifying key resistance and support levels that would define the next phase of the rally.
The $70,000 Breakout Level: This area represents the first critical support zone. Holding above $70,000 would transform the former resistance into potential support, reducing the risk that August's rally becomes merely a short-lived spike. Technical analysts emphasized the importance of a weekly close above $70,000 to maintain stronger upside momentum.
The $72,000 Resistance Zone: Analysts identified the $72,000 region as the next substantial hurdle, coinciding with the short-term holder cost basis near $72,200 identified by Glassnode research. A sustained move beyond this zone could open pathways toward $75,000 and ultimately the upper portion of the broader $60,000 to $80,000 trading range near $80,000.
Downside Protection Levels: Should Bitcoin fail to hold $70,000, traders would likely see a retest of $68,000, where buyers had successfully defended prices during the initial pullback. Below that level, the previous breakout area between $65,000 and $66,000 would become critical support.
Market Context: Bitcoin's Structural Position 💡
Understanding Bitcoin's rally requires context about where the asset had been trading prior to August 2024. The cryptocurrency had remained structurally vulnerable below key cost bases during its recovery phase, meaning that selling pressure from investors who had purchased at higher prices persisted. Bitcoin's market capitalization reached approximately $1.44 trillion following the rally, yet many investors remained underwater on their positions.
This dynamic creates a crucial insight: the path to new all-time highs requires not just momentum but also the absorption of substantial selling pressure from earlier buyers. Bitcoin's rally in August demonstrated that this absorption was finally beginning to occur, though sustained strength would require continued evidence of new demand.
What This Means for Cryptocurrency Markets 🌍
Bitcoin's 11% surge carries implications far beyond the asset itself. Historically, Bitcoin's price movements correlate strongly with altcoin performance, meaning that Bitcoin's breakout typically precedes broader cryptocurrency market rallies. The surge in spot ETF inflows suggests that institutional capital is rotating back into digital assets after months of caution, potentially signaling a shift in macro sentiment.
The Treasury policy announcement also raises interesting questions about central bank digital currencies, monetary policy frameworks, and the role of alternative assets in portfolios facing persistent inflation concerns. As traditional fixed-income instruments offer diminishing real returns, investors increasingly turn to assets like Bitcoin that offer different risk-return characteristics.
The Road Ahead: Maintaining Momentum 🚀
Bitcoin's challenge now involves consolidating gains and proving that the August rally represents the beginning of a sustained uptrend rather than a temporary spike. Several factors will determine success:
- Continued ETF inflows: Institutional demand must persist beyond the initial surge
- Technical support holding: Bitcoin must defend $70,000 and higher levels to maintain credibility
- Macro stability: Treasury markets and the U.S. dollar must remain supportive of risk assets
- Derivative market health: Excessive leverage accumulation could create vulnerability to sudden liquidations
The cryptocurrency market operates in constant evolution, with new variables continuously influencing price discovery. August 2024's rally demonstrated that when macro conditions align with technical setups and institutional demand, Bitcoin can move decisively higher. The question now becomes whether this momentum persists or whether the rally represents merely a temporary relief bounce within a broader consolidation.
Key Takeaways 📌
Bitcoin's 11% surge above $71,000 resulted from a powerful combination of factors: U.S. Treasury policy shifts that reduced the appeal of traditional fixed-income assets, institutional investor inflows through spot ETFs reaching four-month peaks, and the forced liquidation of leveraged short positions that amplified upward momentum. Technical indicators confirmed genuine buying pressure, while critical price levels at $70,000 and $72,000 now define the path forward. As cryptocurrency markets continue evolving, Bitcoin's ability to sustain these gains will depend on whether the fundamental drivers persist or whether profit-taking reverses the advance.
You May Also Like

Market Analysis
XRP Price Falls 5% as Leverage Hits Seven-Month High
August 26, 2026

Market Analysis
Crypto Market Hits Extreme Greed: What This Means for Bitcoin
August 26, 2026

Market Analysis
Ethereum Price Rally Overheats Below $2,550 Resistance
August 26, 2026

Market Analysis
Hyperliquid Price Rally: HYPE Targets $97 Amid $80 Support
August 25, 2026