Category:
Market AnalysisBitcoin Surges Past $65K as Traders Eye Critical CPI Report

The $65,000 Milestone: Bitcoin's Latest Test 🚀
Bitcoin demonstrated remarkable resilience in early August trading, briefly breaking through the psychologically significant $65,000 barrier before settling into consolidation territory. This price action marked a crucial moment for the cryptocurrency market, as institutional and retail investors alike reassessed their positions amid shifting macroeconomic signals from the United States.
The digital asset's ability to approach and test $65,000 represented more than just another price level—it reflected growing confidence among market participants that the worst of the recent volatility had passed. Over a seven-day period, Bitcoin gained 3.4%, signaling renewed bullish sentiment after weeks of uncertainty dominated the cryptocurrency landscape.
Understanding the Macro Backdrop: Why Inflation Data Matters 📊
The trajectory of Bitcoin prices increasingly hinges on U.S. Federal Reserve policy decisions, which themselves depend heavily on inflation data. The Consumer Price Index report scheduled for mid-August represented the most immediate catalyst that could either accelerate or derail Bitcoin's upward momentum.
Economists anticipated July headline inflation would decelerate to 3.4% annually, down from the previous month's reading. This expectation alone shifted market sentiment noticeably. If inflation continued cooling, the narrative would strengthen that the Federal Reserve might pause its interest rate hiking campaign—a development historically favorable for risk assets like Bitcoin.
Employment Data Shifts Rate Expectations 💼
Friday's employment report provided the initial catalyst for Bitcoin's recovery toward $65,000. The U.S. economy shed 23,000 nonfarm payroll jobs in July, a surprisingly weak figure that caught many forecasters off-guard. More troubling for Fed hawks were the downward revisions to previous months—May's figures were reduced by 66,000 jobs while June lost 37,000 from initial estimates.
These employment headwinds immediately altered market expectations regarding Federal Reserve policy. Traders rapidly reduced their probability estimates for another rate increase, with futures markets showing the probability of a September hike plummeting from 67% to 44% within just one week.
Bitcoin responded predictably to this shift. The cryptocurrency gained nearly 2% immediately following the jobs report as investors interpreted the data as reducing pressure on the Federal Reserve to continue tightening monetary policy. This relationship between employment weakness and Bitcoin strength reflects the asset's sensitivity to interest rate expectations—lower rates typically reduce the opportunity cost of holding non-yielding assets like Bitcoin.
Institutional Capital Flows: A Bullish Signal 💰
Beyond price action, institutional adoption metrics painted an encouraging picture. U.S. spot Bitcoin exchange-traded funds attracted substantial inflows during the week of August 3-7, with data providers reporting approximately $854 million in net capital flows into these products.
BlackRock's iShares Bitcoin Trust (IBIT) led the charge, accounting for roughly $694 million of total inflows. This performance represented a significant reversal from the tepid fund flows observed at the end of July, suggesting that professional investors were regaining confidence in Bitcoin's near-term prospects.
The timing of these inflows proved particularly noteworthy. Institutional capital typically flows into Bitcoin during periods when technical indicators suggest improving momentum but before prices have fully recovered from recent weakness. This pattern suggests sophisticated investors were positioning themselves ahead of the CPI report, betting that inflation data would support the Fed pause narrative.
Technical Analysis: The $65,000-$65,800 Range 📈
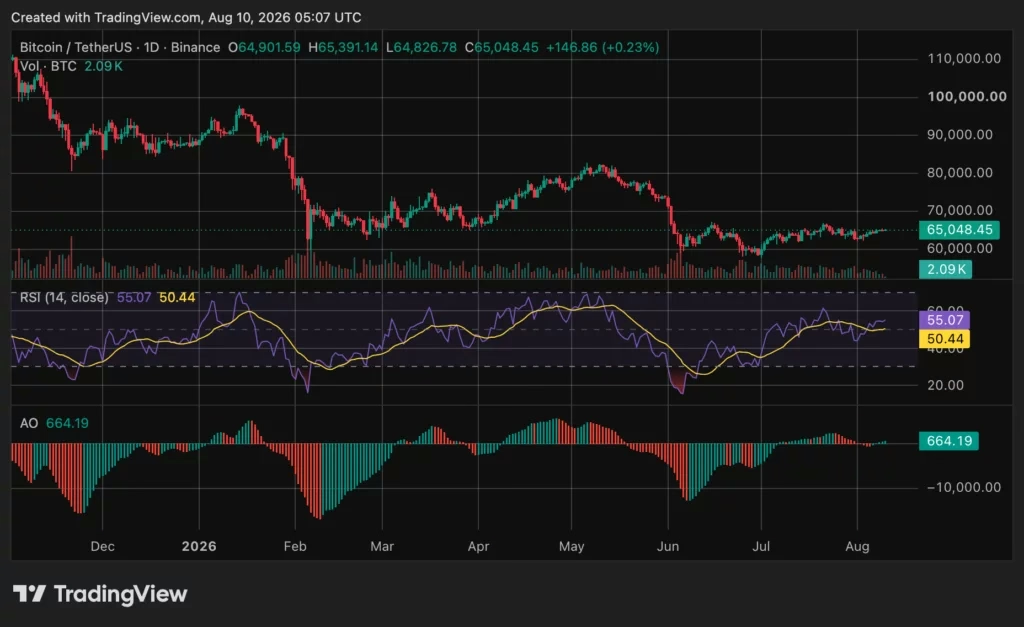
From a technical perspective, Bitcoin faced clearly defined resistance between $65,000 and $65,800. Analysts identified this zone as containing significant liquidation liquidity—essentially, a concentration of stop-loss orders that could trigger cascading selling if Bitcoin failed to break higher.
The Relative Strength Index (RSI) reading of 55.07 indicated moderate bullish momentum without suggesting overbought conditions. This technical setup proved optimal for sustained upside movement. The indicator remained above its 50-level moving average, confirming that buyers maintained a slight edge, yet RSI's distance from overbought territory (typically 70+) suggested considerable room for further appreciation without encountering technical exhaustion.
The Awesome Oscillator reinforced this bullish-but-not-stretched picture, registering positive readings with relatively modest histogram bars compared to readings during stronger directional moves. This configuration suggested momentum was improving in a controlled manner rather than accelerating recklessly toward potential reversal.
Technical analysts identified $65,800 as the critical breakout level. Successfully clearing this resistance could potentially trigger a rally toward $73,700, according to some market observers who noted bullish divergences in longer-duration RSI and MACD readings. However, these remained technical targets rather than confirmed price objectives, and Bitcoin still needed to overcome the identified resistance zones.
The CPI Report: Bitcoin's Next Major Test ⏰
Wednesday's inflation report represented the most significant near-term catalyst for Bitcoin price direction. The stakes were high: a hotter-than-expected CPI reading could reignite expectations for another Federal Reserve rate increase, potentially pressuring risk assets including cryptocurrencies. Conversely, a softer reading would reinforce the narrative established by weak employment data, though it wouldn't guarantee a Bitcoin breakout.
Core inflation expectations proved particularly important. Economists surveyed by Reuters anticipated core CPI would decelerate to 2.5% annually, approaching the Federal Reserve's 2% target. Achieving this level would suggest inflation pressures were genuinely moderating rather than simply reflecting base effects from prior year comparisons.
The Federal Reserve faced a complex decision environment. While the central bank held rates steady at the 3.50%-3.75% range in late July, three voting officials had still preferred a 25 basis point increase. This split suggested ongoing policy divisions, with the Committee's next scheduled meeting not until September 15-16. Additional economic data between early August and mid-September would inform that decision.
Energy Markets and Global Uncertainty 🌍
Bitcoin's price environment extended beyond purely U.S.-centric considerations. Brent crude oil rose 1% to $84.40 during the period under review, reflecting ongoing uncertainty around shipping through the Strait of Hormuz. Energy price volatility historically correlates with broader risk sentiment and can influence inflation expectations.
The U.S. 10-year Treasury yield hovered near 4.66%, a level that influenced Bitcoin's attractiveness relative to fixed-income alternatives. As long-term Treasury yields remained elevated, the opportunity cost of holding non-yielding Bitcoin increased, potentially capping upside enthusiasm among rate-sensitive investors.
What Traders Should Watch Going Forward 🔍
Bitcoin's immediate challenge remained narrow but significant: maintaining support around $65,000 while attempting to break through the $65,800 resistance level. This technical battle would likely dominate price action until the CPI report provided fresh macroeconomic direction.
Key levels to monitor:
- $65,000-$65,500: Primary support and resistance zone with significant liquidation liquidity
- $65,800: Critical breakout level identified by technical analysts
- $73,700: Potential target if $65,800 resistance clears decisively
- $62,500: Support level from early August trading
The Broader Context: Bitcoin's Recovery Path 📉➡️📈
Despite the optimistic price action near $65,000, Bitcoin remained approximately 48% below its October 2023 record high. This context reminded investors that the cryptocurrency remained in a recovery phase rather than establishing new all-time highs. The path forward depended heavily on whether the Federal Reserve could successfully engineer the "soft landing" scenario that markets increasingly priced in.
Historically, Bitcoin has performed well during periods of monetary easing or when interest rate expectations shift downward. The current environment potentially offered both conditions, provided inflation data cooperated with the Fed pause narrative.
Conclusion: Patience and Preparation 🎯
Bitcoin's break above $65,000 represented a meaningful technical achievement, but the cryptocurrency's ultimate direction hinged on macroeconomic factors largely outside the crypto market's control. The CPI report would provide crucial clarity on whether the Federal Reserve could indeed pause its rate hiking cycle.
Investors should approach this period with measured expectations. While the technical setup appeared constructive and institutional capital flows suggested professional confidence, Bitcoin still needed to navigate clearly defined resistance levels. The coming weeks would likely prove pivotal in determining whether Bitcoin could establish a sustainable recovery or whether it would face renewed headwinds from persistent inflation concerns.
For traders and long-term holders alike, the focus should remain on macroeconomic data, Fed policy signals, and technical price structure rather than short-term noise. The $65,000 level marked an important waypoint in Bitcoin's journey, but the ultimate destination remained dependent on the broader economic backdrop that central banks navigate.
You May Also Like

Market Analysis
XRP Price Falls 5% as Leverage Hits Seven-Month High
August 26, 2026

Market Analysis
Crypto Market Hits Extreme Greed: What This Means for Bitcoin
August 26, 2026

Market Analysis
Ethereum Price Rally Overheats Below $2,550 Resistance
August 26, 2026

Market Analysis
Hyperliquid Price Rally: HYPE Targets $97 Amid $80 Support
August 25, 2026