Category:
Market AnalysisBitcoin Surges Past $80,000: What's Driving the Momentum

Bitcoin has achieved a significant milestone, breaking through the $80,000 barrier for the first time in nearly 15 weeks. This breakthrough represents far more than just a number—it signals a dramatic shift in market sentiment and renewed institutional confidence in the world's leading cryptocurrency. 🚀
The Rally That Changed Everything 📈
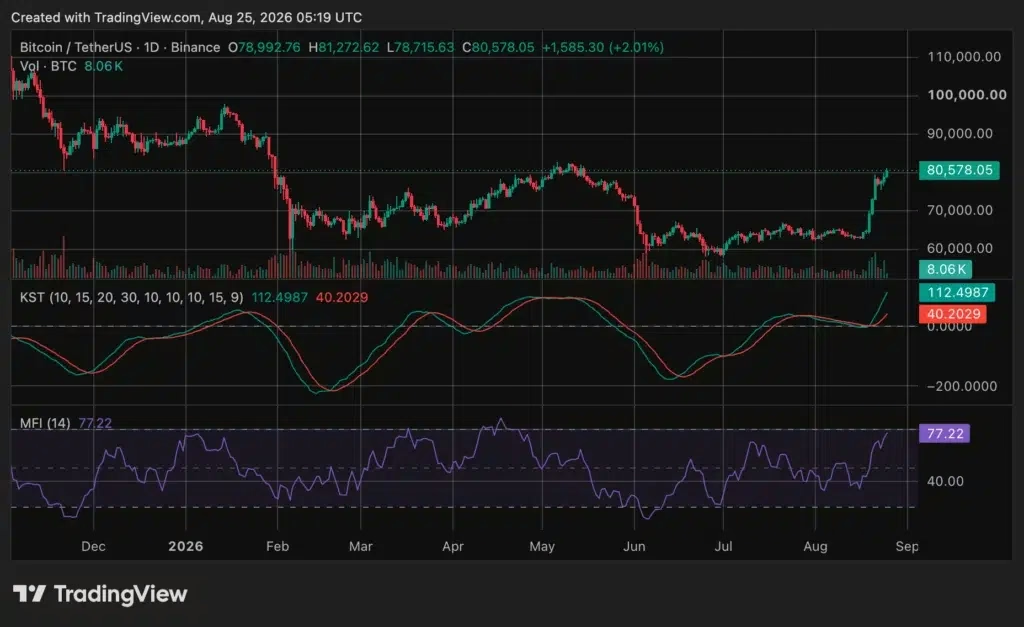
The cryptocurrency experienced an extraordinary eight-day surge, gaining approximately 28% and reaching intraday highs above $81,000. What makes this advance particularly noteworthy is its magnitude relative to recent market conditions. Bitcoin has recovered roughly 38% from its July low near $57,700, effectively erasing the losses that had accumulated since May.
This recovery has injected approximately $350 billion back into Bitcoin's market capitalization—a staggering figure that underscores the scale of the move. For context, this represents more wealth creation than the entire GDP of many nations, demonstrating Bitcoin's increasing integration into global financial markets.
ETF Inflows: The Institutional Vote of Confidence 💼
One of the most compelling narratives behind Bitcoin's ascent involves the behavior of institutional investors. U.S.-listed spot Bitcoin exchange-traded funds recorded approximately $1.92 billion in net inflows during the week ending August 21—their strongest weekly intake since October 2025.
This institutional enthusiasm matters significantly. When traditional investment vehicles like spot ETFs attract capital at this velocity, it signals genuine confidence rather than speculative fervor. BlackRock's iShares Bitcoin Trust accounted for a substantial portion of these inflows, reflecting how major asset managers are positioning their portfolios.
The consecutive five-day inflow streak demonstrates sustained institutional demand, which typically provides more durable price support than retail-driven rallies. This distinction is crucial for understanding whether the current price level can hold long-term.
Technical Resistance: The $80,000-$82,000 Zone 🎯
While Bitcoin's breakthrough past $80,000 represents a psychological victory, technical analysts have identified a critical resistance zone between $80,000 and $82,000. This area represents the upper boundary of Bitcoin's May trading range and serves as the immediate test for bulls.
A sustained close above $82,000 would confirm that demand remains robust following the rapid recovery. Conversely, failure to maintain this breakout could trigger consolidation toward support levels near $76,000 or $78,000. The stakes are high: this resistance area previously attracted heavy selling pressure, suggesting that bears remain positioned at these levels.
The technical picture reveals an interesting dynamic. Bitcoin's 50-week exponential moving average now serves as a crucial support level, with only a narrow margin separating price from this indicator. Technical analysts have noted that a failed retest of this average could transform the current rally into another temporary relief bounce—a scenario that would undermine bullish conviction.
Momentum Indicators Flash Caution Signals ⚡
While the price action appears decidedly bullish, momentum indicators are sending mixed messages that sophisticated traders cannot ignore. The Know Sure Thing indicator reached 112.50, well above its signal line of 40.20, confirming that upward momentum has accelerated significantly.
However, the Money Flow Index presents a more cautionary reading at 77.22—dangerously close to the conventional overbought threshold of 80. This elevated reading indicates strong capital inflows but simultaneously suggests that the rally may be stretched from a momentum perspective. Historically, when Money Flow Index readings approach or exceed 80, the probability of short-term consolidation or pullback increases substantially.
These technical conditions create what traders call a "stretched rally"—one with powerful momentum but limited room for further acceleration before a pause becomes inevitable.
The Treasury Buyback Effect 💰
The timing of Bitcoin's rally coincides intriguingly with a significant policy announcement from the U.S. Treasury. On August 19, the Treasury announced an expansion of its planned buybacks for longer-dated government securities, increasing the maximum size of certain liquidity-support operations from $2 billion to at least $4 billion.
These operations will run from September 9 through November 4, representing a substantial liquidity injection into financial markets. While no government agency has explicitly stated that Treasury buybacks directly caused Bitcoin's rally, the announcement initially pushed longer-term yields lower and improved investor expectations regarding market liquidity.
This macroeconomic backdrop matters because Bitcoin and other risk assets typically perform better when liquidity conditions improve and real interest rates decline. The Treasury's commitment to larger buybacks essentially signals confidence in financial market stability—a sentiment that extends to alternative assets like cryptocurrency.
Liquidation Cascades: The Double-Edged Sword 🔄
The initial acceleration of Bitcoin's move also benefited from forced liquidations of short positions. Traders who had bet on lower prices were compelled to purchase Bitcoin as the market rose, creating a self-reinforcing cycle that accelerated the advance.
This dynamic, while powerful in the short term, presents a critical consideration: buying pressure generated by forced liquidations may not provide lasting support. When the liquidation cascade concludes, the market must rely on genuine spot demand and ETF inflows to sustain higher prices. This distinction separates temporary rallies from sustainable bull markets.
Macroeconomic Headwinds on the Horizon 🌪️
Bitcoin's ability to maintain its $80,000 level faces an important test from macroeconomic data. The Bureau of Economic Analysis released July personal income, spending, and PCE inflation figures, with the PCE price index representing the Federal Reserve's preferred inflation gauge.
Inflation readings stronger than expected could lift Treasury yields and reduce demand for risk assets including Bitcoin. Conversely, softer data could support expectations for easier financial conditions and continued institutional rotation into alternative assets. This macroeconomic sensitivity underscores how Bitcoin's evolution as an asset class has made it increasingly responsive to traditional economic indicators.
What Happens Next? The Critical Questions 🔮
Several scenarios could unfold from current levels:
-
Bullish Scenario: Bitcoin sustains above $82,000, confirming the breakout and potentially targeting higher resistance levels. Continued ETF inflows and improving macroeconomic sentiment would support this outcome.
-
Consolidation Scenario: Bitcoin consolidates between $76,000 and $82,000, building a stronger base before attempting another advance. This would represent healthy market behavior and reduce overbought conditions.
-
Bearish Scenario: A failed retest of the 50-week exponential moving average transforms the rally into another temporary relief bounce, similar to previous false breakouts. This would require a weekly close below the moving average to confirm.
Key Takeaways for Investors 📌
Bitcoin's surge past $80,000 reflects genuine institutional interest evidenced by record ETF inflows, improved macroeconomic liquidity conditions, and technical momentum. However, the rally has reached levels where overbought indicators suggest caution is warranted.
The $80,000-$82,000 resistance zone represents the critical battleground for determining whether this advance represents the beginning of a sustained bull market or another temporary relief rally. Investors should monitor ETF inflows, technical support levels, and macroeconomic data closely in the coming weeks.
The confluence of factors supporting Bitcoin's rally—institutional adoption, improving liquidity conditions, and technical momentum—suggests that the cryptocurrency market has entered a new phase. Whether this phase represents a durable bull market or a more temporary phenomenon will depend on whether bulls can maintain conviction above key resistance levels and whether institutional demand remains robust through inevitable pullbacks. 🎯
You May Also Like

Market Analysis
XRP Price Falls 5% as Leverage Hits Seven-Month High
August 26, 2026

Market Analysis
Crypto Market Hits Extreme Greed: What This Means for Bitcoin
August 26, 2026

Market Analysis
Ethereum Price Rally Overheats Below $2,550 Resistance
August 26, 2026

Market Analysis
Hyperliquid Price Rally: HYPE Targets $97 Amid $80 Support
August 25, 2026