Category:
Market AnalysisBitcoin Targets $68K as Bulls Test $65K Resistance

Bitcoin's recent price action has captured the attention of traders and investors worldwide, with the leading cryptocurrency approaching a critical technical juncture. 🚀 As bulls push toward the $65,000 resistance level, market participants are closely monitoring whether the digital asset can break through to unlock the next leg of its recovery toward $68,000 and beyond.
Bitcoin's Recovery Momentum Builds 📈
The cryptocurrency market witnessed a notable shift in early August as Bitcoin rallied approximately 4% from its low of $62,300, demonstrating renewed buying interest among market participants. This recovery gained traction as geopolitical tensions eased, particularly following progress in negotiations between Iran and Oman regarding the Strait of Hormuz shipping route. The development signaled potential relief from energy supply concerns that had weighed on risk assets.
Trading around $64,615 at the time of analysis, Bitcoin's trajectory reflects a delicate balance between bullish momentum and technical resistance levels. The recovery, while modest compared to broader equity market gains, suggests that institutional and retail buyers are gradually returning to accumulate positions at these levels.
Technical Analysis: The $65,000 Decision Point 🎯
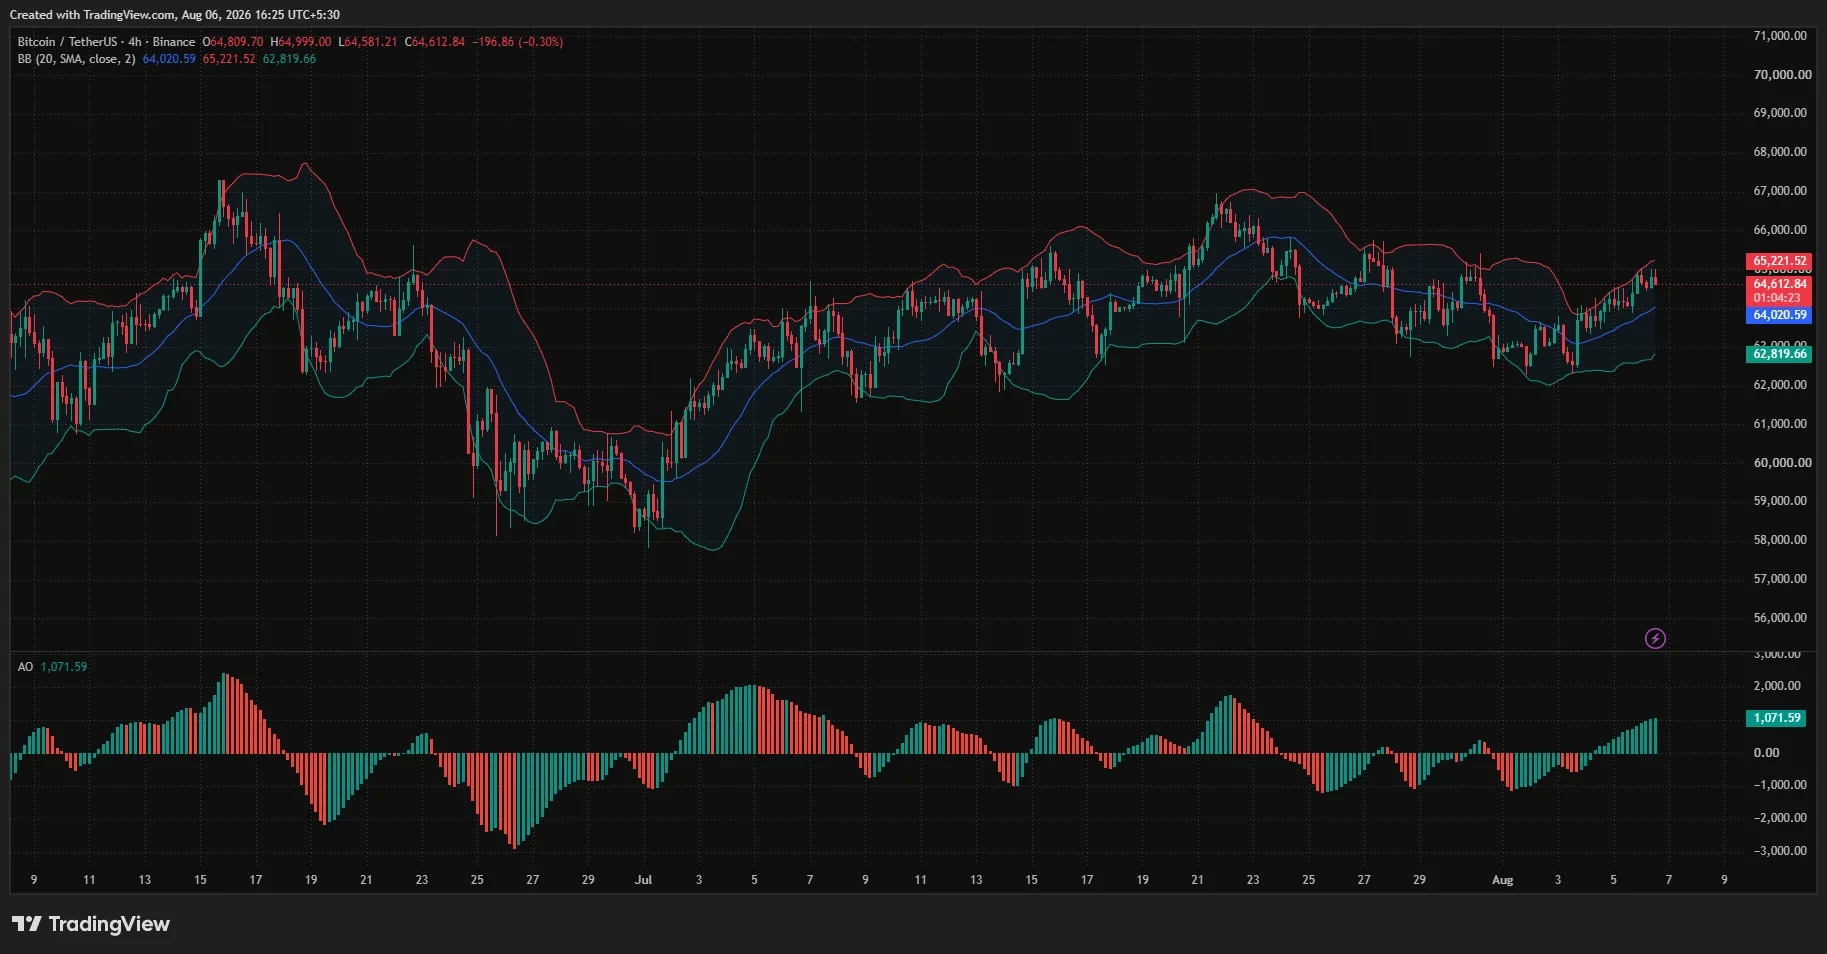
From a technical perspective, Bitcoin stands at a crucial inflection point. The 4-hour chart reveals that the upper Bollinger Band sits at $65,221, creating a defined resistance zone that has repeatedly challenged buyers. This level represents more than just a statistical boundary—it's where significant liquidation clusters have accumulated, making it a focal point for traders managing leveraged positions.
The Awesome Oscillator has climbed to 1,071 with expanding green bars, indicating strengthening bullish momentum despite Bitcoin's rejection from its intraday high. This technical indicator suggests that buying pressure is building beneath the surface, even as the price consolidates near resistance.
Key technical levels to monitor:
- $65,000–$65,220: Immediate resistance zone
- $64,020: Bollinger Band basis (middle band)
- $63,715: 23.6% Fibonacci retracement level
- $62,819: Lower Bollinger Band
A confirmed 4-hour close above $65,220 would validate a Bollinger Band breakout, potentially accelerating the move toward $67,000 and the $68,000 target identified by technical analysts. However, rejection at this level could pull Bitcoin back toward the middle band at $64,020.
Liquidation Heatmap Reveals Hidden Opportunities 🔥
The 3-day liquidation heatmap paints a fascinating picture of where leveraged traders have positioned themselves. Dense clusters of liquidations sit between $65,000 and $65,500, with additional pockets extending toward $66,000. This concentration of leveraged longs creates a potential short squeeze scenario—if Bitcoin breaks above these levels, forced liquidations could accelerate the upward move.
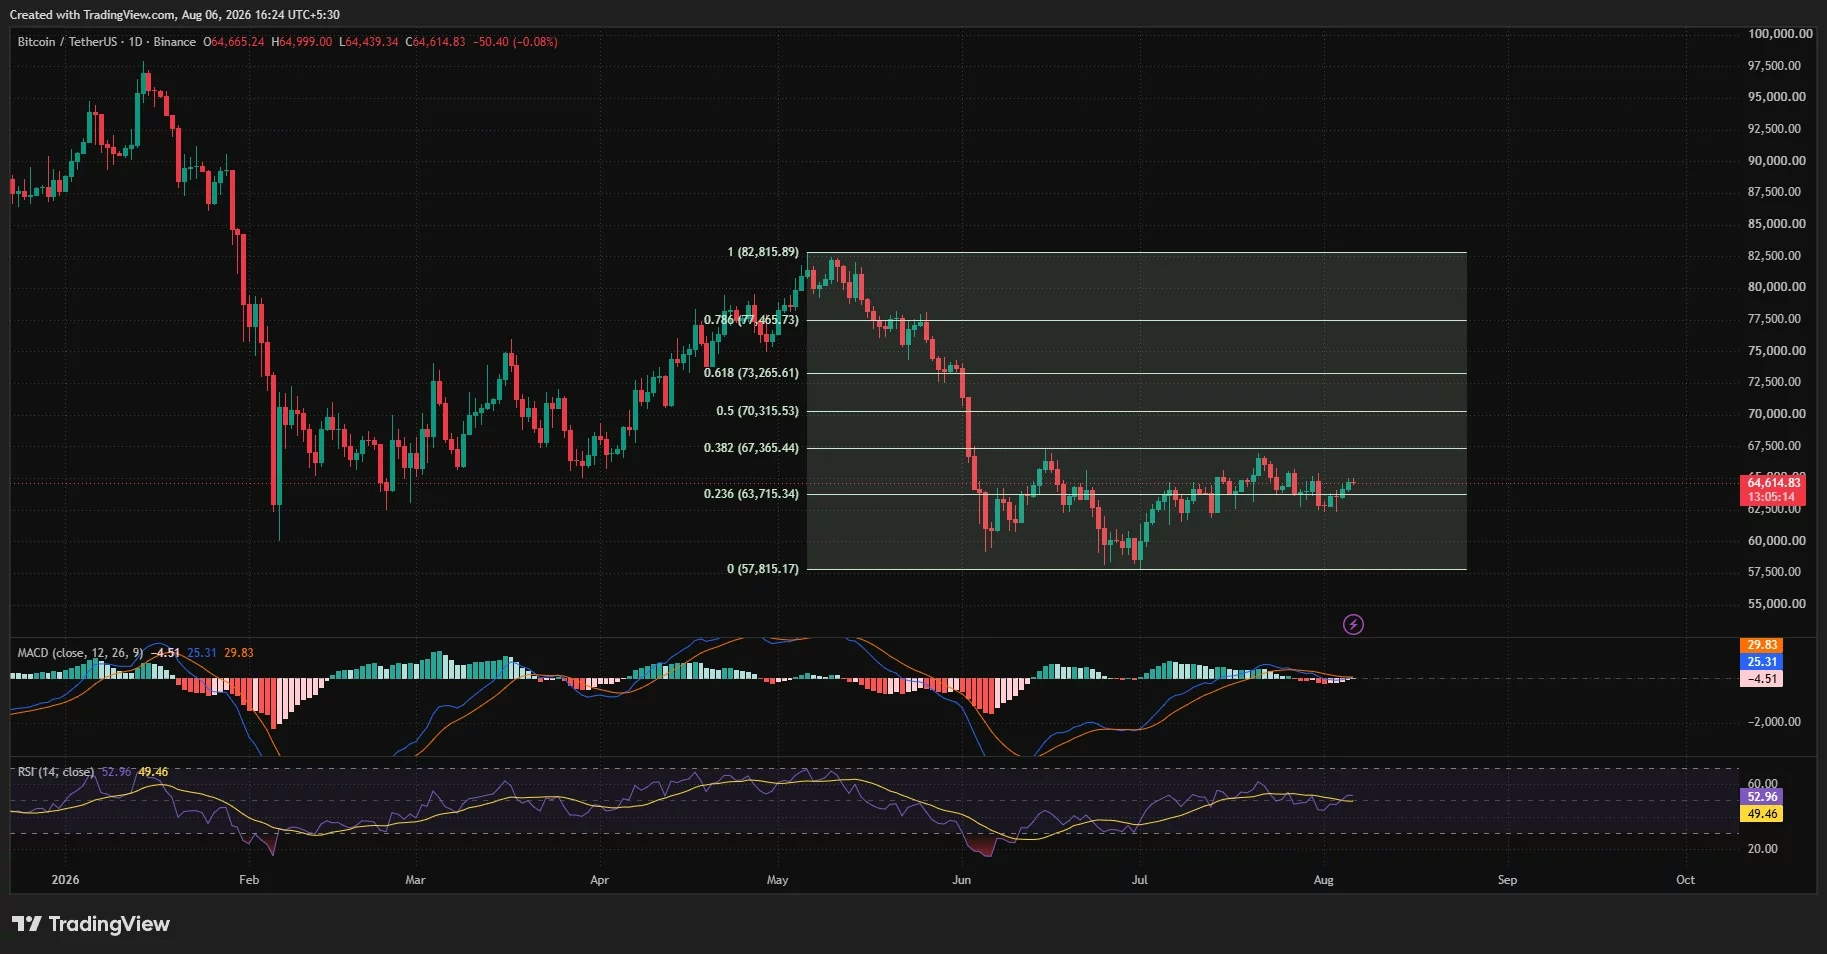
Conversely, downside liquidity pools sit around $63,700–$63,900 and $63,000–$63,200, representing potential support zones if the recovery falters. The $63,715 Fibonacci level aligns suspiciously close to the first downside liquidation cluster, suggesting that this area could attract price action if buyers lose conviction.
Daily Chart Signals Cautious Optimism ⚖️
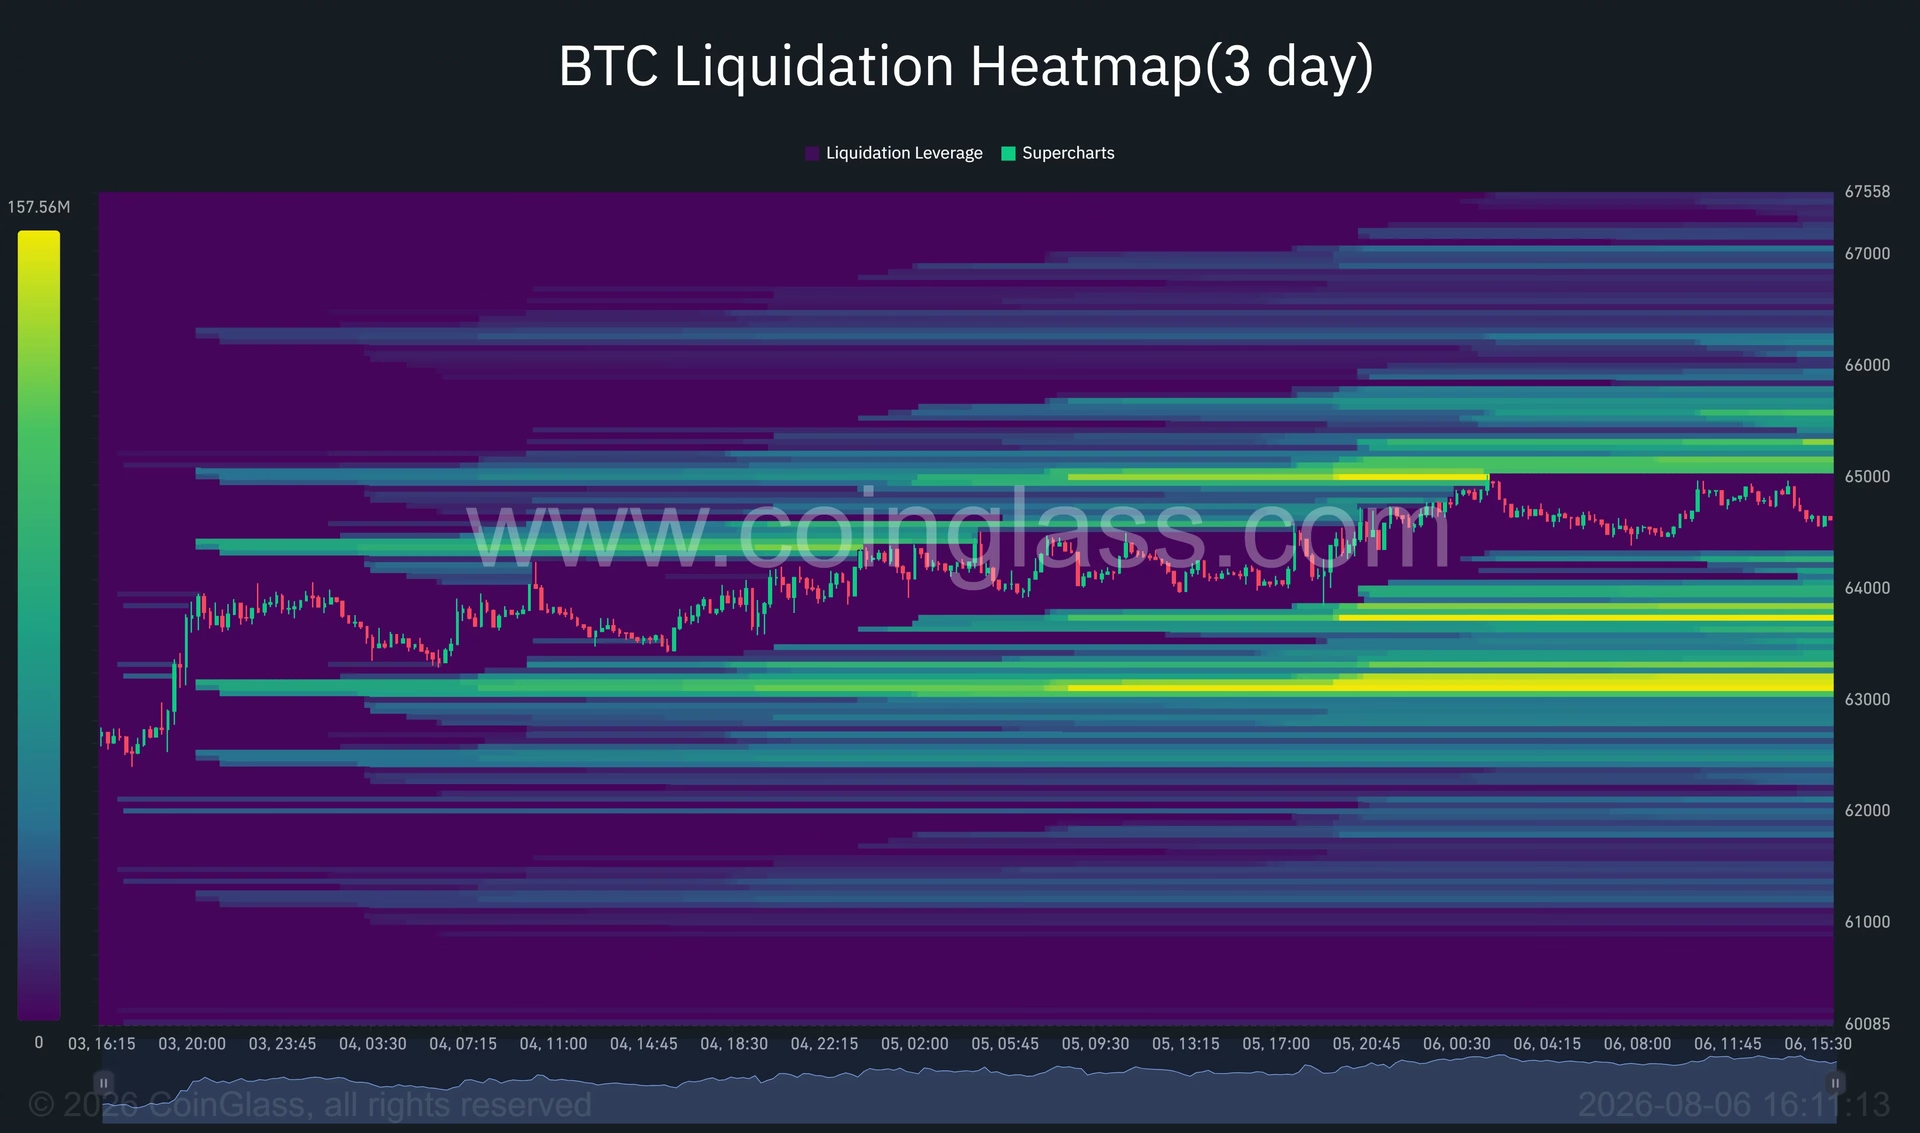
While the 4-hour timeframe shows building bullish momentum, the daily chart presents a more measured perspective. Bitcoin has successfully reclaimed the 23.6% Fibonacci retracement at $63,715, calculated from the February low of $57,815 to the May high of $82,816. This reclamation is significant because it demonstrates that the recovery is built on legitimate support levels rather than speculative momentum.
The daily Relative Strength Index (RSI) has risen to 52.96, sitting comfortably above its signal average of 49.46. This reading indicates mild bullish momentum without entering overbought territory—a healthy setup that suggests room for further upside without excessive technical extension.
However, the MACD indicator remains less convincing. The MACD line at 25.31 sits below the signal line at 29.83, with a slightly negative histogram of minus 4.51. While this suggests that bearish momentum is fading, a confirmed bullish crossover has yet to materialize. This divergence between momentum indicators and price action warrants cautious optimism rather than aggressive bullish conviction.
Analyst Perspectives on the $68,000 Target 👨💼
Technical analysts have begun identifying specific price targets for Bitcoin's next leg higher. Several prominent traders point to $65,000 as the immediate resistance that must fall before the next advance can unfold. Once this level is reclaimed, they suggest that $68,000 becomes the natural target for the next phase of the recovery.
Ted Pillows, a respected technical analyst, highlighted the significance of the $65,000 zone: "BTC is right at its $65,000 resistance zone. Reclaim this, and Bitcoin could rally towards $68,000 next." His analysis identifies further resistance around $67,400 and $69,700, which aligns closely with the daily Fibonacci resistance at $67,365.
Trader Lennaert Snyder emphasized the importance of the 4-hour close above $64,000 in triggering the latest advance, but cautioned that price remains elevated within its recent range. His perspective suggests that a potential sweep above $65,000 could occur before a sustained move higher, indicating that traders should prepare for temporary pullbacks even if the overall trend remains bullish.
Geopolitical Factors and Oil Market Dynamics 🌍
The recent Bitcoin recovery coincided with easing geopolitical tensions, specifically reports of progress between Iran and Oman regarding shipping routes through the Strait of Hormuz. This development carries significance for cryptocurrency markets because energy prices directly impact inflation expectations and central bank policy.
Brent crude oil remained below $80 per barrel as traders assessed the sustainability of these negotiations. Lower oil prices reduce inflation pressure, which theoretically supports risk assets including cryptocurrencies. Conversely, any breakdown in talks or renewed geopolitical tensions could reverse this positive dynamic, potentially triggering another rejection near $65,000.
It's worth noting that Bitcoin has underperformed equity markets during the early August period. While the S&P 500 gained more than 3% during the opening days of August, Bitcoin added only about 2% over the same period. This underperformance reflects Bitcoin-specific headwinds, including concerns surrounding the COLDCARD wallet exploit and questions about corporate treasury sales, which have dampened some of the recovery enthusiasm.
What Happens at Key Breakpoints? 🔀
If Bitcoin breaks above $65,220:
A confirmed Bollinger Band breakout would likely trigger accelerated buying as algorithmic traders and momentum followers enter positions. The next resistance zone around $66,000 would provide a secondary test before the $67,000–$68,000 target comes into play. This scenario could also trigger the short squeeze effect from liquidations, amplifying the upward move.
If Bitcoin fails to hold $63,715:
A breakdown below this critical Fibonacci level would invalidate the current recovery setup and expose the downside liquidity pools near $63,000–$63,200. Further weakness could return focus to the August 3rd recovery zone and the daily range floor near $60,000. A break beneath $60,000 would completely invalidate the sequence of higher short-term lows that has characterized the recent recovery.
U.S. Market Context and Federal Reserve Signals 📊
For American investors, Bitcoin's next move remains partially dependent on Wall Street risk appetite and incoming Federal Reserve communications. U.S. equity futures displayed mixed signals on August 6, with semiconductor weakness offsetting gains among large technology companies. This mixed sentiment creates an uncertain backdrop for Bitcoin's directional bias.
The Federal Reserve's stance on interest rates and inflation remains crucial for cryptocurrency valuations. Hawkish Fed expectations or signals of higher-for-longer interest rates would likely pressure Bitcoin near resistance levels, while dovish signals could accelerate breakouts. Market participants should monitor upcoming Fed communications and economic data releases for clues about the central bank's future policy direction.
The Path Forward: What Traders Should Watch 👀
Bitcoin's price action over the coming days will determine whether the recovery can establish a sustainable foundation for further gains. The decision point is clear: holding above $63,715 keeps the recovery intact, while a close above $65,220 would strengthen the case for $67,365 and $68,000.
Traders should monitor these key developments:
- Geopolitical news regarding the Strait of Hormuz negotiations and oil market dynamics
- Federal Reserve communications and U.S. economic data releases
- Liquidation dynamics as Bitcoin approaches $65,000–$65,500
- Equity market performance and risk sentiment indicators
- Technical confirmation of Bollinger Band breakouts on the 4-hour timeframe
Conclusion: Bitcoin at a Critical Juncture 🎬
Bitcoin's approach to the $65,000 resistance level represents a pivotal moment for the cryptocurrency's near-term trajectory. With technical indicators showing strengthening momentum, liquidation clusters positioned for a potential short squeeze, and analyst consensus pointing toward $68,000 as the next target, the setup appears constructive for bulls. However, the failure to significantly outperform equity markets, combined with Bitcoin-specific concerns, suggests that caution remains warranted.
The recovery from $62,300 demonstrates that buyers retain conviction at lower levels, but the true test comes at resistance. Whether Bitcoin can break through the $65,000–$65,220 zone will determine if $67,365 and $68,000 become realistic near-term targets or if the recovery stalls at this critical juncture. Market participants should remain vigilant, monitoring both technical levels and macroeconomic catalysts as this important price discovery process unfolds. ✨
You May Also Like

Market Analysis
XRP Price Falls 5% as Leverage Hits Seven-Month High
August 26, 2026

Market Analysis
Crypto Market Hits Extreme Greed: What This Means for Bitcoin
August 26, 2026

Market Analysis
Ethereum Price Rally Overheats Below $2,550 Resistance
August 26, 2026

Market Analysis
Hyperliquid Price Rally: HYPE Targets $97 Amid $80 Support
August 25, 2026